
It remains unknown why some intubated patients remain infection-free while others develop tracheobronchitis (VAT) or pneumonia (VAP).
ObjectiveTo identify and compare VAP/VAT gene expression “signatures” using genome-wide oligonucleotide microarrays.
Material and methodsA prospective translational study of gene expression profiles of VAP and VAT groups was carried out, establishing comparisons in both pre-infection and infection phases. Pathway and functional analyses were performed with Ingenuity Pathway Analysis (IPA). Data analysis and hierarchical clustering of the genes involved in the signalling pathways expressed differentially in the two groups were performed with GeneSpring GX 11.0.
ResultsEight patients developing respiratory infections (3 VAP and 5 VAT) after 4 days of mechanical ventilation were assessed. Comparison of gene expression profiles in the pre-infection period revealed 5595 genes expressed differentially between VAP and VAT (p<0.01, fold change >2). Comparative IPA analysis identified a significant depression of the complement system signalling pathway in the VAP group, affecting the classical pathway along with the final common pathway (p<0.05). In addition, the cAMP and calcium signalling pathways were also significantly depressed in the VAP group during the pre-infection phase also.
ConclusionIntubated patients complicated with pneumonia developed immune impairment in the pre-infection period, manifesting as a relatively lower expression of genes involved in the complement system that differed from patients developing tracheobronchitis. These findings suggest that a significant proportion of VAP episodes cannot be prevented, but might be treatable through pre-emptive therapy.
Seguimos sin saber por qué algunos pacientes intubados no sufren infecciones mientras que otros presentan traqueobronquitis (TAV) o neumonía (NAV).
ObjetivoIdentificar y comparar los patrones de la expresión genética de la NAV/TAV usando micromatrices multigénicas oligonucleotídicas.
Material y métodosSe realizó un estudio aplicado prospectivo de los patrones de la expresión genética de los grupos con NAV y TAV, estableciendo comparaciones tanto en la fase previa a la infección como en la fase infecciosa. Se realizaron análisis de vías y funcionales con Ingenuity Pathway (IPA). Los análisis de datos y el agrupamiento jerárquico de los genes implicados en las vías de señalización expresados de forma diferenciada en ambos grupos se realizaron con GeneSpring GX 11.0.
ResultadosSe evaluaron ocho pacientes que presentaron infecciones respiratorias (3 NAV y 5 TAV) después de 4 días con la ventilación mecánica. La comparación de los perfiles de la expresión genética durante el período previo a la infección reveló 5.595 genes expresados de forma diferenciada entre la NAV y la TAV (p<0,01, cambio múltiplo>2). Los análisis comparativos de los IPA identificaron una depresión importante de la vía de señalización del sistema del complemento en el grupo con NAV, que afectó a la vía clásica además de a la vía común final (p<0,05). Por otra parte, el monofosfato cíclico de adenosina y las vías de señalización del calcio también se vieron muy deprimidos en el grupo con NAV durante la fase previa a la infección.
ConclusiónLos pacientes intubados que presentaron complicaciones por la neumonía desarrollaron un trastorno inmunitario durante el período previo a la infección, que se manifestó como una expresión relativamente menor de genes implicados en el sistema del complemento diferente de la de los pacientes que presentaron traqueobronquitis. Estos resultados sugieren que no se puede evitar una importante proporción de los casos de NAV, aunque podrían ser tratables mediante un tratamiento preventivo.
Respiratory infections including pneumonia and tracheobronchitis remain the leading nosocomial infections in the ICU.1 Ventilator-associated tracheobronchitis (VAT) is manifested by purulent respiratory secretions.1 Differentiating VAT from ventilator-associated pneumonia (VAP) is mainly based on presence/absence of radiographic opacities, but the potential continuum of VAT to VAP is unknown.2,3 The incidence of VAT has been reported to be more common in surgical patients.4 Some reports suggest that patients with VAT also have increased length of ICU stay and a prolonged need for mechanical ventilation.5,6
To gain a better understanding of the molecular mechanisms that underlie the lung phenotypes in VAT vs VAP, we sought to identify and compare their gene expression “signatures” using genome-wide oligonucleotide microarrays. We hypothesized that VAP/VAT would exhibit different gene expression signatures which could help to distinguish between the two conditions and would also shed light on their pathogenesis. We also expected that specific signatures could lead to the identification of new biomarkers to aid in the diagnosis and classification of these diseases.
MethodsStudy designThis is a cohort study including ICU patients with VAP/VAT prospectively recorded. The protocol was approved by the ethical committee and informed consent was obtained from the next of kind prior to enrolment in the study. All patients enrolled were recorded anonymously in the registry.
Immunocompetent patients who were intubated and ventilated for more than 48h were eligible for the study and were followed up for a week. Patients, who developed nosocomial pneumonia before or after the occurrence of VAT, were excluded. Patients with chronic respiratory failure, patients who were not ventilated or ventilated for less than 48h, patients who received only noninvasive pressure ventilation, patients with tracheostomy at ICU admission, patients who had been treated with corticosteroids/immunosuppressive drugs and patients who were immunocompromised were not eligible and not included in the present study.
VAT was defined as the presence of all of the following in a patient endotracheally intubated and receiving mechanical ventilation for >48h: body temperature>38.3°C or <36.0°C, new or increased purulent tracheal secretions,7 positive culture of tracheal secretions at a concentration of ≥105cfu/ml, and no new or progressive infiltrate on portable chest radiograph. VAP was defined as the presence of a new or progressive pulmonary infiltrate and two of the following: temperature>38.3°C or <36.0°C, leukocyte count>12,000/mm3 or <4000/mm3, or purulent tracheal secretions. The diagnosis of VAP was considered to be microbiologically confirmed if either BAL or ETA cultures had significant growth. The presence or absence of a new or progressive radiographic infiltrate was based on the interpretation of the chest radiograph by board certified radiologists who were blinded to the study. According to the American-European consensus conference,8 a diagnosis of ARDS was assigned by the following criteria: acute onset; arterial hypoxemia with PaO2/FIO2 lower than 200 (regardless of PEEP level); bilateral infiltrates seen on chest radiograph; pulmonary artery occlusive pressure lower than 18mmHg or no clinical evidence of left atrial hypertension; and compatible risk factors.
All classifications, including the radiographs and laboratory data used in their determinations, were prospectively reviewed by one of the investigators (I.M.L.) and confirmed by a second investigator (J.R.). ETAs were only obtained when there was suspicion of either VAT or VAP. Specimens were obtained by nurses using a deep tracheal suctioning technique to obtain a specimen for culture. All ETAs and BAL cultures were processed using quantitative methods as previously described.9
Blood samples were taken daily during the study period. Samples for microarray analysis were distributed in two groups, based on the presence of ventilator-associated tracheobronchitis (VAT) or ventilator-associated pneumonia (VAP). Basic investigators remained blind to the final diagnosis. Attending to the timing of infection, two moments of disease evolution were established: pre-infection, defined as the period with absence of positive results in the microbiological test (from day 0 to 5) and infection, defined as the period with positive results in the microbiological test (from day 5 to 7). Gene expression profiles were compared between VAP and VAT groups in both pre-infection and infection phases.
Total RNA was extracted from blood samples using the PAXgene Blood RNA System (PreAnalytix, Hombrechtikon, Switzerland). RNA was quantified by spectrometry (NanoDrop ND1000, NanoDrop Technologies, Wilminton, DE, USA) and quality confirmed by RNA 6000 Nano Bioanalyzer (Agilent Technologies, Palo Alto, CA, USA) assay. Up to 1750ng of each RNA sample was concentrated with the RNeasy MinElute Cleanup kit (QIAGEN, Hilden, Germany). RNA was eluted with 10ml of RNase-free H2O. 300ng of purified total RNA were used to produce Cyanine 3-CTP-labeled cRNA using the Quick Amp Labeling kit (Agilent p/n 5190-0442) according to the manufacturer's instructions. Following ‘One-Color Microarray-Based Gene Expression Analysis’ protocol Version 5.7 (Agilent p/n 4140-90040), 3μg of labeled cRNA was hybridized with Whole Human Genome Oligo Microarray Kit (Agilent p/n G2519F-014850) containing 41,000+ unique human genes and transcripts. Arrays were scanned in an Agilent Microarray Scanner (Agilent G2565BA) according to the manufacturer's protocol and data extracted using Agilent Feature Extraction Software 9.5.3 following the Agilent protocol GE1-v5_95_Feb07 and the QC Metric Set GE1_QCMT_Jan08.
Microarray data analysisData analysis was performed in Microarrays & Medical Bioinformatics (MBM), Infection & Immunity Unit, Hospital Clínico Universitario-IECSCYL, Valladolid, Spain and Medical Bioinformatics Department, Institute of Health “Carlos III”, Madrid, Spain by using GeneSpring GX 11.0 software. The original data were cleansing and normalized using the robust multichip average (RMA) algorithm consists in three steps: background correction, quantile normalization and expression calculation. Subsequent to logarithms transformation, baseline transformation of the data was performed using the median of all samples.
Before statistical analyses all microarrays were subjected to quality and filtering criteria. Quality of the microarray data was assessed on principal component analysis (PCA) plots. All the 53 arrays passed these criteria and were included in the analyses.
Student's t tests (GeneSpring GX11.0) were used to identify genes differentially expressed between the VAP and the VAT groups in the pre-infection and infection periods at the level of significance p<0.01.
Pathways and functional analyses were generated using Ingenuity Pathway Analysis 8.5 (IPA) (Ingenuity Systems, Redwood City, CA) software. For IPA analyses, only significantly differentially datasets obtained in the GeneSpring analyses were analyzed for identification of those canonical pathways differentially expressed between comparison groups. Hierarchical clustering of the genes participating of the signalling pathways differentially expressed between groups was performed by using GeneSpring GX 11.0.
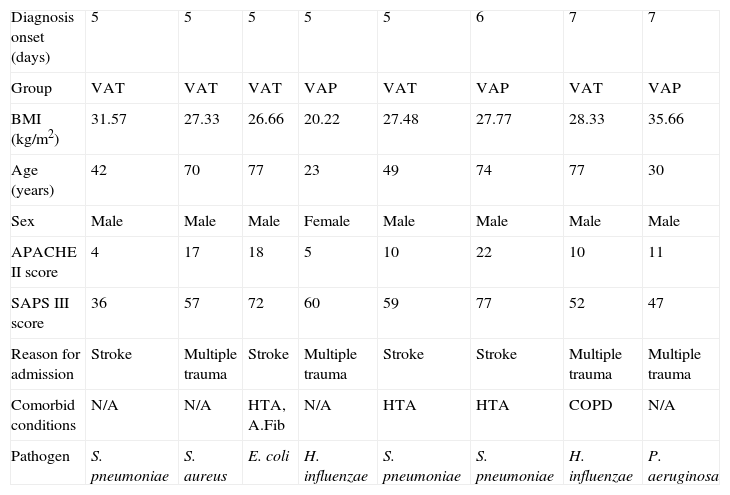
ResultsEight mechanically ventilated patients were enrolled: five who developed VAT and three VAP. Ventilator-associated infection was diagnosed in all patients after the 4th day. None had received antibiotics before ICU admission or received selective digestive decontamination, and all had started empirical antibiotic therapy when infection was suspected. All but one patient who developed VAP were male. The mean age was 55.2±22.1 years. Subjects were critically ill, with a mean±SD APACHE III score at ICU admission of 75±27. Descriptive data of the cohort are shown in Table 1 (additional material available online Table 1).
Clinical characteristics of the patients included according to the diagnosis onset.
| Diagnosis onset (days) | 5 | 5 | 5 | 5 | 5 | 6 | 7 | 7 |
| Group | VAT | VAT | VAT | VAP | VAT | VAP | VAT | VAP |
| BMI (kg/m2) | 31.57 | 27.33 | 26.66 | 20.22 | 27.48 | 27.77 | 28.33 | 35.66 |
| Age (years) | 42 | 70 | 77 | 23 | 49 | 74 | 77 | 30 |
| Sex | Male | Male | Male | Female | Male | Male | Male | Male |
| APACHE II score | 4 | 17 | 18 | 5 | 10 | 22 | 10 | 11 |
| SAPS III score | 36 | 57 | 72 | 60 | 59 | 77 | 52 | 47 |
| Reason for admission | Stroke | Multiple trauma | Stroke | Multiple trauma | Stroke | Stroke | Multiple trauma | Multiple trauma |
| Comorbid conditions | N/A | N/A | HTA, A.Fib | N/A | HTA | HTA | COPD | N/A |
| Pathogen | S. pneumoniae | S. aureus | E. coli | H. influenzae | S. pneumoniae | S. pneumoniae | H. influenzae | P. aeruginosa |
HTA: arterial hypertension, A.Fib: atrial fibrillation, COPD: chronic obstructive pulmonary disease, BMI: body mass index, APACHE II: Acute Physiology and Chronic Health Evaluation, SAPS: Simplified Acute Physiology Score, VAT: ventilator-associated tracheobronchitis, VAP: ventilator-associated pneumonia.
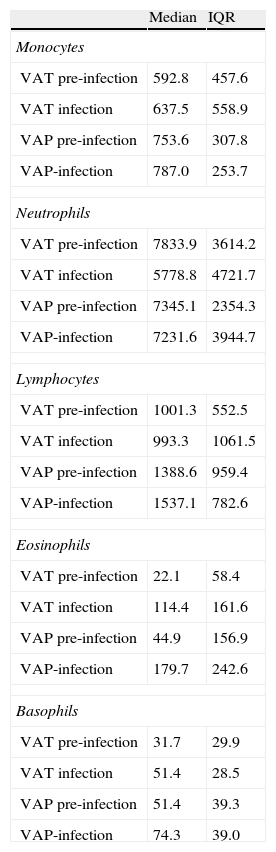
The number of samples analyzed in each phase was: in the pre-infection period: 20 samples from 5 VAT patients and 12 samples from 3 VAP patients; in the infection period: 15 samples from 5 VAT patients and 9 samples from 3 VAP patients. To determine the potential influence of quantitative changes of leukocytes subpopulations on our results, we compared the average concentration (cells/mm3) of lymphocytes, neutrophils, eosinophils, basophils and monocytes between VAT and VAP groups both in the pre-infection and infection periods (Table 2) and found no statistical differences.
Median concentration and interquartile range (cells/mm3) of monocytes, neutrophils, lymphocytes, eosinophils and basophils between VAT and VAP groups both in the pre-infection and post-infection periods.
| Median | IQR | |
| Monocytes | ||
| VAT pre-infection | 592.8 | 457.6 |
| VAT infection | 637.5 | 558.9 |
| VAP pre-infection | 753.6 | 307.8 |
| VAP-infection | 787.0 | 253.7 |
| Neutrophils | ||
| VAT pre-infection | 7833.9 | 3614.2 |
| VAT infection | 5778.8 | 4721.7 |
| VAP pre-infection | 7345.1 | 2354.3 |
| VAP-infection | 7231.6 | 3944.7 |
| Lymphocytes | ||
| VAT pre-infection | 1001.3 | 552.5 |
| VAT infection | 993.3 | 1061.5 |
| VAP pre-infection | 1388.6 | 959.4 |
| VAP-infection | 1537.1 | 782.6 |
| Eosinophils | ||
| VAT pre-infection | 22.1 | 58.4 |
| VAT infection | 114.4 | 161.6 |
| VAP pre-infection | 44.9 | 156.9 |
| VAP-infection | 179.7 | 242.6 |
| Basophils | ||
| VAT pre-infection | 31.7 | 29.9 |
| VAT infection | 51.4 | 28.5 |
| VAP pre-infection | 51.4 | 39.3 |
| VAP-infection | 74.3 | 39.0 |
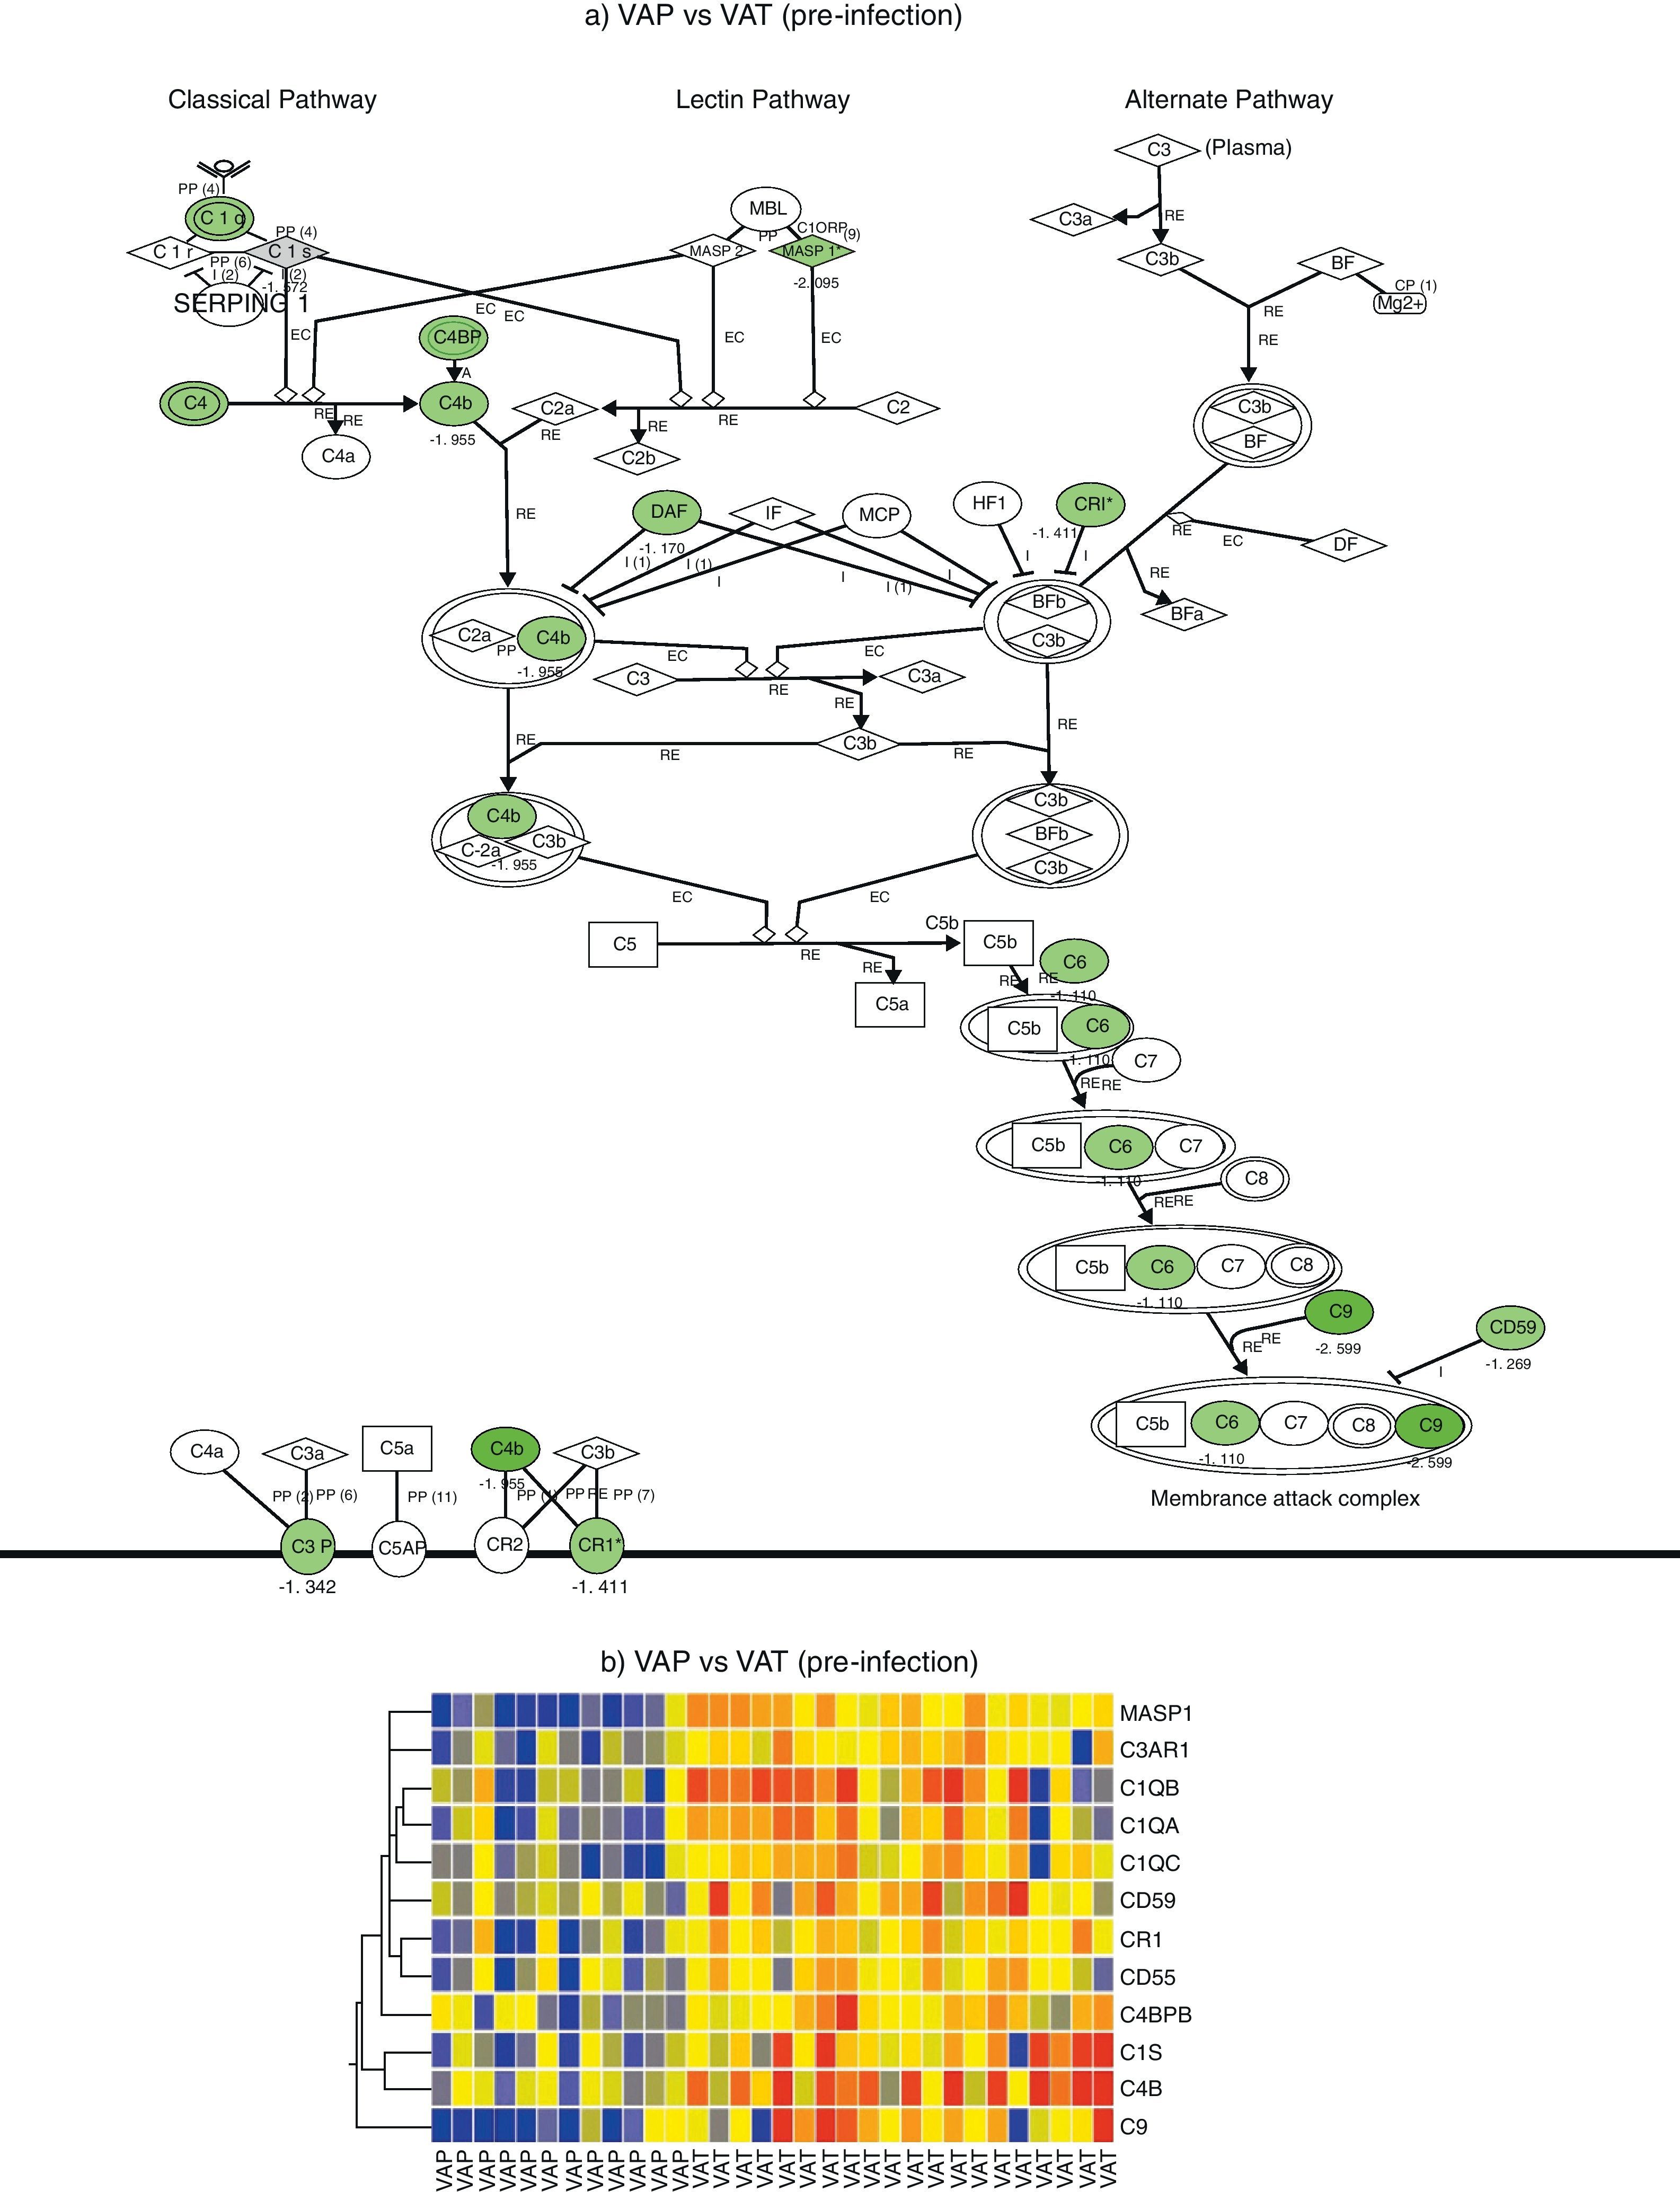
Comparison of gene expression profiles in the pre-infection period revealed 5595 genes differentially expressed between VAP and VAT (p value <0.01, fold change >2). IPA analysis identified a significant depression of the complement system pathway in the VAP group, affecting to the classical pathway along with the final common pathway (p<0.05) (Fig. 1). Genes found to be differentially expressed in this route were C6, C9, C1QA, C1QB, C1QC, C1S, C3AR1, C4B, C4BPB, CD55, CD59, CR1, and MASP1 (Table 2). In addition, the cAMP and the calcium signalling pathways were also significatively depressed in the VAP group (Fig. 1, Suppl. Table 1) during the pre-infection phase also.
 IPA canonical pathway modelling of the complement system pathway in the pre-infection phase. Those genes with relative lower expression in VAP vs VAT are depicted in green. (b) One-way hierarchical clustering of those genes selected by IPA (red, upregulated; blue, downregulated) in the pre-infection and infection phases in VAP and VAT.")
Complement system gene expression analysis. (a) IPA canonical pathway modelling of the complement system pathway in the pre-infection phase. Those genes with relative lower expression in VAP vs VAT are depicted in green. (b) One-way hierarchical clustering of those genes selected by IPA (red, upregulated; blue, downregulated) in the pre-infection and infection phases in VAP and VAT.
On the other hand, comparison of gene expression profiles during the infection period showed 8724 genes differentially expressed between VAP and VAT (p value <0.01, fold change >2). Although not significant differences were found between VAP and VAT for the complement signalling pathway, as showed by IPA, expression of 8 genes participating of this route were significatively depressed in the VAP group compared to the VAT one (Fig. 1). As in the previous phase, IPA evidenced a comparative depression of the cAMP signalling pathway in the VAP group (Suppl. Table 1).
DiscussionThis is the first study to compare gene expression profiles of critically ill patients suffering from VAP and VAT. Gene expression profiles in the pre-infection period identified a significant depression of the complement system pathway in the VAP group compared to the VAT group, affecting to the classical pathway along with the final common pathway. This suggests that intubation by itself is associated with different degrees of immunocompromise that facilitates different infectious complications.
Surveillance cultures every 48–72h in patients with ARDS, using either a protected specimen brush or BAL, have shown that tracheobronchitis can occur before the onset of VAP with tracheal colonization in only 56% of patients and was not predictive of VAP developing. The range of time from colonization to the development of VAP was 2–6 days.10 Conceivably, then, an as yet unidentified intermediate process may allow the bacterial burden to develop VAT before VAP, and this intermediate period may constitute an excellent time window in which to halt the progression.
Other data in mechanically ventilated patients suggest a similar dichotomy between upper and lower airway colonization patterns. As the upper airways have contact with pathogenic microbes, immune recognition principles have to be tightly controlled.
In our study we mainly observe a suppression of genes involved in the classical pathway and converge for common pathway of complement activation. Complement activation is a key component for maintaining internal inflammatory homeostasis. The complement system is a set of more than thirty proteins which serves as an important effector arm in the immune defense and contributes to the first-line host defense.11,12 It comprises an essential link between the innate and adaptive immune system,13,14 as its proteins identify invading bacteria and label them for phagocytosis or lysis.
Monocytes actively produce proteins of the complement system. In consequence, altered numbers of monocytes in peripheral blood could contribute to explain the observed differences in the gene expression profiles between groups. To determine the potential influence of quantitative changes of leukocytes subpopulations on our results, we compared the average concentration of lymphocytes, neutrophils, eosinophils, basophils and monocytes between VAT and VAP groups both in the pre-infection and infection periods and revealed no significant differences between groups. This supports that relative depression in the expression values of the genes associated to complement function in the VAP group compared to VAT in the pre-infection period should be potentially due to functional changes induced by the disease, and not to quantitative changes in leukocyte subpopulations.
Comparing the gene expression profiles of VAP and VAT, the cAMP signalling pathways were significantly depressed in the VAP group. During the development of the immune systems, cAMP regulates cell proliferation, differentiation and apoptosis.15 Recent studies have demonstrated that cAMP is necessary for T cell activation.16 In contrast, other studies have shown it to be a potent immunosuppressant: in murine dendritic cell (DC) models, other authors17 have demonstrated that increased levels of cAMP in DC down-regulated the stimulatory molecules CD80 and CD86. Another pathway with differential gene expression was the calcium signalling pathway. Calcium is involved many biological and immune system functions such as T lymphocyte activation,18 the immunological synapse (IS) between T cells and antigen-presenting cells19 and phagocytosis.20 However, the depression of the cAMP and Ca pathway genes is difficult to interpret as almost every cell uses these pathways at the initiation of different signalling pathways and this effect should be elucidated in future studies.
In our study, patients who developed VAP had lower gene expression in the complement signalling pathways. In recent years, immodulatory therapies in sepsis were driven by the assumption that the adverse outcomes were related to an overly exuberant inflammatory response. However, recent evidence on cytokine production in response to bacterial antigens, lymphocyte proliferation in response to recall antigens, and new antigen presentations as markers of the immune function has been published. Immunoparalysis should be taken into account as a continuum along which patients with VAP presented a less compartimentalised infection.
The present study has some strengths and weaknesses. First, a control population of patients matched by severity and diagnoses who underwent ventilation for equivalent times but did not develop VAP or VAT would be advisable. Unfortunately, lack of financial support precludes microarray analysis of controls. Therefore, our findings constitute a pilot study and needs to be validated before generalization, because selection bias cannot be excluded.
Second, VAP does not have gold standard. Indeed, there was a possible overlap in clinical signs between VAT and VAP, and ICU chest X-rays have limitations in sensitivity to identify opacities. Indeed, as Kollef21 suggested, episodes of VAT might constitute only airways colonization, or perhaps small pneumonia in some patients. CT scan was not implemented for diagnosis because this technique is expensive and is not part of standard care; in addition, transfers to CT scan in intubated patients present safety concerns. Moreover, other opacities such as atelectasis or ARDS cannot be ruled out.22 Indeed, Craven et al.22 have acknowledged this potential bias. The third major limitation of our study is that we only followed patients until infection onset. Cobb et al.23,24 reported that the onset of an infection-specific transcriptional program may precede the clinical diagnosis in patients who developed VAP based on the Riboleukogram. The main aim of that study was to determine whether VAP/VAT exhibits different gene expression signatures that might explain divergent pathways leading to VAT/VAP as a continuum between bronchitis and pneumonia in mechanically ventilated patients. Fourth, our findings cannot be generalized to pneumonias developing after one week of ventilation, but 80% of episodes of VAP present during the first 10 days.25,26 Finally, the sample size is relatively small and gene expression profiles between Gram-positive and Gram-negative pathogens could not be determined, but the number of samples obtained was sufficient to generate statistically significant differences with a large number of genes being functionally involved in the immune response. This is the first study to investigate the biological plausibility between VAT and VAP.
In summary, this study suggests that intubated patients with VAP show a relative depression of the genes involved in the complement system, cAMP, and calcium signalling pathways which all play a key role in the immune response to bacteria. The relative depression of these routes may lead to an impaired immunocompetence status, and contributes to explain why patients with VAP exhibit more inflammation and worse outcomes than those with VAT. Therefore, therapy of VAP should be more aggressive than VAT. Our findings suggest that VAP does not have an abrupt onset and risk of VAP might be anticipated by identification of the signature that precedes pneumonia, facilitating pre-emptive therapy. Moreover, this translational study offers insight to improve the understanding of pathogenesis of VAP vs VAT, with implications on prevention. Indeed, early development of immunocompromise in the post-intubation period suggests that not all episodes of VAP are preventable and “pneumonia zero” is not a realistic objective.
Conflict of interestThe authors declare that they have no conflict of interest.
We are indebted to Michael Maudsley (Universitat de Barcelona) for editorial assistance and language editing. We thank H. Goosens, Belgium, for critical review of the manuscript. This work was supported by CIBERes nodo 18 and EMER07/050.