

To evaluate SAPS 3 performance in Spain, assessing discrimination and calibration in a multicenter study.
DesignA prospective, multicenter study was carried out.
Patients and settingA prospective cohort study was performed in Spanish hospitals between 2006 and 2011.
Measurements and resultsA total of 2171 patients were included in the study. The mean age was 61.4±16.09 years, the ICU mortality was 11.6%, and hospital mortality 16.03%. The SAPS 3 score was 46.29±14.34 points, with a probability of death for our geographical area of 18.57%, and 17.97% for the general equation. The differences between observed-to-predicted mortality were analyzed with the Hosmer–Lemeshow test, which yielded H=31.71 (p<0.05) for our geographical area and H=20.05 (p<0.05) for the general equation. SAPS 3 discrimination with regard to hospital mortality, tested using the area under the ROC curve, was 0.845 (0.821–0.869).
ConclusionOur study shows good discrimination of the SAPS 3 system in Spain, but also inadequate calibration, with differences between predicted and observed mortality. There are more similarities with regard to the general equation than with respect to our geographical area equation, and in both cases the SAPS 3 system overestimates mortality. According to our results, Spanish ICU mortality is lower than in other hospitals included in the multicenter study that developed the SAPS 3 system, in patients with similar characteristics and severity of illness.
Analizar el funcionamiento del sistema SAPS3 en España, evaluando la discriminación y calibración en un estudio multicéntrico.
DiseñoEstudio prospectivo de cohortes, multicéntrico.
ÁmbitoHospitales españoles entre 2006 y 2011.
Variables de interés y resultadosSe incluyó en el estudio a un total de 2171 pacientes. La edad media fue 61,4±16,09 años, la mortalidad en UCI fue del 11,6% y la mortalidad hospitalaria 16,03%. El score SAPS 3 fue de 46,29±14,34 puntos, con la probabilidad de morir por la ecuación de nuestra área geográfica 18.57%, y 17.97% para la ecuación general. Las diferencias entre la mortalidad observada y la predicha se analizaron mediante el test de Hosmer–Lemeshow. Este test mostró H=31,71 (p<0,05) para nuestra área geográfica y H=20,05 (p<0,05) para la ecuación general. La discriminación del SAPS 3 con respecto a la mortalidad hospitalaria, testada mediante el área bajo la curva ROC, fue 0.845 (0,821–0,869).
ConclusiónNuestro estudio muestra, en España, una buena discriminación del sistema pronóstico SAPS 3 pero una inadecuada calibración, con diferencias entre la mortalidad predicha y, la observada. Hay más similitudes con respecto a la ecuación general que con la ecuación de nuestra zona geográfica, y en ambos casos, el sistema SAPS 3 sobreestima la mortalidad. De acuerdo con los resultados, la mortalidad en UCI es menor que la de otros hospitales incluidos en el estudio multicéntrico que se utilizaron para desarrollar el sistema SAPS 3, en pacientes con similares características y severidad de la enfermedad.
Since the original scoring prognosis system was developed more than 30 years ago in an Intensive Care Unit (ICU), these systems have evolved over time and substantially improved to the present day, which is fundamental for the results evaluation and clinical investigation.1
Prognosis systems have several roles; among those worth mentioning are: quality control by measuring hospital mortality, population description and severity of illness quantification; and in clinical investigations they are fundamental for confounding bias control. As quality control, prognosis systems allow analysis of whether the observed ICU mortality is higher or lower in a setting that differs from that it was created and validated from. We use the SMR (Standardized Mortality Ratio) to compare observed vs expected mortality in a group of patients.
A large number of prognosis systems have been created specifically for intensive care, including, in particular, APACHE, SAPS and MPM, which present multiple versions. A constant improvement of these instruments is necessary, as well as an adjustment to diagnosis and treatment changes that occur over time. Because of this, it is necessary to establish consecutive versions. This process will continue in the future. The latest versions of these systems are: version IV of the APACHE system,2 the Apache II,3 the most widely used index. A version of the APACHE III was originally published in 1998,4 of which group is the author5 exists and is specifically customized for Spain. The latest version of the MPM system is the MPM-3.6 And the current version of the SAPS system is the SAPS-3, which is widely used.7,8 When a prognosis system is created, it is necessary to test the performance in both the same and different investigation groups to those in which they were developed9. Numerous studies have been carried out on SAPS 3 in different populations and situations: Austria,10 Italy,11 Brazil12 and Korea.13 This calibration has been initiated in Spain.
In Spain, one hospital has published their results with SAPS314 but a multicenter study, similar to that undertaken in other countries, needs to be undertaken in Spain. The result of a single center, though reflect the performance of that center, do no necessarily reflect the performance of the whole country.
The objective of the present study was to evaluate the performance of SAPS 3 in Spain, assessing discrimination and calibration in a multicenter study.
Materials and methodsThe study was performed in several Spanish ICUs. In Motril, Santa Ana Hospital (Granada), Carlos Haya Hospital (Málaga), Virgen de las Nieves (Granada), Fuenlabrada Hospital (Madrid), Infanta Margarita Hospital in Cabra (Córdoba) and Neuro-traumatologic Hospital (Jaén). We selected all patients admitted consecutively during a period, which was different depending on each hospital, and the minimum period to participate into the study was 2 months. That period was: from January to April 2006 in Virgen de las Nieves Hospital in Granada; throughout the whole of 2011 in Fuenlabrada Hospital, from June 2006 to October 2007 in Santa Ana Hospital in Motril, and 2 months in 2011 in Neurotraumatologic Hospital in Jaén, in Carlos Haya Hospital and in Infanta Margarita Cabra.
The study was approved by the ethics committees of the hospitals.
The protocol we used to collect data and the analysis instruments in this study had been carried out in Virgen de las Nieves along several years where some authors have worked and through this activity they have published some articles along the same lines.5,15,16 And update protocol was used by Santa Ana hospital in 2006 and for the rest of hospital during 2011.
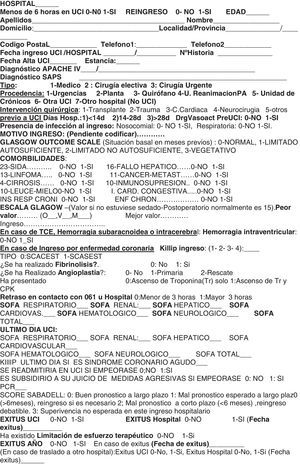
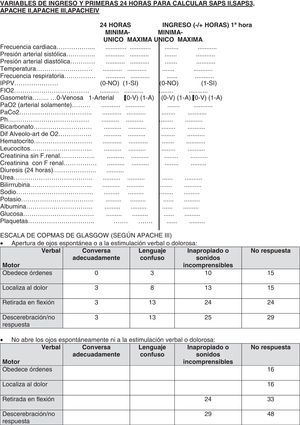
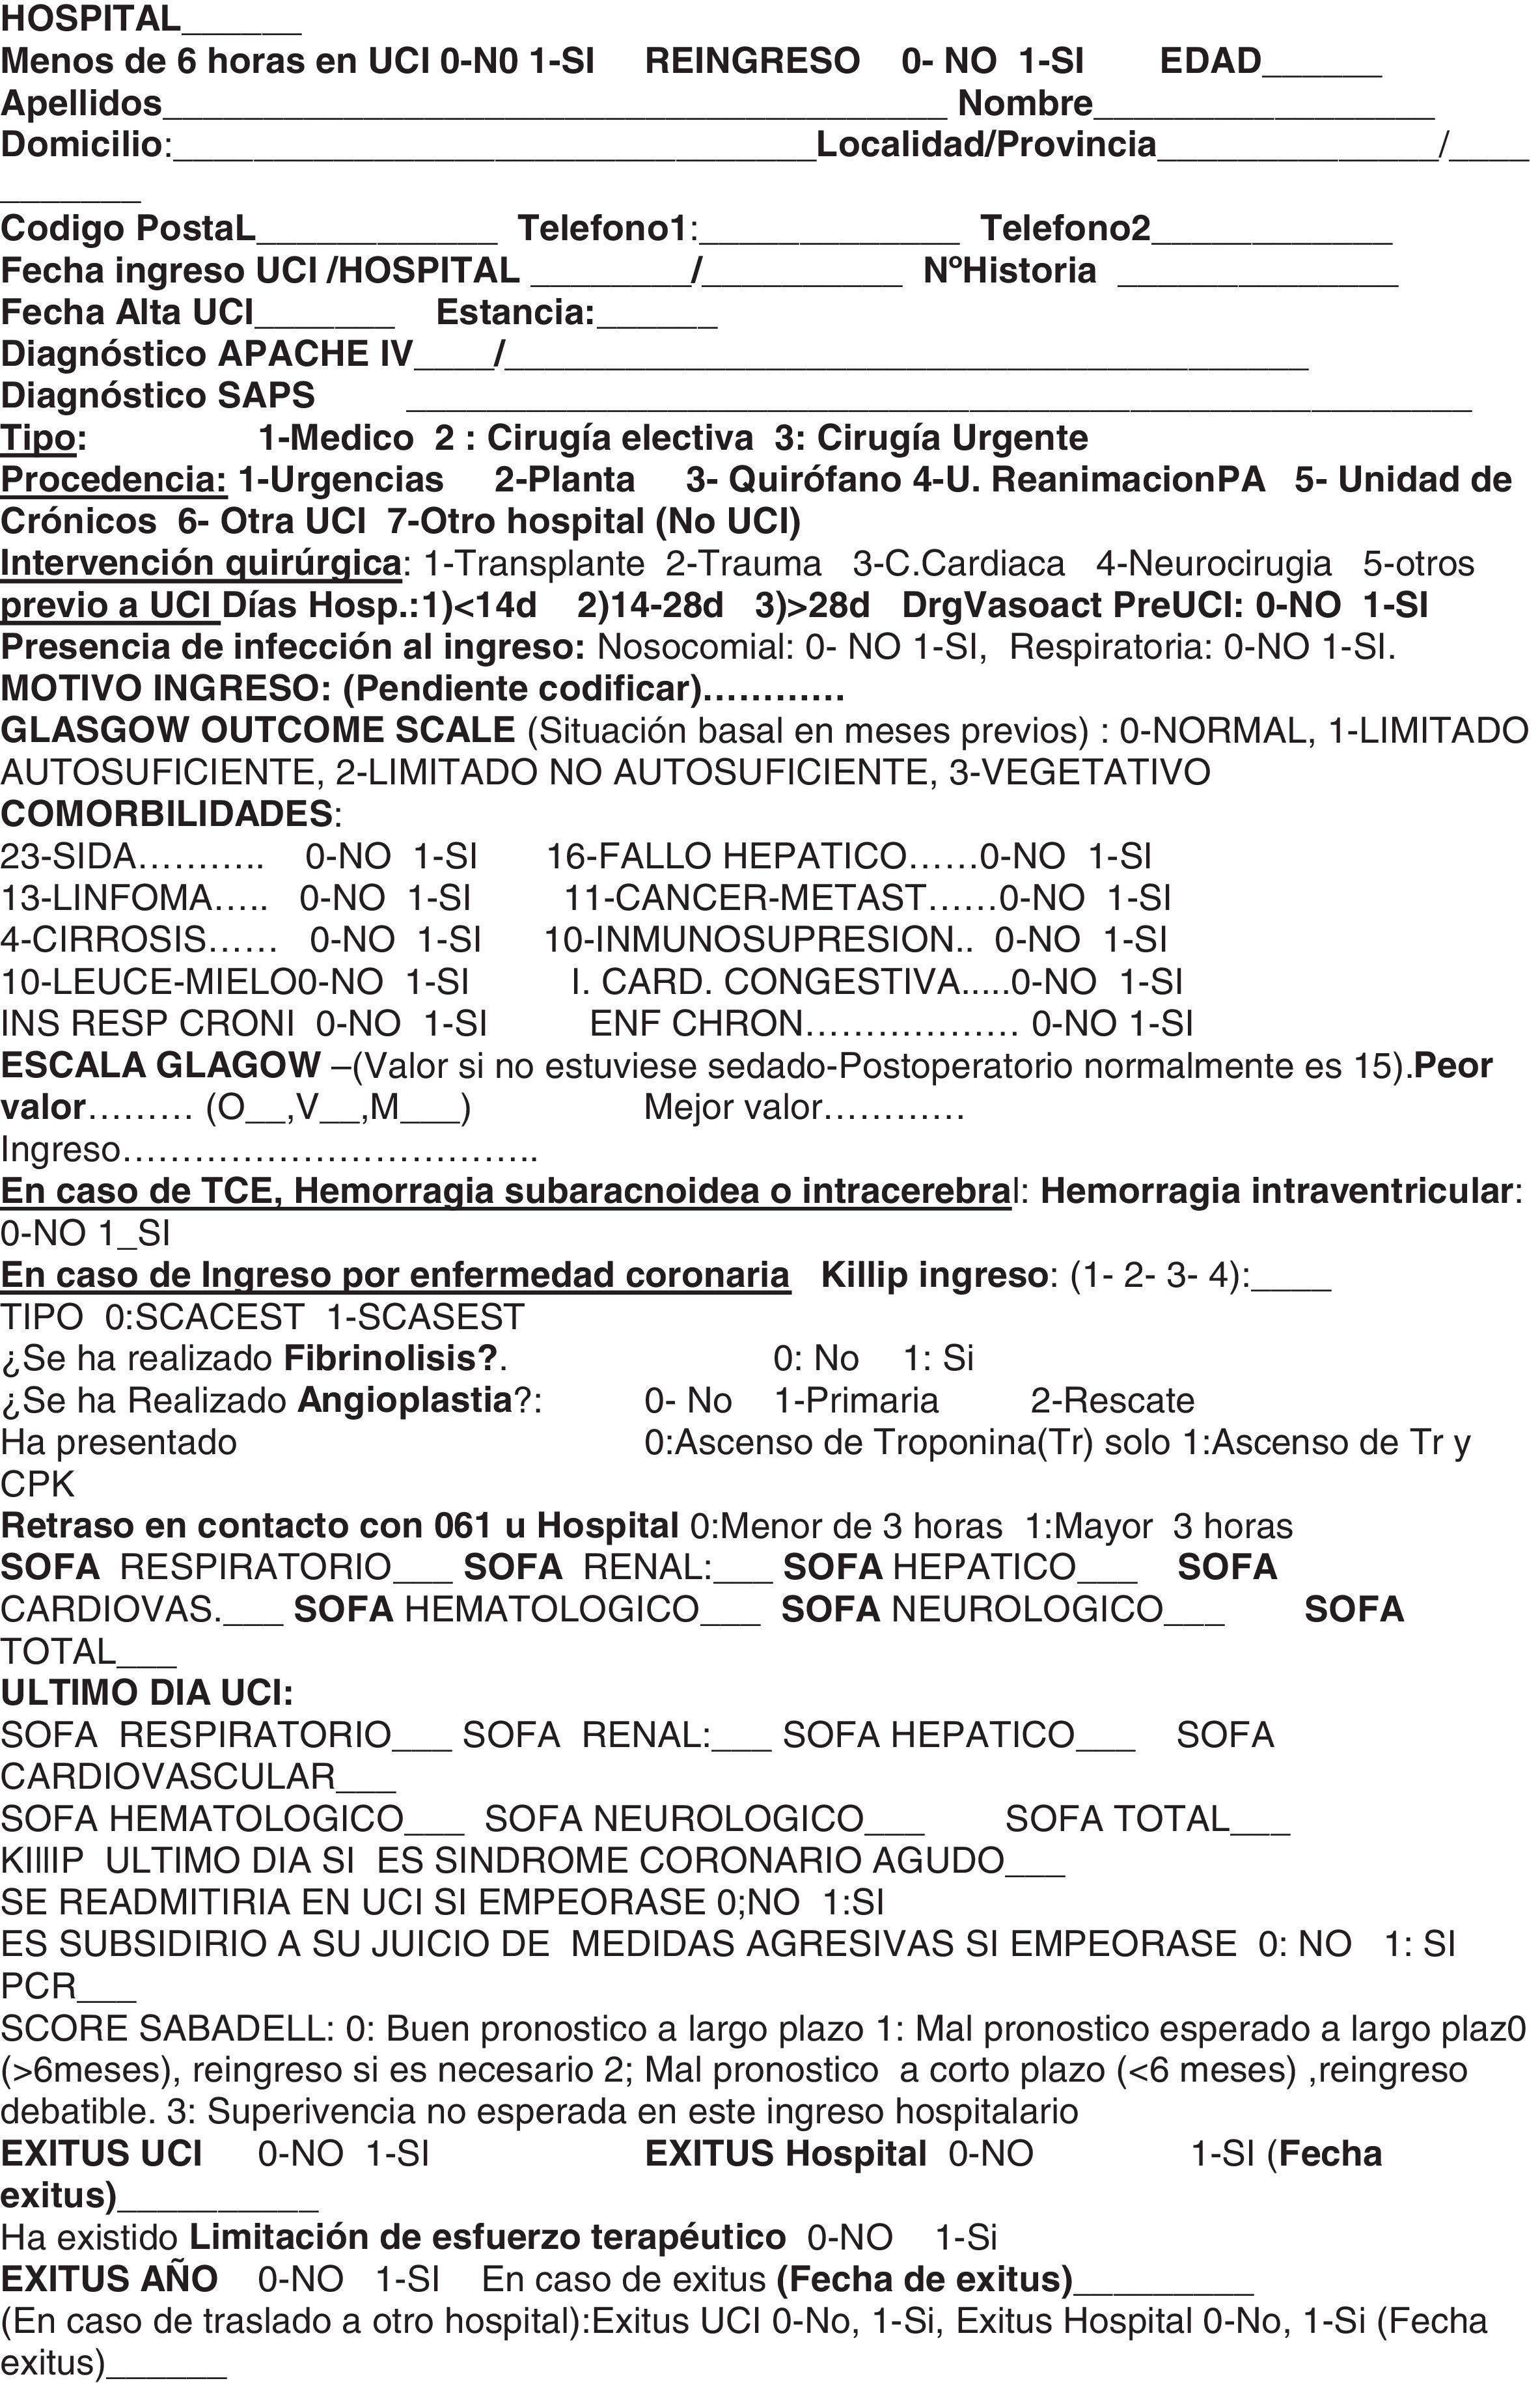
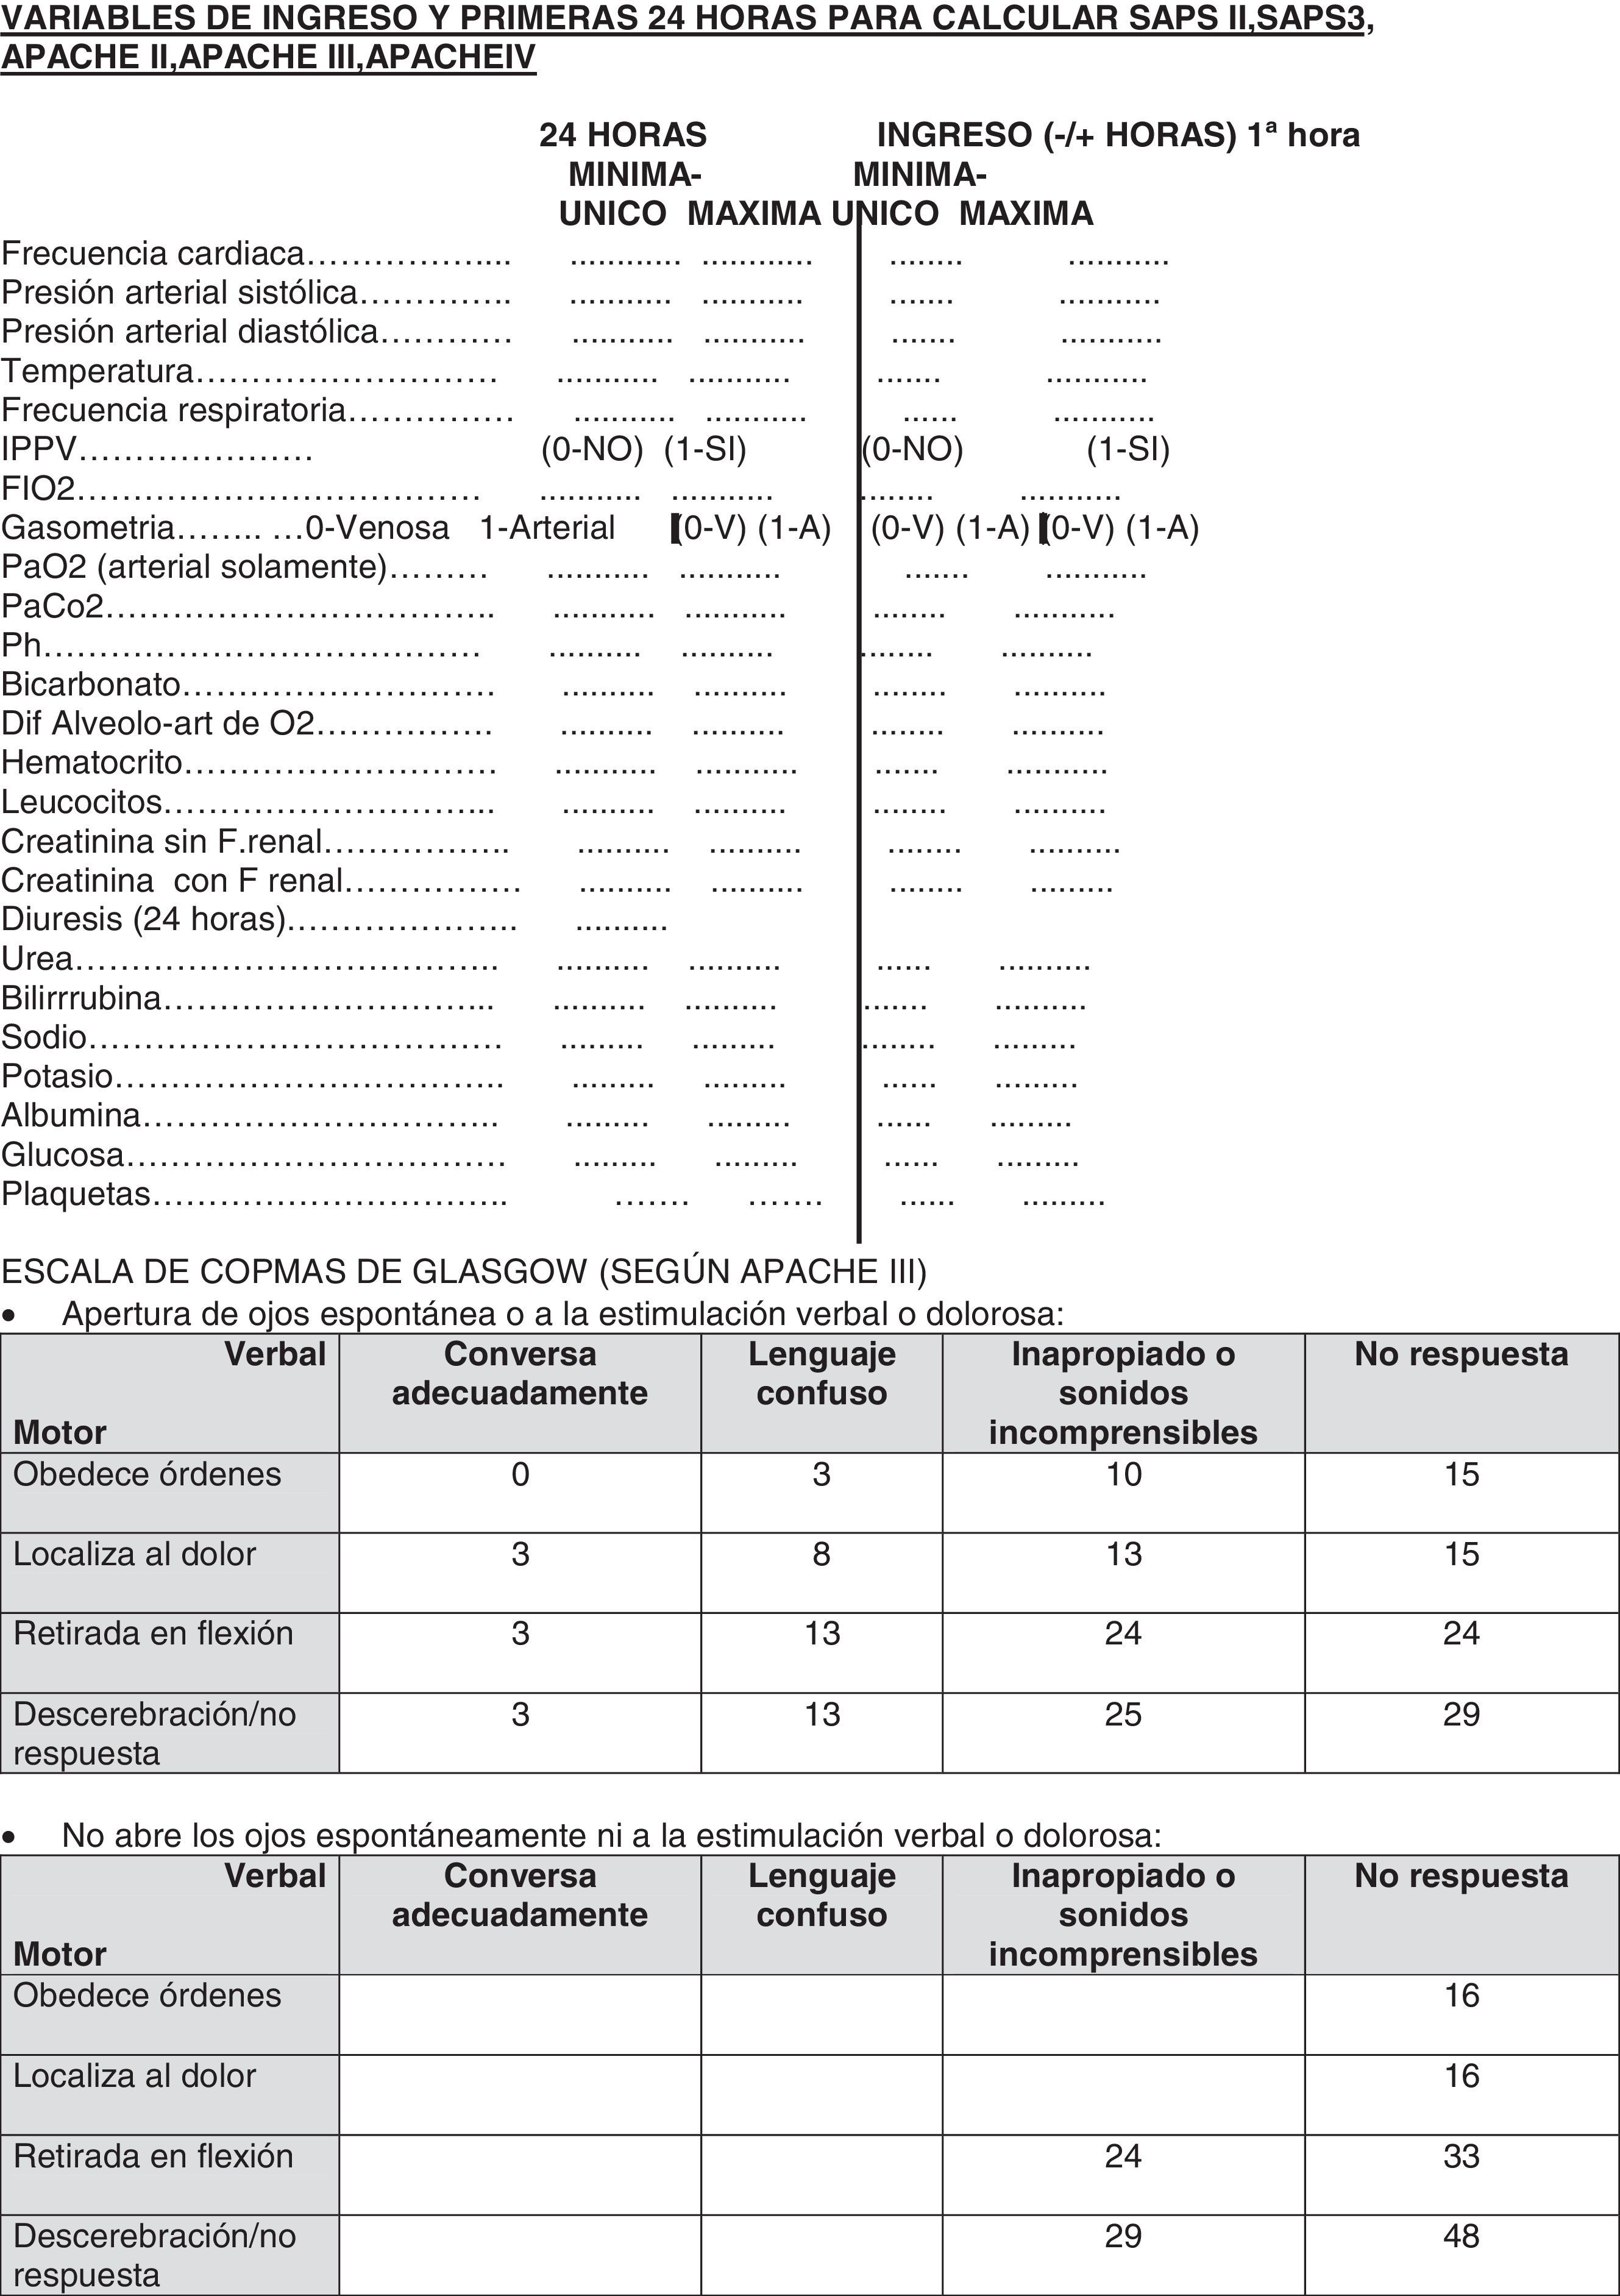
As we have said before, in four of the hospitals included in our study we have used a common protocol that collects administrative data, age, length of ICU and hospital stay, previous admission location and comorbidities, diagnosis, etc. (Anexo 1) Furthermore, as well as physiological medical laboratory variables in the first hour before and after ICU admission and during the first 24h, all the necessary variables for the SAPS 3 prognosis system calculation were used. Variables were collected in one database to use according to necessity. In Virgen de las Nieves Hospital (Granada), a different protocol was used, and this allowed only calculation from SAPS 3, collecting, in one database, all the variables which are necessary for SAPS 3 calculation. And finally, in Fuenlabrada Hospital they used the SAPS 3 online calculator, without saving all the values of the variables in all the cases for the index calculation.
With respect to quality control, we have insisted first of all, in the inclusion of totality of patients in selected period, because selection bias could affect study validity. Not to include a little number of dead patients could change study results. This selection bias is one of the most important problems in this kind of studies. We have analyzed inconsistent data with others as indirect quality control. Besides, we have used the online calculator as a quality control in a random group of patients, checking the similarity between our calculated value and the online calculator value. This instrument has been useful for checking the normal working about routine informatic we have used for the SAPS 3 calculation and the probability of death.
We have studied the ICU and hospital mortality (ICU and ward) of the episode. We have also specified whether the patients were admitted for acute coronary syndrome. These kinds of patients are a large group which we expect to study in a separate article, but we have included in this study. The protocol, which included the necessary information, was gathered by trained personnel from the participant hospitals (specialist doctors, residents and nurses).
Data were expressed as means±standard deviation and qualitative variables as absolute and relative frequencies or percentages. The PSPP and R statistical programs were used. To assess calibration of the SAPS 3 equation we applied the Hosmer–Lemeshow test.17 In this analysis, p>0.05 showed a goodness of fit. The discrimination was assessed using the area under ROC curve (Receiver Operating Characteristics).18 The Standardized Mortality ratio (SMR) was calculated as the relation between the numbers of observed and expected deaths.
ResultsA total of 2171 patients were included in the study. The mean age of the patients was 61.4±16.09 years. ICU mortality was 11.6% and hospital mortality was 16.03%. SAPS 3 score was 46.29±14.34. The probability of mortality by Spanish equation (South western SAPS 3 model) was 18.57% and by the general equation 17.97%. Hospital mortality was 16.03%, as we said before. SMR was 0.89 (0.80–0.98) by general equation and 0.86 (077–0.95) by Spanish equation.
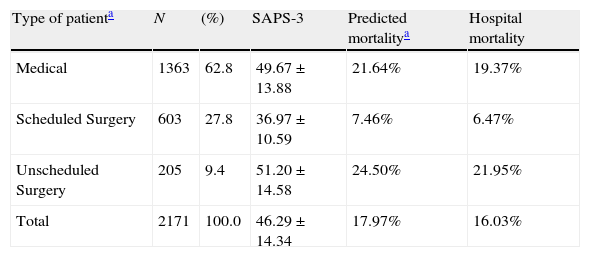
The type of patients was known in all the hospitals. Data are shown in Table 1.
Basic demographic data. Type of admission.
Out of 2171 patients in which the type of patients was known, the admission was programmed in 603 patients (27.8%) and not programmed in the rest.
There were 489 patients (22.5% out of total) admitted with ischemic cardiopathy, both STEMI and NSTEMI. Hospital mortality of 489 patients with ischemic cardiopathy was 8.18% and predicted mortality by general equation was 12.45% and by south-western SAPS-3 model 13.17%. This kind of patients has been included in the present study but they will be studied more carefully and individualized in another new study.
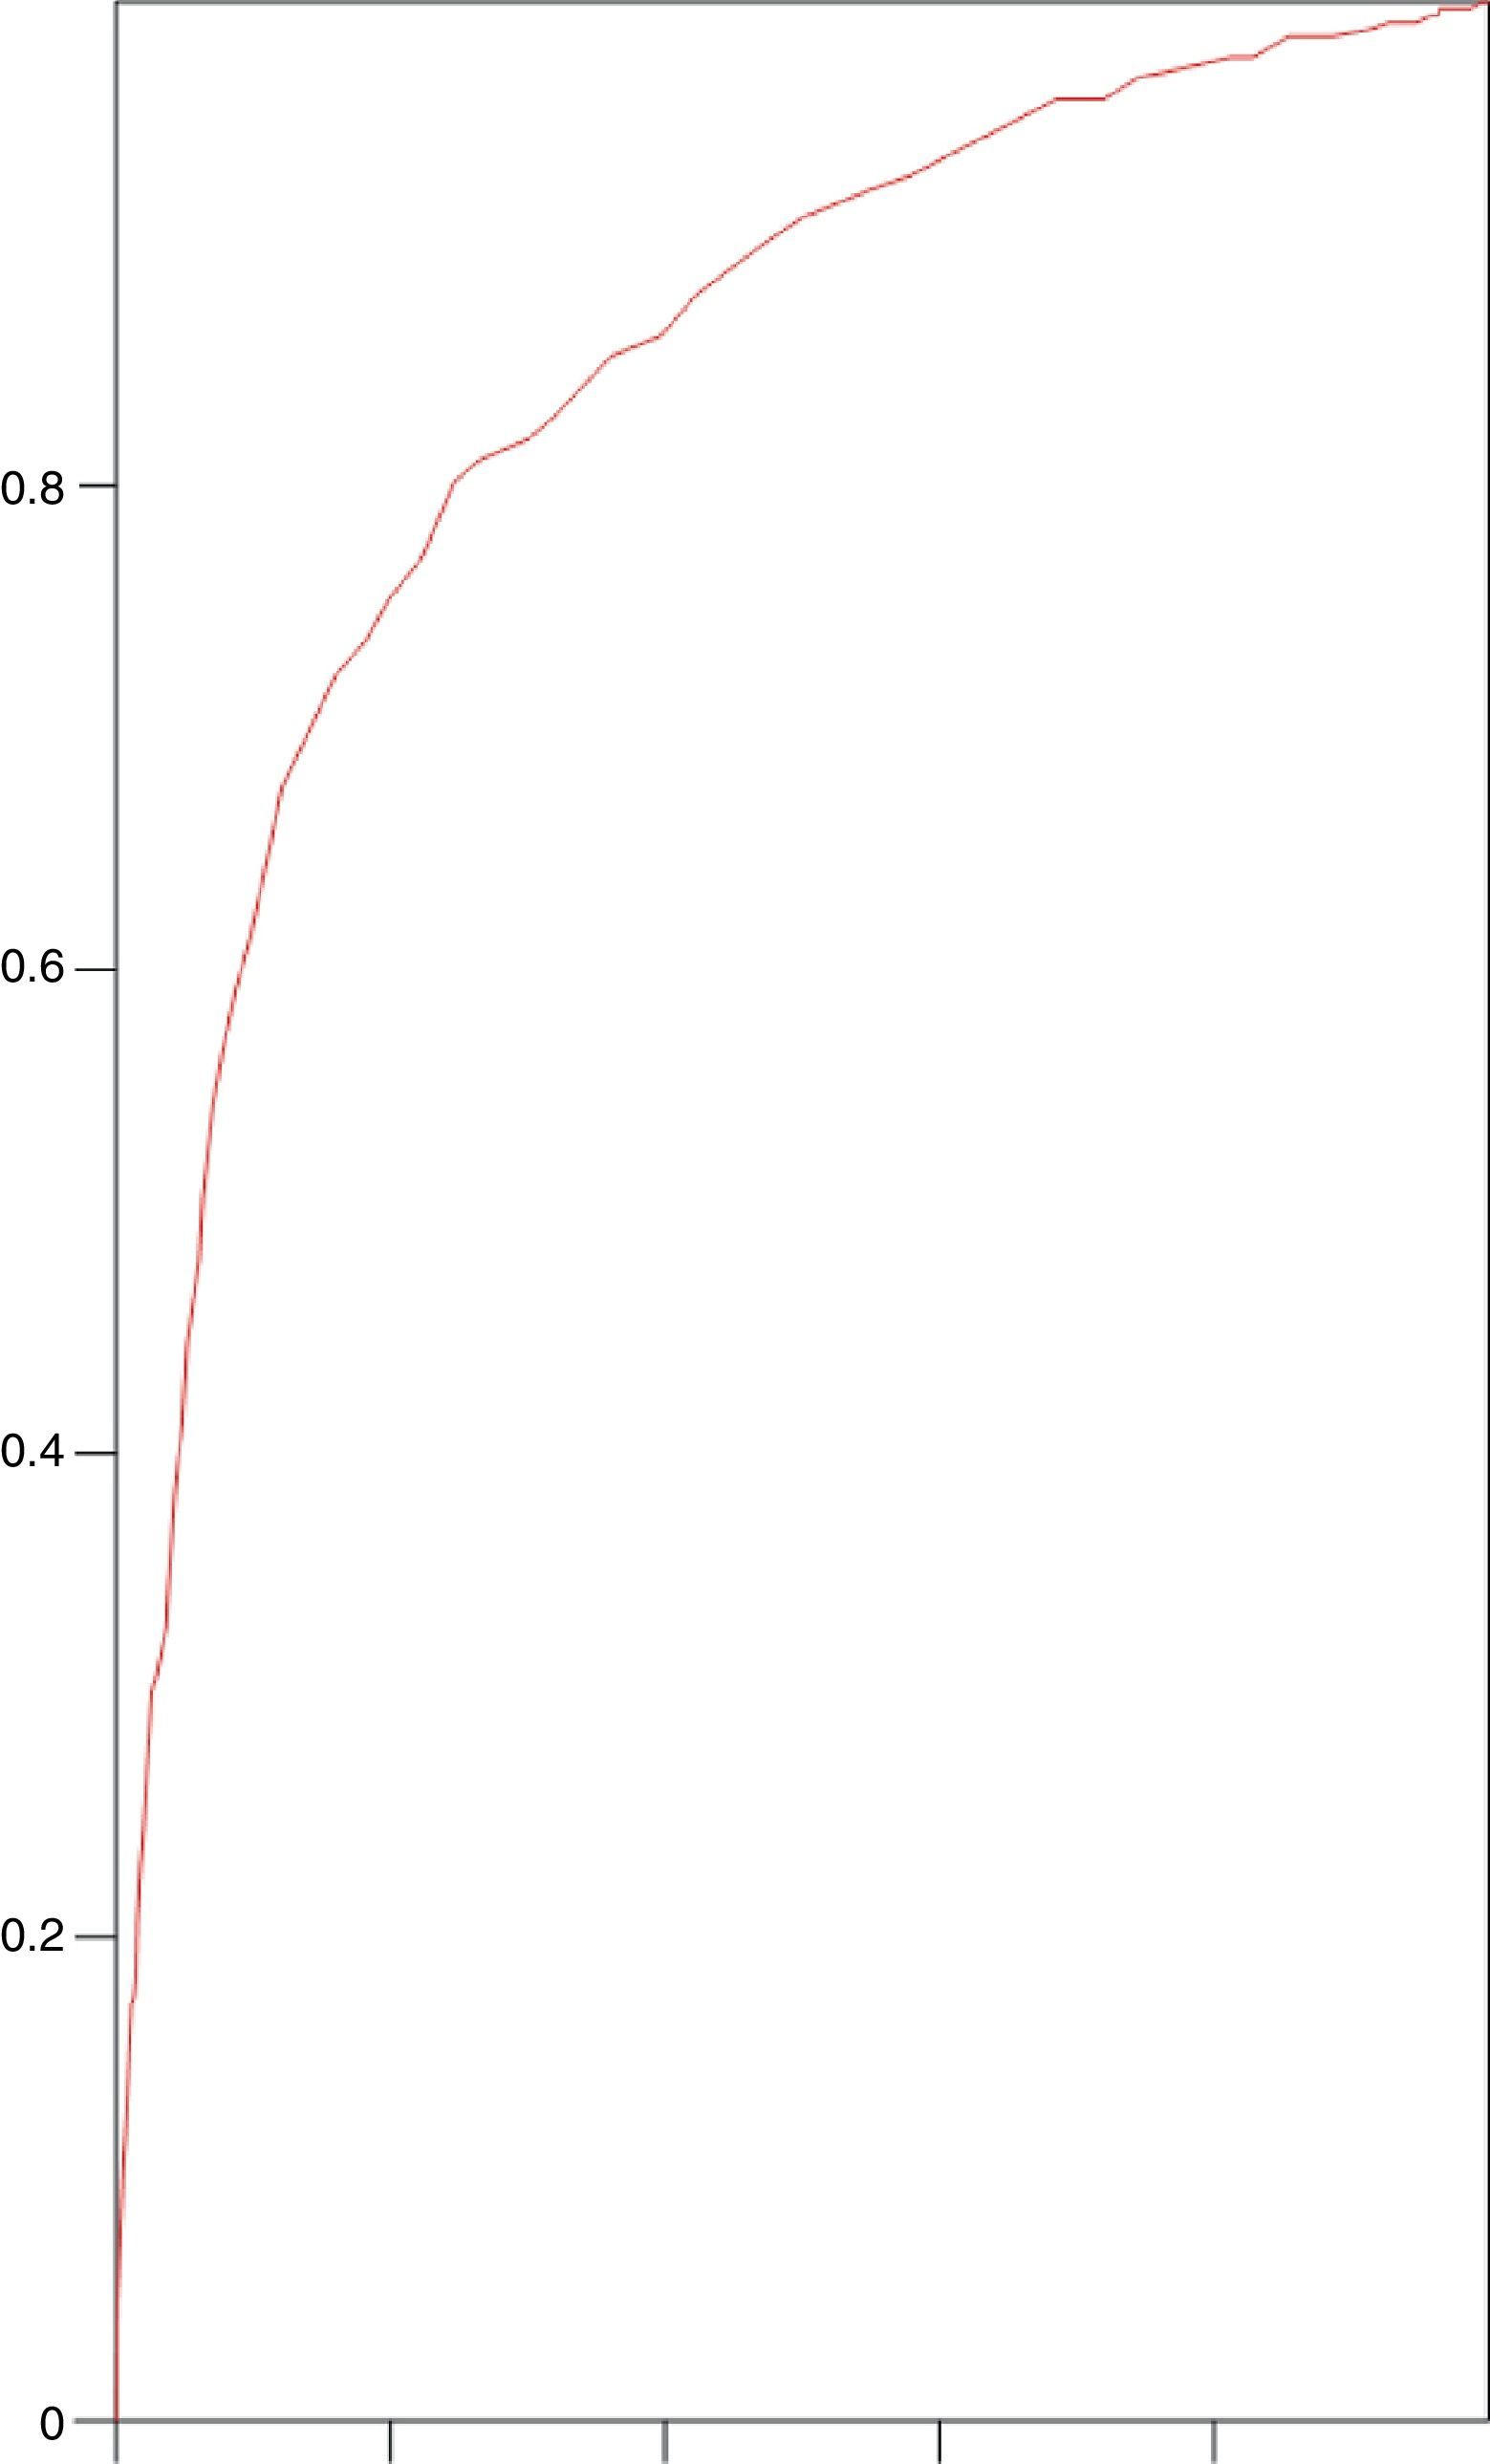
SAPS 3 discrimination with regard to hospital mortality, tested using the area under ROC curve, was 0.845 (0.821–0.869) (Fig. 1).
.")
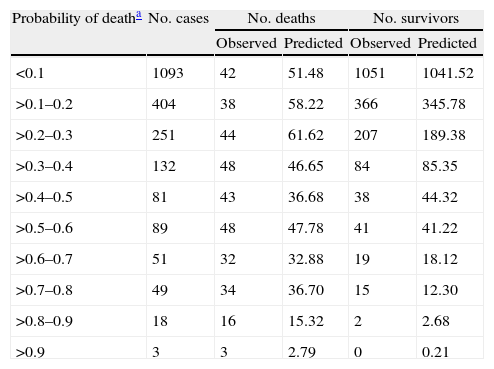
The ratio between observed and predicted mortality was analyzed with the Hosmer–Lemeshow test. In order to do that, the population was divided into 10 groups: the first of them was for patients with mortality probability less than 0.1, another one was between 0.1 and 0.2 and the rest were 0.2–0.3, etc. The Hosmer–Lemeshow test for our geographical area was H=31.71 (p<0.05) and for general equation H=20.05 (p<0.05). In Table 2 we show observed and predicted mortality by general and our geographical area equation.
Performance of the SAPS 3 score. Goodness of fit of general SAPS 3 model by Hosmer–Lemeshow χ2 statistic.
| Probability of deatha | No. cases | No. deaths | No. survivors | ||
| Observed | Predicted | Observed | Predicted | ||
| <0.1 | 1093 | 42 | 51.48 | 1051 | 1041.52 |
| >0.1–0.2 | 404 | 38 | 58.22 | 366 | 345.78 |
| >0.2–0.3 | 251 | 44 | 61.62 | 207 | 189.38 |
| >0.3–0.4 | 132 | 48 | 46.65 | 84 | 85.35 |
| >0.4–0.5 | 81 | 43 | 36.68 | 38 | 44.32 |
| >0.5–0.6 | 89 | 48 | 47.78 | 41 | 41.22 |
| >0.6–0.7 | 51 | 32 | 32.88 | 19 | 18.12 |
| >0.7–0.8 | 49 | 34 | 36.70 | 15 | 12.30 |
| >0.8–0.9 | 18 | 16 | 15.32 | 2 | 2.68 |
| >0.9 | 3 | 3 | 2.79 | 0 | 0.21 |
H, Hosmer–Lemeshow=20.05; DF 8, p<0.05.
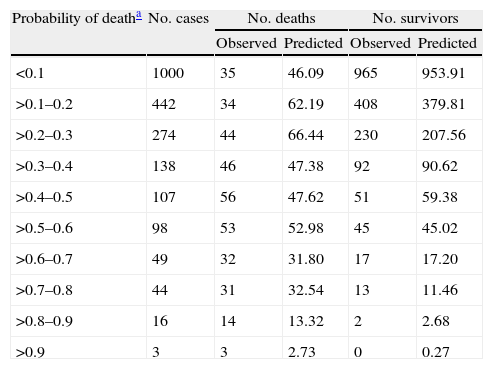
Performance of the SAPS 3 Score. Goodness of fit of South-western SAPS 3 model by Hosmer–Lemeshow χ2 statistic.
| Probability of deatha | No. cases | No. deaths | No. survivors | ||
| Observed | Predicted | Observed | Predicted | ||
| <0.1 | 1000 | 35 | 46.09 | 965 | 953.91 |
| >0.1–0.2 | 442 | 34 | 62.19 | 408 | 379.81 |
| >0.2–0.3 | 274 | 44 | 66.44 | 230 | 207.56 |
| >0.3–0.4 | 138 | 46 | 47.38 | 92 | 90.62 |
| >0.4–0.5 | 107 | 56 | 47.62 | 51 | 59.38 |
| >0.5–0.6 | 98 | 53 | 52.98 | 45 | 45.02 |
| >0.6–0.7 | 49 | 32 | 31.80 | 17 | 17.20 |
| >0.7–0.8 | 44 | 31 | 32.54 | 13 | 11.46 |
| >0.8–0.9 | 16 | 14 | 13.32 | 2 | 2.68 |
| >0.9 | 3 | 3 | 2.73 | 0 | 0.27 |
H, Hosmer–Lemeshow=31.71; DF 8, p<0.05.
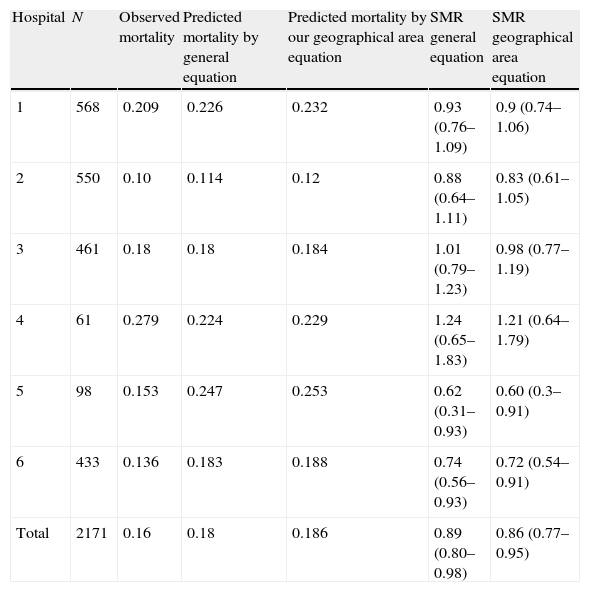
In Table 3 we show observed and predicted mortality in each hospital included in this study. In every hospital mortality observed was lower than predicted except in one hospital in which observed mortality was higher than predicted for both equations, although the sample of this hospital was small (N=61), and because of that, the results could be more affected than if the sample were higher by chance.
Observed and predicted mortality at different hospitals.
| Hospital | N | Observed mortality | Predicted mortality by general equation | Predicted mortality by our geographical area equation | SMR general equation | SMR geographical area equation |
| 1 | 568 | 0.209 | 0.226 | 0.232 | 0.93 (0.76–1.09) | 0.9 (0.74–1.06) |
| 2 | 550 | 0.10 | 0.114 | 0.12 | 0.88 (0.64–1.11) | 0.83 (0.61–1.05) |
| 3 | 461 | 0.18 | 0.18 | 0.184 | 1.01 (0.79–1.23) | 0.98 (0.77–1.19) |
| 4 | 61 | 0.279 | 0.224 | 0.229 | 1.24 (0.65–1.83) | 1.21 (0.64–1.79) |
| 5 | 98 | 0.153 | 0.247 | 0.253 | 0.62 (0.31–0.93) | 0.60 (0.3–0.91) |
| 6 | 433 | 0.136 | 0.183 | 0.188 | 0.74 (0.56–0.93) | 0.72 (0.54–0.91) |
| Total | 2171 | 0.16 | 0.18 | 0.186 | 0.89 (0.80–0.98) | 0.86 (0.77–0.95) |
Our study shows an overestimated score in the SAPS 3 prognosis system, with good discrimination power but overestimated mortality, although the differences between observed and predicted mortality are not very big; but these differences are enough to be statistically significant and also have practical relevance, as SMR less than 0.90 shows in both general and our geographical area equation (South western SAPS3 model).
When a prognosis index is created, it is necessary, as a first step, to carry out the first validation, which is performed by the same investigation group who created it.
In this process, patients that are used to compare whether predicted mortality is similar to the observed one are different to the ones used when the model was originally created. The same patients are used in a different way by dividing the sample into two groups: one for new model creation and another one for validation, or in other way, using another system as jackknife as well.
Although calibration carried out in the first validation process is studied in a different patient group to the one in which the model was created, there are important similarities between patients, such as belonging to the same cohort (they attend the same hospitals), similar admission diagnosis, age distribution, comorbidities, as well as the same data collection team. This team, with the same training, uses the same skills and makes the same mistakes when they do their work, which is database introduction and data transformation in death probability. That means that if the original validation process is made with a minimum of quality and rigor, the prognosis system will carry out the minimum validation requirement in most of the cases.
Subsequently it is necessary to make an external validation for different investigation groups, with different data-collecting techniques and with different investigators, dates, hospitals, case-mix, etc. with an information analysis by these new investigators. It is because it is usual and easy that this external validation fails whenever we have sufficient sample size.9
In the SAPS 3 case, several validation studies have been carried out. In an Austrian study in 2008, in a sample of 2060 patients, the original SAPS 3 score showed an overestimated hospital mortality. For this reason they adapted the model for that country.10
In the Italian external validation study in 2009, with a sample of 28,357 patients in 147 ICUs, the SAPS 3 score showed a bad calibration in a large sample of patients. General and Southern-Europe-Mediterranean equations overestimated hospital mortality, with SMR 0.73 and 0.71 respectively.11
In Brazil, the study carried out in 2010 in two units from two different third-level hospitals showed a correct discrimination power, and observed mortality was quite near to the predicted one (10.8% vs 10.3%), with SMR 1.04, although this is a relatively small study.12
In the study carried out in Korea in 2011, SAPS 3 predicted mortality was 42% compared to the observed one at 31%,13 although this was made in only one unit, with 633 patients. As we can see, differences are high and with real mortality less than expected, just like our current study and the Italian and Austrian ones.
In Spain, a multicentre study validation, such as we have done, had not been carried out before. One study in only one hospital,14 with 935 patients, has been carried out. It showed SMR 0.71 (0.56–0.90) with respect to general equation, and SMR 0.69 (0.55–0.87) with respect to specific geographical area equation. One study by Abizanda et al., which has been reported to congress but not published yet,19 showed SMR 0.85.
Our study shows an appropriate discrimination, using the area under ROC curve of 0.845 (0.821–0.869) (Fig. 1), which is high, although far from the excellent discrimination of figures higher than 0.90. It is important to note that to improve discrimination power it will be necessary to collect a bigger number of variables, and consequently the process will be more laborious. Additionally, it is worth remembering the advantage of data collection during the first hour of admission, as is done in the SAPS 3 system. In our country Abizanda et al. developed a prognostic system (EPEC) simple and easy to use20 but that did not meet the necessary requirements of calibration; and can be improved in the future. One way to develop prognosis systems could be to introduce automation of the analysis and collection process. In this context our group has recently published a study21 that analyses and proposes a way to automate information collection and its analysis using the common ICU prognosis monitoring system.
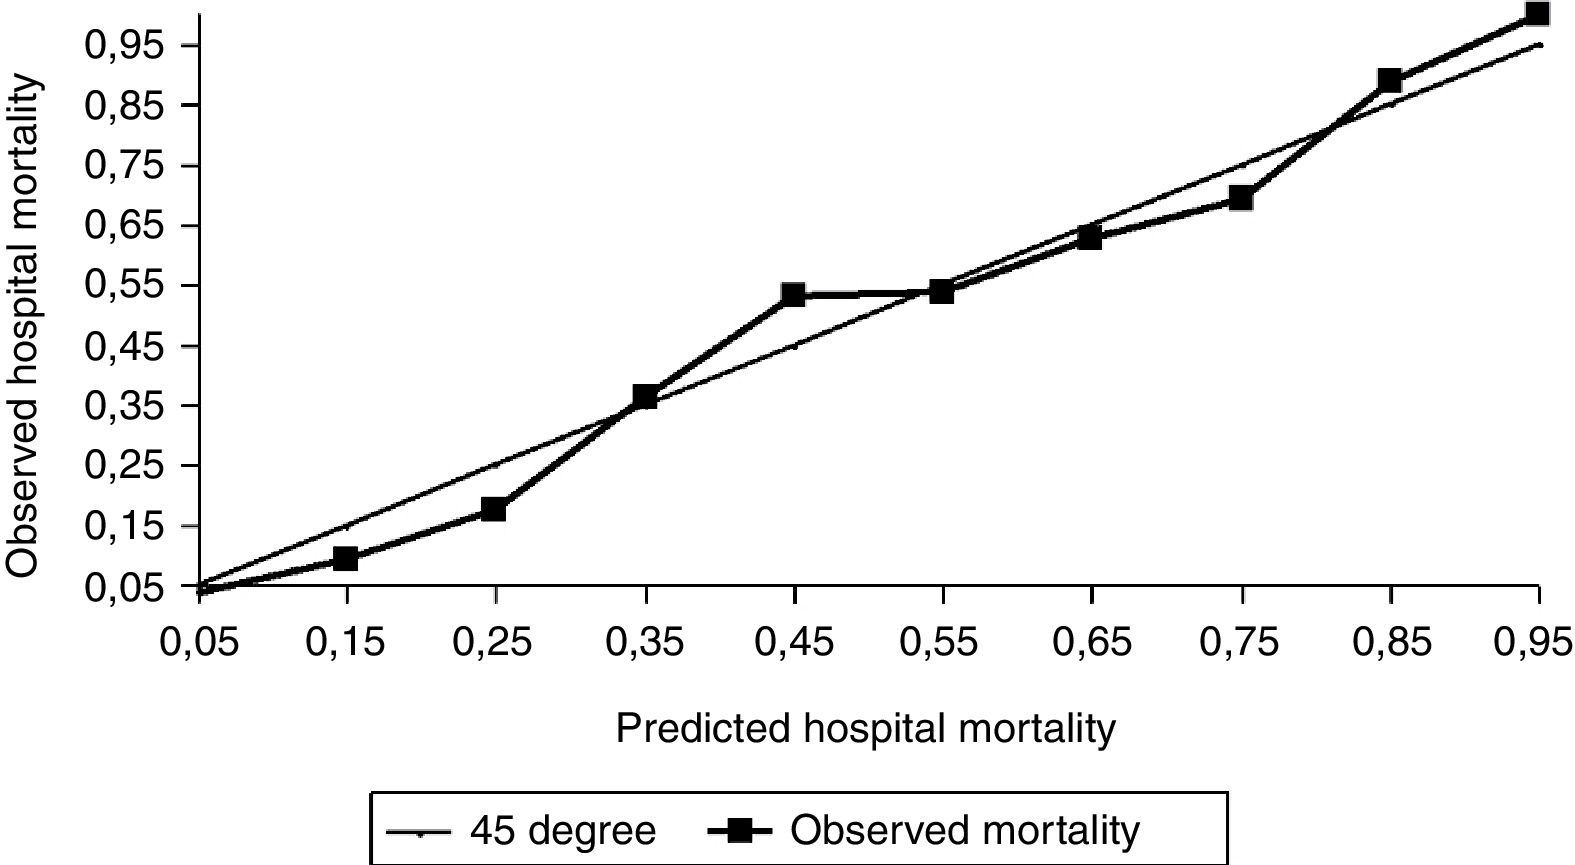
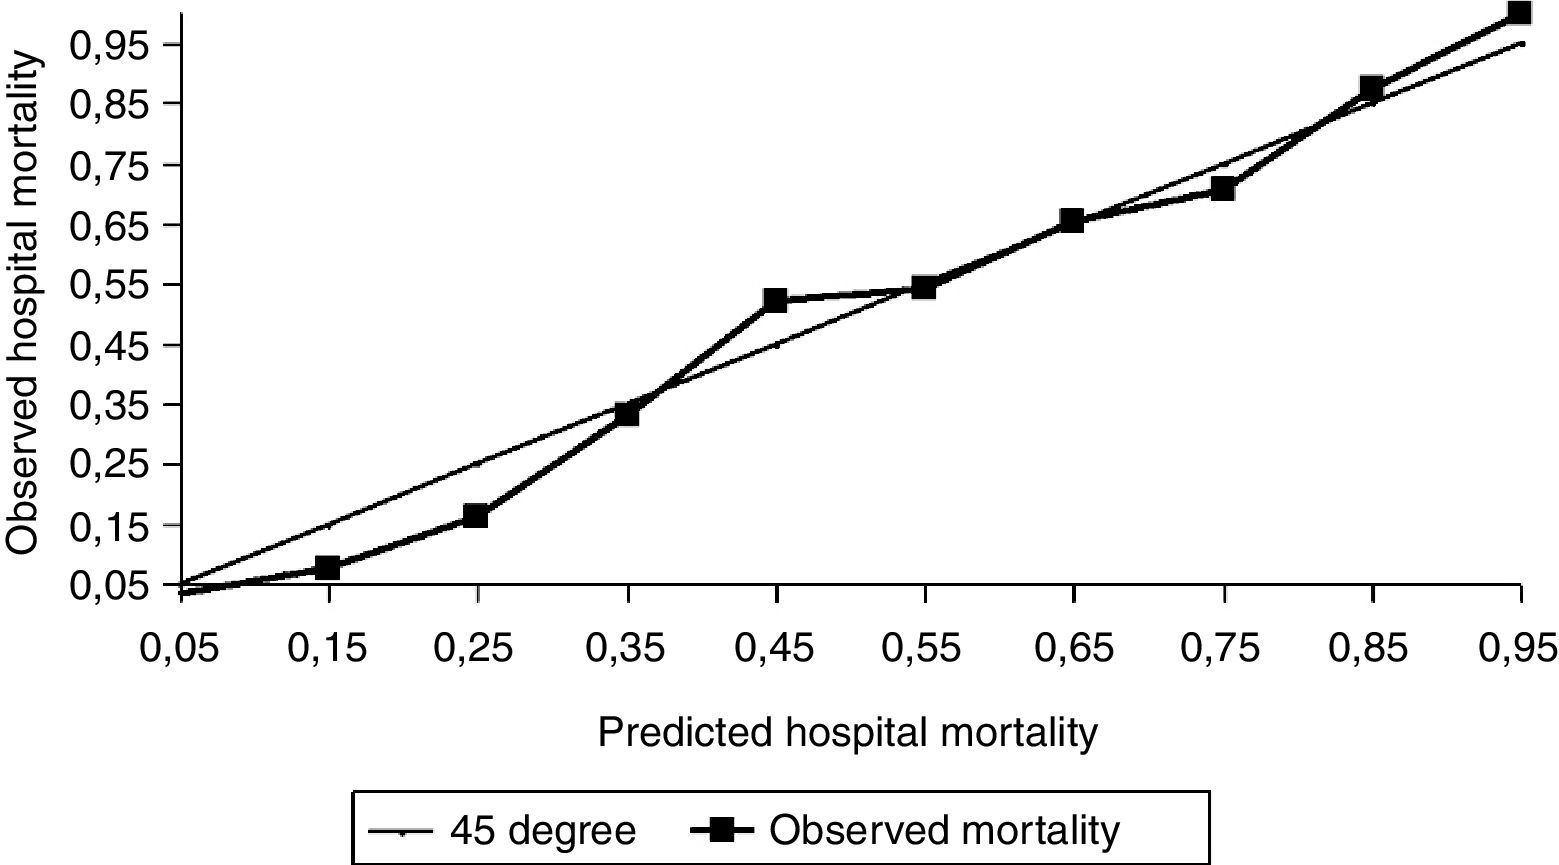
With respect to calibration, our study shows less mortality than expected, both for general (Fig. 2) and for our specific geographical area equation (Fig. 3), with SMR 0.86 and Hosmer–Lemeshow test H=31.71 (p<0.05) and, with respect to general equation, SMR 0.89 and Hosmer–Lemeshow test H=20.05 (p<0.05). We can see that differences are not excessive but statistically significant enough and also have relevance for quality control with SMR less than 0.90, with higher differences for our geographical area equation. Although the agreement between observed and predicted was not enough in SAPS 3 model, we also think that this does not invalidate the SAPS 3 model, because these differences between predicted and observed mortality are not excessive and discrimination is high and similar to observed values in the original study.

Predicted versus Observed hospital mortality for General SAPS-3 model. Comparison of expected and observed hospital mortality in our environment for General SAPS 3 model. The graphic shows the calibration of the customized SAPS 3 admission score in Spain for general equation. Lines mean SAPS 3 predicted mortality per deciles. Squares mean SAPS 3 observed mortality per deciles.

Predicted versus Observed hospital mortality for South western SAPS-3 model. Comparison of expected and observed hospital mortality in our environment for South European SAPS 3 model. The graphic shows the calibration of the customized SAPS 3 admission score in Spain for South European equation. Lines mean SAPS 3 predicted mortality per decile. Squares mean SAPS 3 observed mortality per decile.
These data are similar to those seen by other authors in our environment in a group of patients in only one unit,14 or presented in congress but not published, such as the Castellón group,19 with SMR 0.85. In the SEMICYUC congress, the Fuenlabrada group also presented a communication about this issue in which conclusions were similar.22
In conclusion, in our country, just as we have seen in other countries,10–13 the SAPS 3 score overestimates mortality.
An important aspect in our study is that Spanish ICU mortality is smaller than other hospitals mortality included in the multicenter SAPS 3 study, in spite of the fact that patients had similar severity of illness.
That means that we are offering to ICU patients a good attention in our country, good results with respect to mortality, and as I said before, smaller mortality with respect to patients included in the study, which was developed in Europe and other countries. This multicenter study was used to develop SAPS 3 system and included more than 16,000 patients. It is necessary to carry out quality controls similar to those that we carried out in our study because of the amount of patients admitted in UCI and the high number of death. We cannot rule out that the less mortality would be because a bad calibration in ischemic cardiopathy patients. This kind of patients represents an important number in our study (22.6%) in which mortality is 8.18% and predicted mortality by general equation was 12.45%. We want to study these patients in a future study.
There are several limitations to our study. One of these is the sample size, because the number of patients included in the study is not as big as other studies that include more than 20,000 patients.11 But our study includes enough patients to reach statistically significant conclusions, and with a similar number of patients to that used in other works for this kind of study.10
Another limitation is not including a higher number of hospitals, to make the study more representative. Nevertheless, our study includes not very high but enough to obtain general conclusion, with different size of hospitals, kind of patients (surgical, cardiac, transplant, etc.) and geographical areas. Furthermore, the fact that the results are quite similar in all the hospitals and the same that in congress report from other hospitals not included in this study, contributes to support our study and to trust in our results, allowing us to generalized it to the rest of the country.
Another limitation could be that the protocol used has been different in two hospitals and the data collection has been carried out in different times. We are sure that this factor does not affect to study quality because the investigation equipment, with a high previous qualification, has carefully carried out and checking the requirement, as for example: all consecutively patients admitted to ICU, intermittent checking in previously collected data. The database allows us to check strange values, to check online SAPS 3 calculator, etc. Besides the fact that our results were similar in the different hospitals included, allows us to trust in our study quality.
Our study, in a large group of patients, specifically in four hospitals (Málaga, Motril, Granada and Cabra), has used one protocol that allows us to calculate another index: APACHE II-III-IV, SAPS II, SOFA, mortality after discharge from ICU, etc. All these will allow us in the future, and in a comparative way, to analyze SAPS 3 with another prognosis index, to observe whether diagnosis classification about APACHE and SOFA could be complementary to it and also improve it.
Once we have seen that the SAPS prognosis index does not work correctly in Spain, a second step would be to adapt it to our environment, although we consider that it is preferable to do this in a higher sample of patients. This objective will have to be carried through by our or another different group.
Conflict of interestThe authors declare no conflicts of interest.