
To develop a mortality prediction score (Spanish Influenza Score [SIS]) for patients with severe influenza considering only variables at ICU admission, and compare its performance against the APACHE II, SOFA and Random Forest (RF).
DesignSub-analysis from the GETGAG / SEMICYUC database
ScopeIntensive Care Medicine.
PatientsPatients admitted to 184 Spanish ICUs (2009–2018) with influenza infection.
InterventionNone.
VariablesDemographic data, severity of illness, times from symptoms onset until hospital admission (Gap-H), hospital to ICU (Gap-ICU) or hospital to diagnosis (Gap-Dg), antiviral vaccination, number of quadrants infiltrated, acute renal failure, invasive or noninvasive ventilation, shock and comorbidities. The study variable cut-off points and importance were obtained automatically. Logistic regression analysis with cross-validation was performed to develop the SIS score using the output coefficients. Accuracy and discrimination (AUC-ROC) were applied to evaluate SIS, APACHE, SOFA and RF. All analyses were performed using R (CRAN-R Project).
ResultsA total of 3959 patients were included. The mean age was 55 years (range 43−67), 60% were men, APACHE II 16 (12−21) and SOFA 5 (4−8), with ICU mortality 21.3%. Mechanical ventilation, shock, APACHE II, SOFA, acute renal failure and Gap-ICU were included in the SIS. The latter was generated according to the ORs obtained by logistic regression, and showed an accuracy of 83% with an AUC-ROC of 82%, which is superior to APACHE (AUC-ROC 67%) and SOFA (AUC-ROC 71%), but similar to RF (AUC-ROC 82%).
ConclusionsThe SIS score is easy to apply and shows adequate capacity to stratify the risk of ICU mortality. However, further studies are needed to validate the tool prospectively.
Desarrollar una escala predictiva de mortalidad (SIS) en pacientes con gripe grave considerando las variables al ingreso a UCI y comparar su eficacia respecto del APACHE II, SOFA y un modelo Random Forrest (RF).
DiseñoSub-análisis de base de datos GETGAG/SEMICYUC.
ÁmbitoMedicina Intensiva.
IntervencionesNinguna.
PacientesPacientes ingresados en 184 UCI españolas (2009–2018) con infección por gripe.
VariablesDemográficas, nivel de gravedad, tiempo síntomas hasta el ingreso al hospital (Gap-H) o desde hospital a UCI (Gap-UCI), o al diagnóstico (Gap-Dg), vacunación, cuadrantes infiltrados, insuficiencia renal, ventilación no-invasiva o invasiva (VM), shock, y comorbilidades. Los puntos de corte y la importancia de las variables se obtuvieron de forma automática. Se realizó validación cruzada y regresión logística a partir de la cual se desarrolló la puntuación SIS. Se aplicó la puntuación y se calculó la exactitud y la discriminación (AUC-ROC) así como para APACHE, SOFA y RF. El análisis se realizó mediante CRAN-R Project.
ResultadosSe incluyeron 3959 pacientes, edad 55 (43−67) años, 60% hombres, APACHE II de 16(12−21) y SOFA 5(4−8) puntos y una mortalidad del 21,3%. VM, shock, APACHEII, SOFA, insuficiencia renal aguda y Gap-UCI fueron incluidas en SIS. A partir de los OR se construyó el SIS que demostró una exactitud del 83% y un AUC-ROC del 82%, superior al APACHE (AUCROC 67%) y SOFA (AUC-ROC 71%) y similar al RF (AUC-ROC 82%).
ConclusionesLa escala SIS de fácil aplicación, ha demostrado con adecuada capacidad de estratificación del riesgo de mortalidad en la UCI. Sin embargo, estos resultados deberán ser validados prospectivamente.
The mortality rate among critical patients with influenza virus infection admitted to the Intensive Care Unit (ICU) remains unacceptably high: a little over 20% in the general population1–3 and over 30% in patients requiring invasive mechanical ventilation (IMV).4 The scales used to predict severity in patients with community-acquired pneumonia appear to underestimate severity among patients with influenza infection.5 The adoption of early outcome predictors may be useful for clinical decision making when caring for these critical patients. Different studies have attempted to establish predictors related to mortality in this particular patient population in the ICU.5–8 However, most of them have serious limitations due to the small number of patients involved,6,7 the methodology used to obtain the predictor5,8 or application limited to special subpopulations.9,10 Developing mortality predictors in critical patients is a complex task, due to their heterogeneity and differences in systemic response to one same disease process. The new software technologies allow us to automatically generate predictive models through the use of “machine learning” strategies.11–15 However, most of these models are difficult to understand for physicians, who show very little acceptance of clinical decisions based on cryptographic algorithms (black boxes) with generally no clear application in clinical practice.16 It is therefore important to develop predictive models that take advantage of these new analytical technologies, but which are also comprehensible and early and practical to apply, with the aim of helping the clinical decision making process.
The present study makes use of machine learning techniques to develop a comprehensible and applicable severity score (the Spanish Influenza Score [SIS]), allowing us to categorize or stratify mortality risk on an early basis in influenza patients upon admission to the ICU.
Primary objectiveTo make use of machine learning techniques to develop a severity stratification score (SIS) and evaluate its capacity to predict mortality in the ICU among patients with severe influenza infection.
Secondary objectiveTo evaluate the mortality predicting capacity of a nonlinear model such as random forest (RF) analysis in patients with severe influenza in the ICU versus the SIS.
Material and methodsType of studyA subanalysis was made of the GETGAG/SEMICYUC database comprising patients admitted to 184 Spanish ICUs in the period between 2009–2018, with confirmed influenza infection.17
Data sourceThe dataset corresponding to the training group (TG) and validation group (VG) used to develop the present model belong to the database created in 2009 on occasion of the influenza pandemic by the SEMICYUC in order to facilitate improved knowledge of the disease and generate reference information for the optimization of clinical practice. The study was approved by the Clinical Research Ethics Committee of Hospital Universitario Joan XXIII (Tarragona, Spain) (IRB#11809), and was ratified by the local Committees of each of the participating centers. Patient identity was kept anonymous, and the obtainment of informed consent was not considered necessary due to the observational and epidemiological nature of the study, as has been published elsewhere.2,3,17–21
We included all the consecutive patients admitted to the 184 participating Spanish ICU with respiratory signs suggestive of viral infection, with or without fever and with microbiological confirmation of influenza A or B based on RT-PCR testing.2,3,17–21
The data were obtained by the treating physicians from the physical examination, review of the clinical history, radiological findings, and laboratory test results. The treating physicians of each center were in charge of requesting all the tests and of conducting all the patient care-related procedures. We only excluded patients under 15 years of age and those with missing data referred to the objectives of the study.
The database contains information referred to demographic parameters, level of severity, time from symptoms onset to hospital admission (Gap-H) or from hospital admission to admission to the ICU (Gap-ICU) or to diagnosis (Gap-Dg), influenza vaccination, infiltrated quadrants on the chest X-rays, renal failure, noninvasive ventilation (NIV) or invasive mechanical ventilation (IMV), failure of NIV, shock upon admission and comorbidities, as well as laboratory test results. The assessment of disease severity was based on the APACHE II score, while organ dysfunction was assessed using the SOFA score.
Definitions: The definitions of the variables are found in Appendix B Table 1 of annex B and in previous publications.2,3,17–21
Processing of missing valuesWe excluded those patients with missing data referred to categorical variables, and imputed the missing values of the numerical variables through the missForest/CRAN-R function—a nonparametric imputation of the missing value using random trees.22,23
Selection of cut-off points of the variablesIn order to perform the analysis, the continuous numerical variables were converted into categorical values. The cut-off points for the numerical variables were obtained automatically through the LOESS smoothing function (stats/CRAN R package). The LOESS regression24 allows us to trace curves of a time series using a least squares regression method. Once the curves are obtained, the cut-off points are defined through those variations in the curve that are associated to an increase in mortality rate of at least 10%.
Selection of the variables to be included in the modelSelection of the variables was made automatically by obtaining the “information value” (IV) for each of them, using the InformationValue-CRAN R statistical package. The IV is a search tool for selecting a predictive variable through binary logistic regression analysis.25,26 The total IV is the sum of the IV of the category and a measure of the predictive capacity of a variable, and allows us to discriminate between “cases or events” and “controls or non-events”. For the IV we considered a cut-off point ≥ 0.20 for entering the variables in the model, as suggested by Siddiqi.26
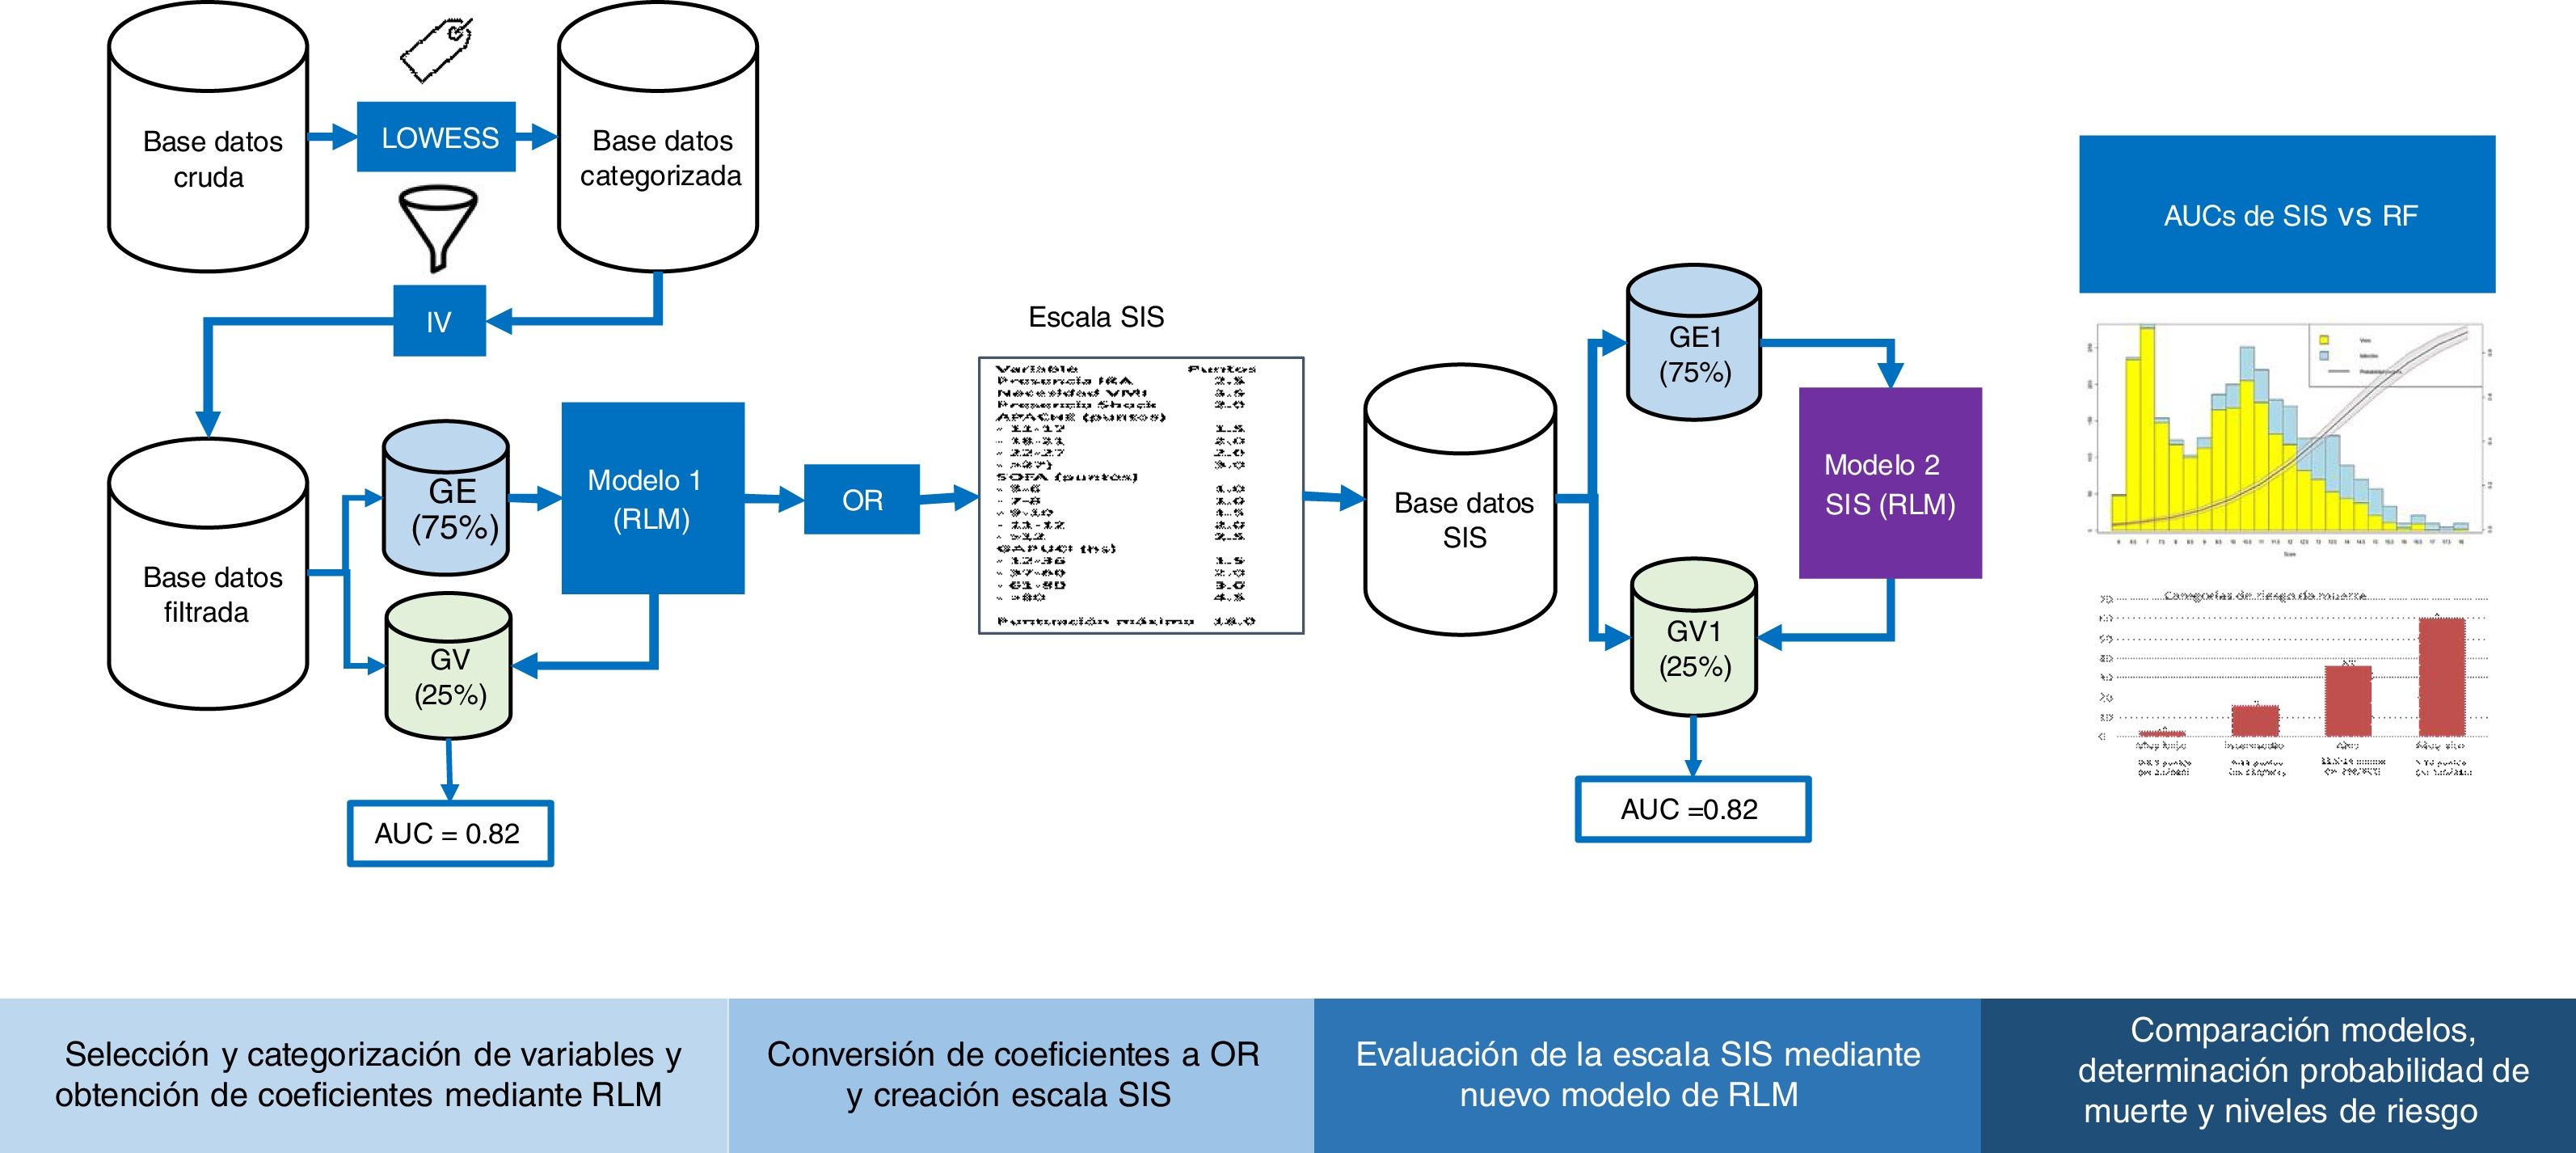
Cross-validationFig. 1 shows the study analysis flowchart. The original patient cohort was divided into two groups: TG (75% of the patients) to create the model and VG (remaining 25%) to assess the precision and error of the model. The division was made on a random basis, but keeping one same proportion in the response variable “y” (mortality).
. LOWEES: LOWEES regression analysis; IV: information value; TG: training group; VG: validation group; AUC: area under the ROC curve; MLR: multiple logistic regression; OR: odds ratio; RF: random forest.")
Flowchart of the development and validation of the Spanish Influenza Score (SIS). LOWEES: LOWEES regression analysis; IV: information value; TG: training group; VG: validation group; AUC: area under the ROC curve; MLR: multiple logistic regression; OR: odds ratio; RF: random forest.
Following categorization of all the variables, we obtained a “value” for each level by means of a binomial logistic regression (LR) model with the “glm” function of R. Based on the coefficients, we calculated the odds ratios (ORs), which were rounded to determine the points assigned to each variable of the SIS. The score was applied to each of the patients, and the sum yielded the final score of the SIS. This procedure was carried out for TG and VG, and we evaluated the predictive capacity of the model based on its accuracy and discrimination through the area under the receiver operating characteristic curve (AUC ROC).
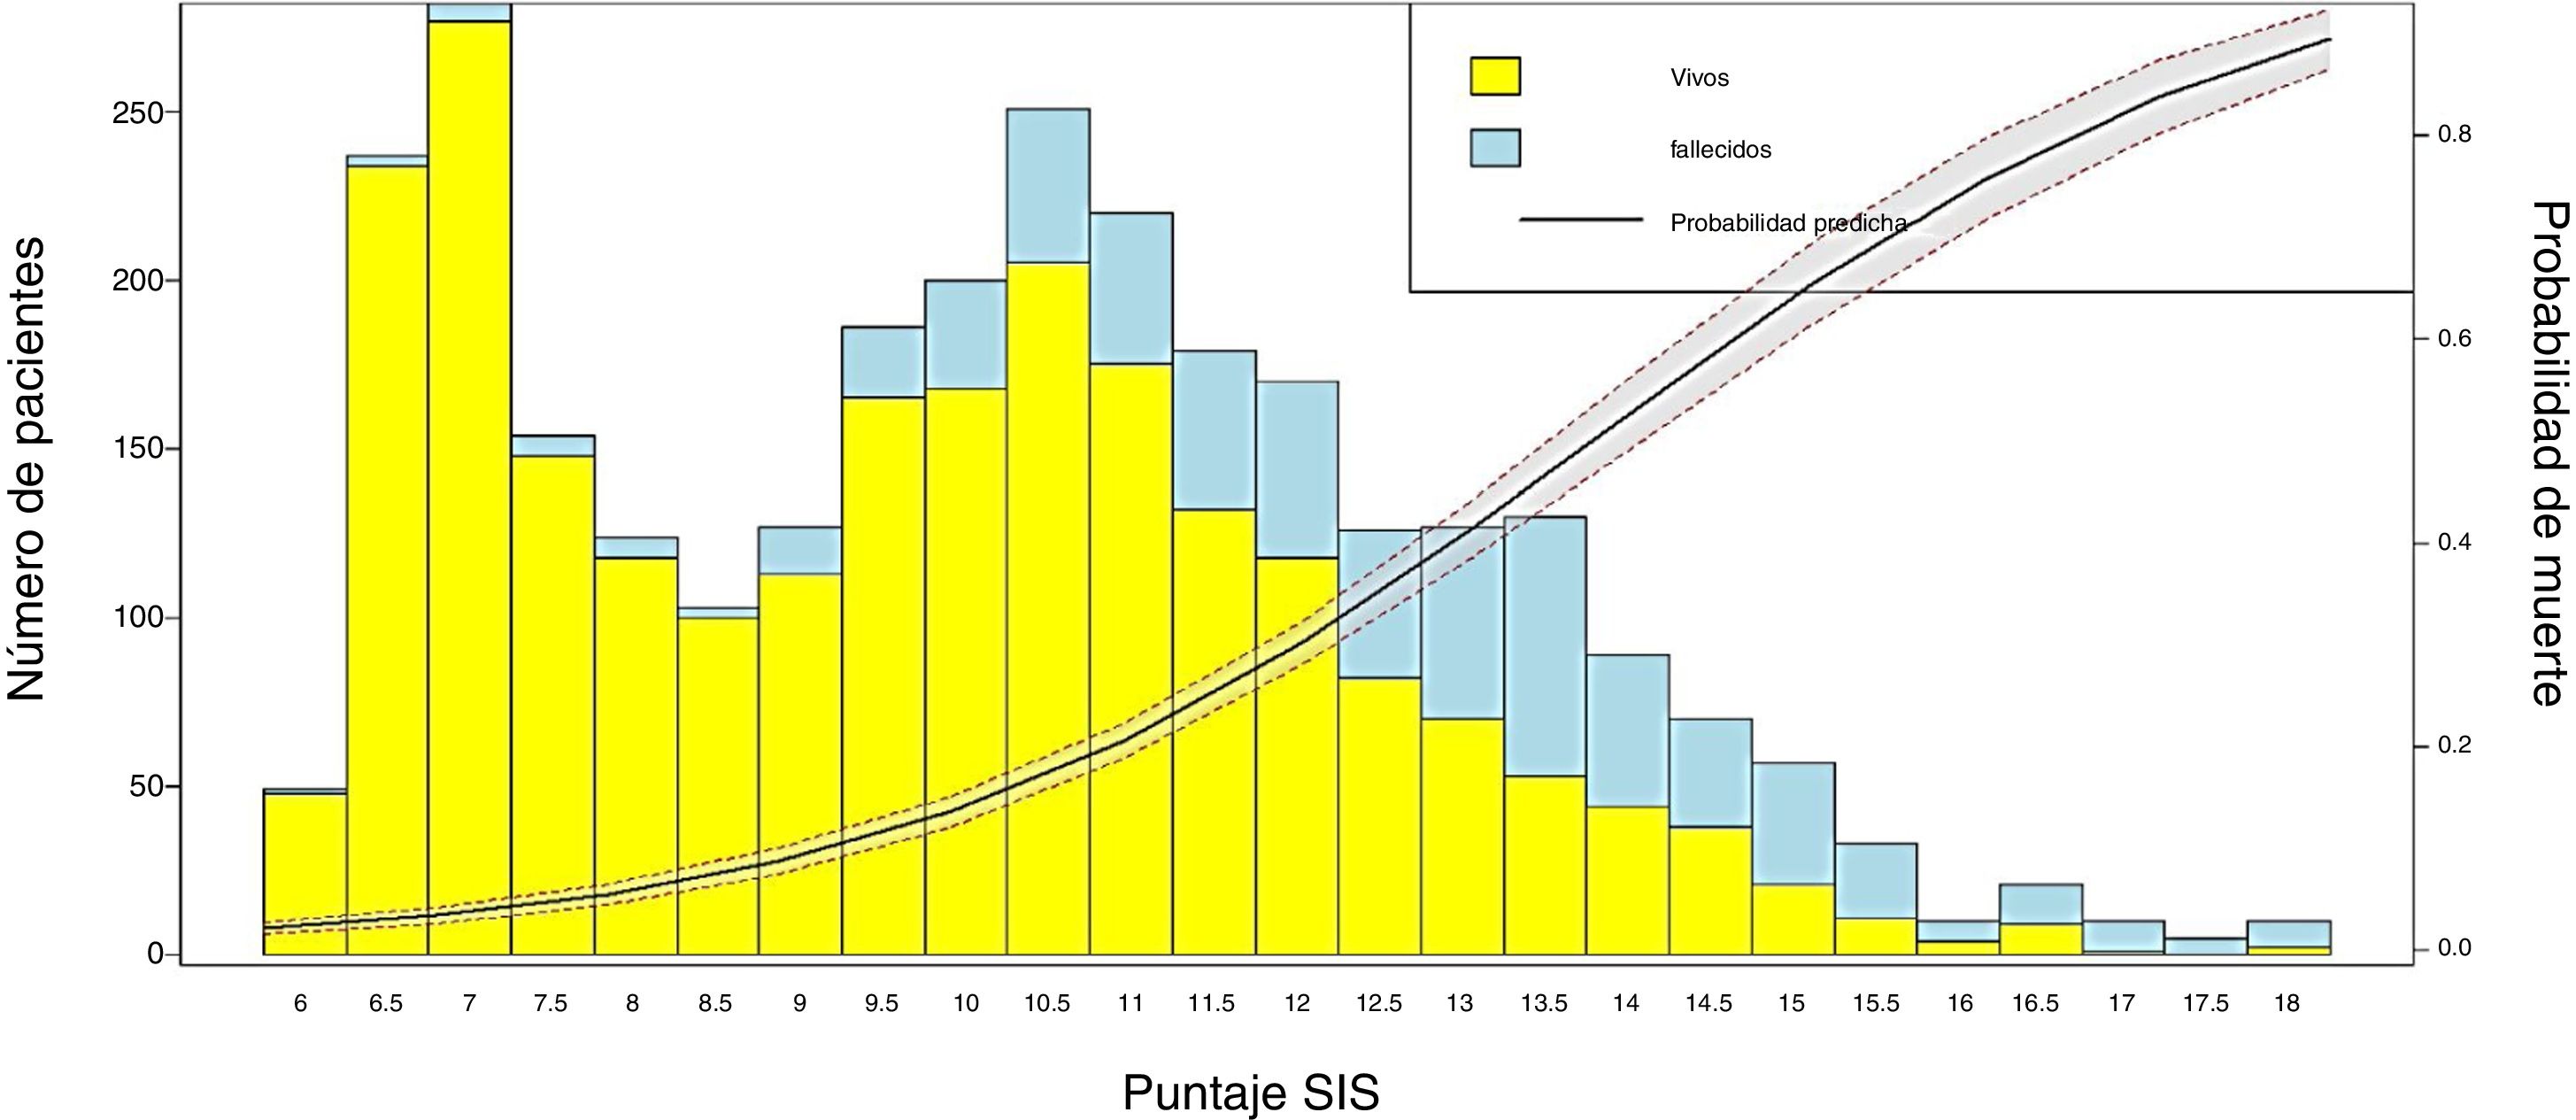
Conversion of the score into probability of death and visualization of the resultsIn order to obtain the probability of death from the SIS score, LR was applied to estimate the coefficients of the scale and the probability of the event (mortality), using the individual values of each patient. Then, a bar plot was generated to represent the survivors and non-survivors according to the SIS score obtained, together with a probability curve of the event “in-ICU mortality”.
Validation of the SISThe adequate performance of the SIS was evaluated based on the accuracy and discrimination of the model, as well as the sensitivity (Se), specificity (Sp), positive predictive value (PPV) and negative predictive value (NPV). In addition, we assessed the calibration between predicted risk and observed risk using the Sommers index.27 Lastly, we defined four risk categories stratified according to mortality.
Random forest (RF) nonlinear model of mortalityThe RF technique was used to establish a model of mortality with the ICU admission variables. This technique is widely used among the family of machine learning algorithms, and is based on the generation of multiple decision forests that are constructed by means of an algorithm that introduces a random variables selection model to reduce the correlation between them.28,29 The importance of each variable is defined as the influence it has on being removed from the model with respect to the prediction. The final model was assessed based on the accuracy, discrimination, Se, Sp, PPV and NPV values.
Reporting of the resultsThe values obtained were reported as the median and interquartile range (IQR) (25%–75%), or as numbers and percentages, as applicable. The results of the multivariate analysis were expressed as the OR and corresponding 95% confidence interval (95%CI). The statistical analyses were made using the R version 3.6.0 package.
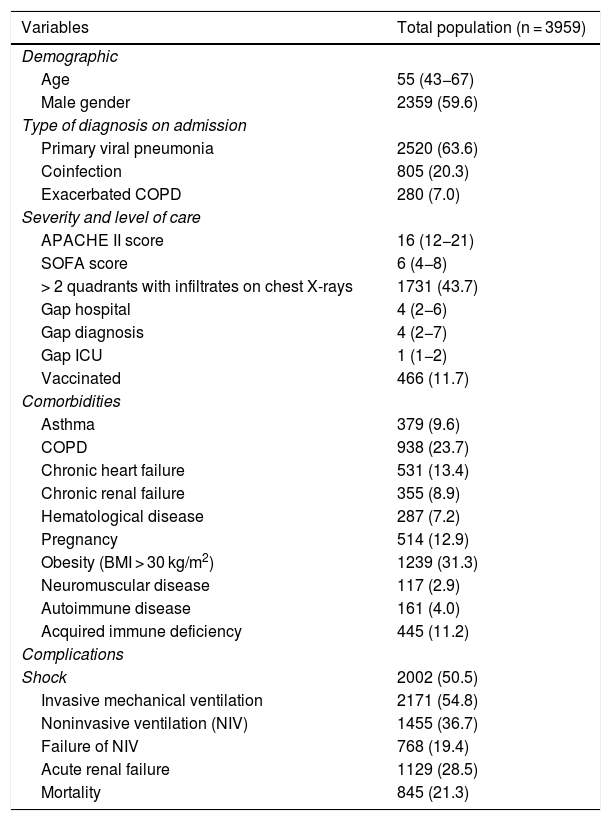
ResultsGeneral populationThe study cohort consisted of 3959 patients admitted to 184 Spanish ICUs. The general characteristics of the patients are reported in Table 1.
General characteristics of the 3959 patients included in the present analysis. The variables are those considered upon admission to the ICU and for the first 24 h of stay. The results are expressed as the number of patients (n) and percentage (%) or median and interquartile range (IQR), as applicable. COPD: chronic obstructive pulmonary disease; APACHE II: Acute Physiology And Chronic Health Evaluation; SOFA: Sequential Organ Failure Assessment; Gap hospital: time from symptoms onset to admission to hospital; Gap diagnosis: time from admission to hospital to diagnosis; Gap ICU: time from admission to hospital to admission to the ICU; vaccinated: patients that received influenza vaccination; BMI: body mass index).
| Variables | Total population (n = 3959) |
|---|---|
| Demographic | |
| Age | 55 (43−67) |
| Male gender | 2359 (59.6) |
| Type of diagnosis on admission | |
| Primary viral pneumonia | 2520 (63.6) |
| Coinfection | 805 (20.3) |
| Exacerbated COPD | 280 (7.0) |
| Severity and level of care | |
| APACHE II score | 16 (12−21) |
| SOFA score | 6 (4−8) |
| > 2 quadrants with infiltrates on chest X-rays | 1731 (43.7) |
| Gap hospital | 4 (2−6) |
| Gap diagnosis | 4 (2−7) |
| Gap ICU | 1 (1−2) |
| Vaccinated | 466 (11.7) |
| Comorbidities | |
| Asthma | 379 (9.6) |
| COPD | 938 (23.7) |
| Chronic heart failure | 531 (13.4) |
| Chronic renal failure | 355 (8.9) |
| Hematological disease | 287 (7.2) |
| Pregnancy | 514 (12.9) |
| Obesity (BMI > 30 kg/m2) | 1239 (31.3) |
| Neuromuscular disease | 117 (2.9) |
| Autoimmune disease | 161 (4.0) |
| Acquired immune deficiency | 445 (11.2) |
| Complications | |
| Shock | 2002 (50.5) |
| Invasive mechanical ventilation | 2171 (54.8) |
| Noninvasive ventilation (NIV) | 1455 (36.7) |
| Failure of NIV | 768 (19.4) |
| Acute renal failure | 1129 (28.5) |
| Mortality | 845 (21.3) |
Through LOESS regression we traced the curves for the continuous variables such as the APACHE II score, SOFA score and Gap-ICU (Appendix B Fig. 1 in annex B). Based on the 10% change in the probability of death in each curve, the following cut-off points were established: a) for the APACHE II, 4 cut-off points: 1) 11−17; 2) 18−21; 3) 22−27; and 4) > 27 points; b) for the SOFA, 5 cut-off points: 1) 3−6; 2) 7−8; 3) 9−10; 4) 11−12; and 5) > 12 points; and c) for Gap-ICU, the days were transformed into hours, with the definition of 4 cut-off points: 1) 12−36; 2) 37−60; 3) 61−80; and 4) > 80 h. These cut-off points were entered in the regression model.
Selection of the variables based on the information value (IV)The predictive capacity of each variable with respect to in-ICU mortality was evaluated using linear regression to obtain IV. The only variables that reached the cut-off points defined for inclusion in the model were invasive mechanical ventilation (IMV), the SOFA score, APACHE II score, shock, acute renal failure (ARF) and Gap-ICU were the (Appendix B in annex B).
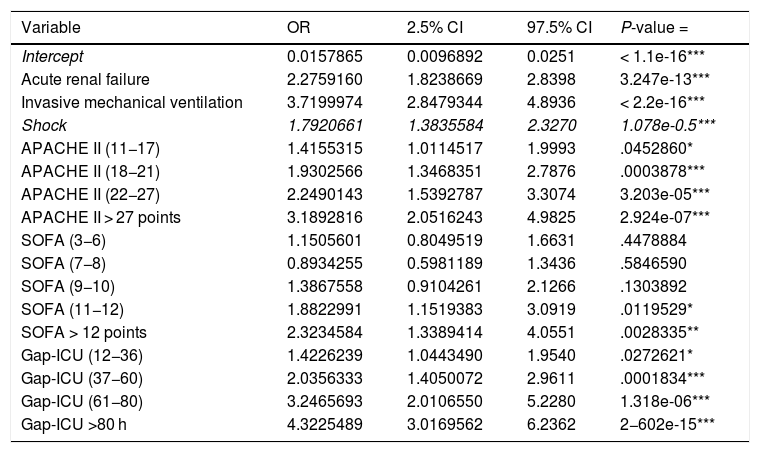
Regression modelThe study population was divided into a training group (TG; n = 2970) and a validation group (VG; n = 989). The characteristics of each group are shown in Appendix B Table 3 of annex B. The cut-off points established for APACHE II, SOFA and Gap-ICU and the categorical variables IMV, shock and ARF were entered in the regression model. Table 2 shows the variables independently associated to mortality. Following application of the model in the VG, the recorded accuracy was 82%, with AUC ROC 82%.
Variables independently associated to in-ICU mortality (multivariate analysis) (APACHE II: Acute Physiology And Chronic Health Evaluation; SOFA: Sequential Organ Failure Assessment; Gap ICU: time from admission to hospital to admission to the ICU).
| Variable | OR | 2.5% CI | 97.5% CI | P-value = |
|---|---|---|---|---|
| Intercept | 0.0157865 | 0.0096892 | 0.0251 | < 1.1e-16*** |
| Acute renal failure | 2.2759160 | 1.8238669 | 2.8398 | 3.247e-13*** |
| Invasive mechanical ventilation | 3.7199974 | 2.8479344 | 4.8936 | < 2.2e-16*** |
| Shock | 1.7920661 | 1.3835584 | 2.3270 | 1.078e-0.5*** |
| APACHE II (11−17) | 1.4155315 | 1.0114517 | 1.9993 | .0452860* |
| APACHE II (18−21) | 1.9302566 | 1.3468351 | 2.7876 | .0003878*** |
| APACHE II (22−27) | 2.2490143 | 1.5392787 | 3.3074 | 3.203e-05*** |
| APACHE II > 27 points | 3.1892816 | 2.0516243 | 4.9825 | 2.924e-07*** |
| SOFA (3−6) | 1.1505601 | 0.8049519 | 1.6631 | .4478884 |
| SOFA (7−8) | 0.8934255 | 0.5981189 | 1.3436 | .5846590 |
| SOFA (9−10) | 1.3867558 | 0.9104261 | 2.1266 | .1303892 |
| SOFA (11−12) | 1.8822991 | 1.1519383 | 3.0919 | .0119529* |
| SOFA > 12 points | 2.3234584 | 1.3389414 | 4.0551 | .0028335** |
| Gap-ICU (12−36) | 1.4226239 | 1.0443490 | 1.9540 | .0272621* |
| Gap-ICU (37−60) | 2.0356333 | 1.4050072 | 2.9611 | .0001834*** |
| Gap-ICU (61−80) | 3.2465693 | 2.0106550 | 5.2280 | 1.318e-06*** |
| Gap-ICU >80 h | 4.3225489 | 3.0169562 | 6.2362 | 2−602e-15*** |
Statistical significance *** 0.001; ** 0.01; *0.05.
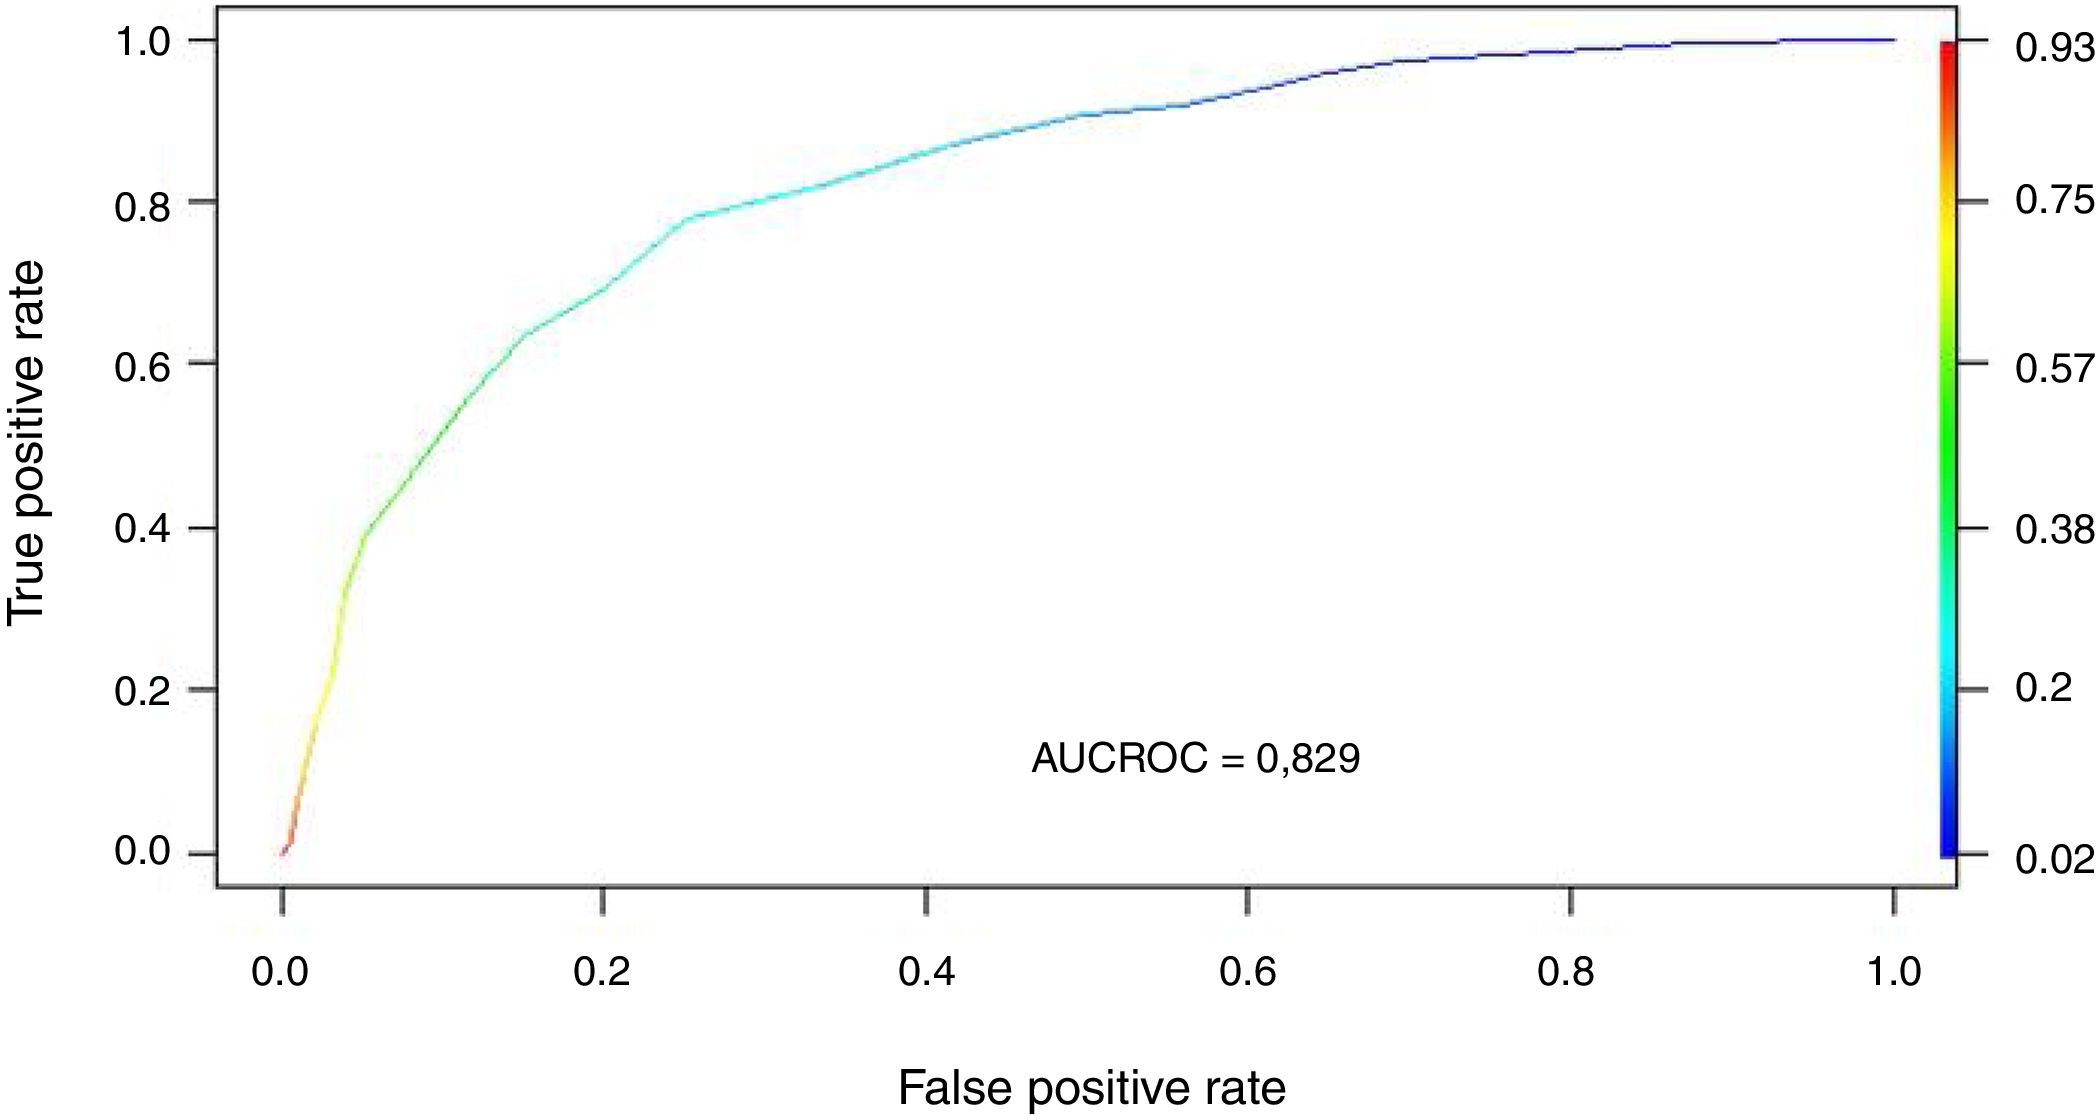
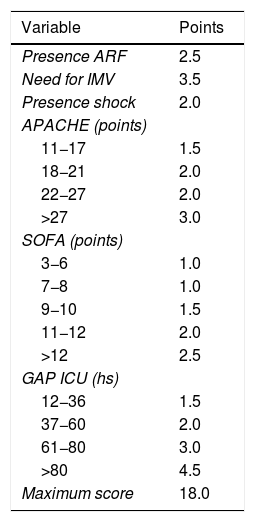
We transformed the OR of each variable into points of the score by rounding to the nearest 0.5, and a score was generated with a maximum of 18 points (Table 3). The score was applied to each of the patients in the GD, and predicted mortality with respect to the score for each patient was obtained (Fig. 2). We then applied the score to the VG and obtained an accuracy of 83% (95%CI: 0.79−0.84) with AUC ROC 82% (Fig. 3), evidencing good discrimination of the SIS. Appendix B Fig. 2 of annex B shows calibration of the model to be good, with a Sommers index of 0.65, while Table 4 reports the predictive values of the SIS.
Spanish Influenza Score (SIS) derived from the ORs of the logistic regression analysis (ARF: acute renal failure; IMV: invasive mechanical ventilation; APACHE II: Acute Physiology and Chronic Health Evaluation; SOFA: Sequential Organ Failure Assessment; Gap ICU: time from admission to hospital to admission to the ICU).
| Variable | Points |
|---|---|
| Presence ARF | 2.5 |
| Need for IMV | 3.5 |
| Presence shock | 2.0 |
| APACHE (points) | |
| 11−17 | 1.5 |
| 18−21 | 2.0 |
| 22−27 | 2.0 |
| >27 | 3.0 |
| SOFA (points) | |
| 3−6 | 1.0 |
| 7−8 | 1.0 |
| 9−10 | 1.5 |
| 11−12 | 2.0 |
| >12 | 2.5 |
| GAP ICU (hs) | |
| 12−36 | 1.5 |
| 37−60 | 2.0 |
| 61−80 | 3.0 |
| >80 | 4.5 |
| Maximum score | 18.0 |
.")
 for SIS obtained in the validation group.")
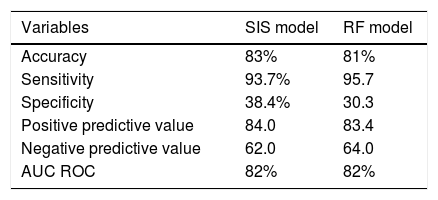
Predictive values of the Spanish Influenza Score (SIS) and of the random forest (RF) model for the 3959 patients included in the study.
| Variables | SIS model | RF model |
|---|---|---|
| Accuracy | 83% | 81% |
| Sensitivity | 93.7% | 95.7 |
| Specificity | 38.4% | 30.3 |
| Positive predictive value | 84.0 | 83.4 |
| Negative predictive value | 62.0 | 64.0 |
| AUC ROC | 82% | 82% |
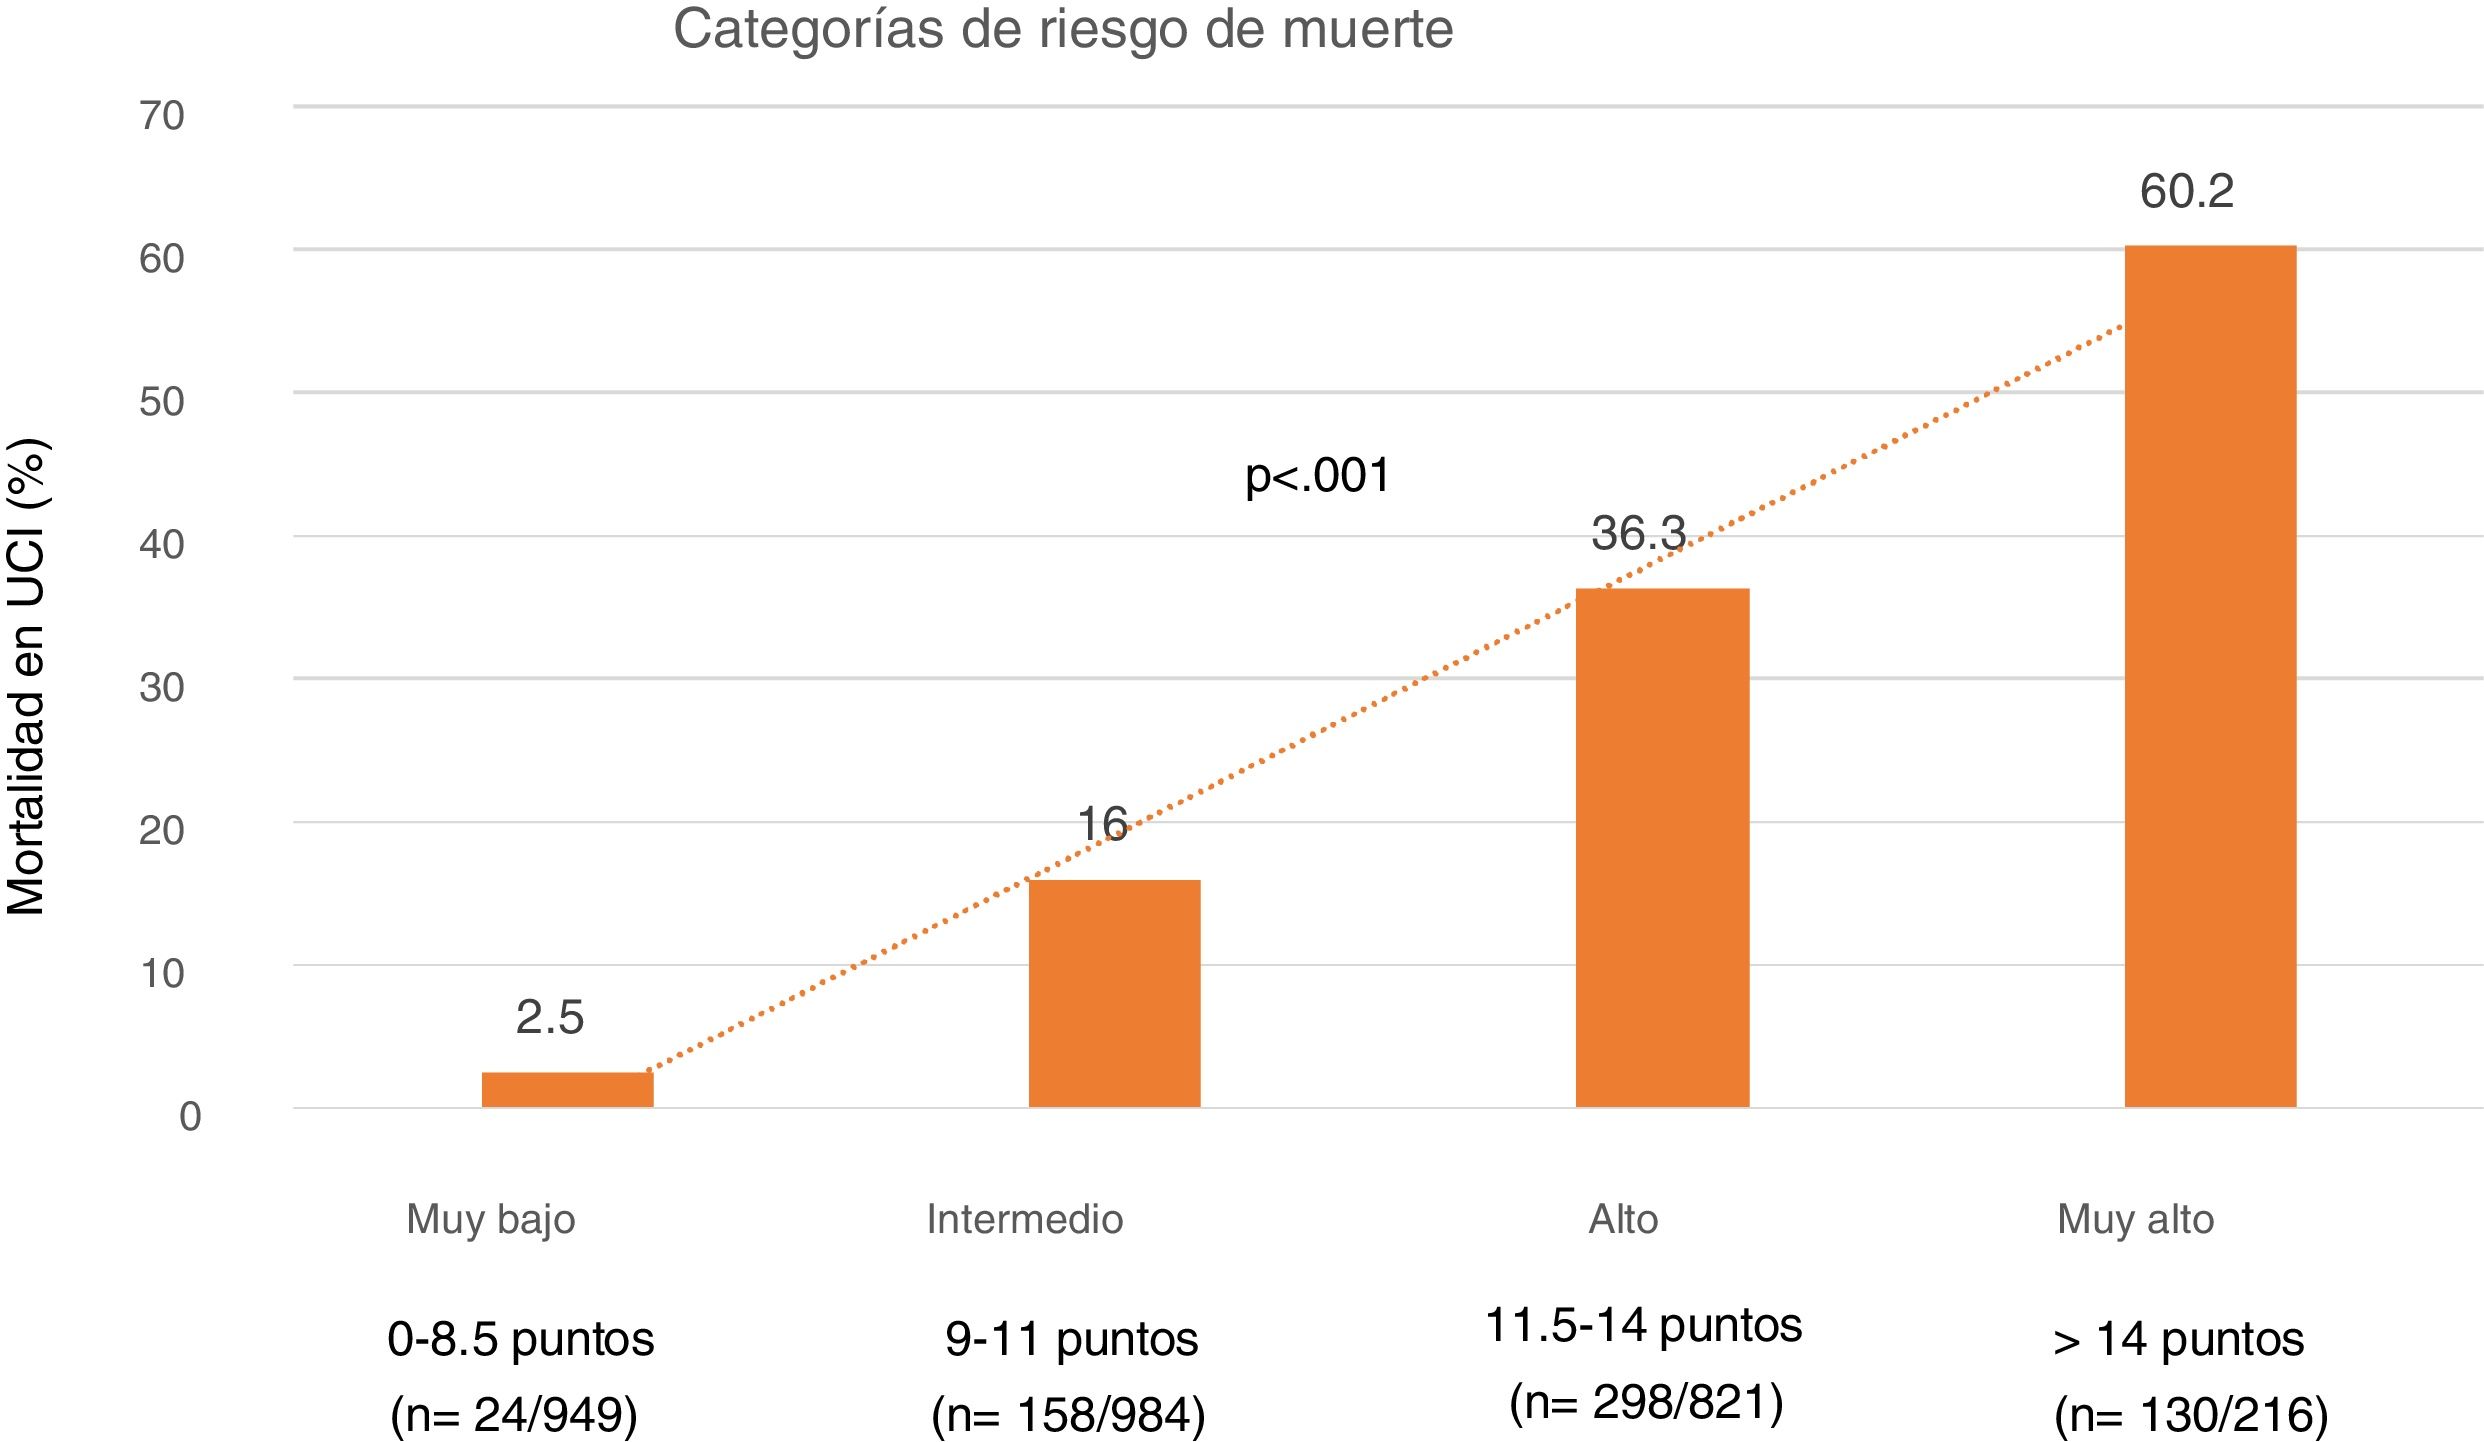
Lastly, we established four SIS risk levels stratified according to mortality: 1) Very low risk: SIS 0–8.5 points with a mortality of 5%; 2) Moderate risk: SIS 9–11 points with a mortality of 16%; 3) High risk: SIS 11.5–14 points with a mortality of 36.3%; and 4) Very high risk: SIS > 14 points with a mortality of 60% (Fig. 4).
Random forest mortality prediction model (nonlinear model). Mortality is seen to increases significantly with increasing risk.")
The application of RF showed IMV, the SOFA score, acute renal failure, days to ICU admission, APACHE II score, failure of NIV and immunodeficiency to be the variables with the strongest predictive impact (Appendix B Fig. 3 of annex B). The assessment of prediction evidenced an accuracy of 81% with AUC ROC 82%. Table 4 shows the rest of the predictive parameters and their comparison with regard to the SIS.
DiscussionThe application of severity scores at individual or population level is crucial, since they allow us to classify and stratify patients into risk categories based on one of the most important outcomes that can be measured in the ICU, namely mortality. Based on this concept, the main objective of our study was to develop an “early” mortality predictive model using machine learning (ML) methods and to compare its performance against a random forest nonlinear model.
The main finding of the study was that the SIS exhibited adequate accuracy in the cross-validation (83%), with very good discrimination (AUC ROC 82%)—these predictive parameters being similar to those of the random forest model. These data suggest that the SIS is a valid model that allows adequate stratification of mortality risk in patients with influenza upon admission to the ICU.
The studies carried out to date have only determined variables associated to mortality through classical multivariate analyses5,6,19,30 or by developing scores with a limited number of patients,7,31–33 or considering only special patient populations.9,10 In a study involving 709 patients, Oh et al.7 developed a score with four variables, assigning a point to each of them (altered mental state, hypoxia, bilateral infiltrates, and age > 65 years). Although this was a multicenter study and the discrimination of the score was very good (AUC ROC 0.83), only 75 patients (10.5%) were seriously ill. In addition, the authors conducted no cross-validation. Adeniji et al.8 applied the STSS (Simple Triage Scoring System)31 and the SOFA score in the emergency department to predict the need for mechanical ventilation (MV) and admission to the ICU in patients with influenza. The discrimination was greater for the STSS (AUC ROC 0.88) versus the SOFA (AUC ROC 0.77) for admission to the ICU and also as regards the need for MV (AUC ROC 0.91 versus AUC ROC 0.87 for STSS and SOFA, respectively). However, the sample size was very small (n = 62); as a result, the statistical power of the study was poor, and the results were difficult to interpret. Chung et al.9 developed a severity score in 409 elderly patients (Geriatric Influenza Death [GID]). The multivariate analysis identified only 5 variables (coma, C-reactive protein elevation, cancer, coronary disease and the presence of band cells in the leukocyte formula) to be independently associated to mortality. Although the GID showed very good discrimination (AUC ROC 86%), in contrast to our own score it considered variables corresponding to the entire time course (evolution), was limited to elderly patients, and no cross-validation was made.
Studies based on routine statistical methods such as logistic regression (linear model) are widely accepted by physicians for determining or investigating factors related to mortality or the development of some adverse event. However, these indicators do not perform adequately for individual predictions,15 and do not allow us to predict the clinical course of a patient. New forms of prediction based on algorithms developed through machine learning (ML) techniques, such as neural networks or decision trees, have been implemented to obtain predictive models in different scenarios in intensive care.34–37 However, although these models offer very good predictive performance, they are usually incomprehensible for clinicians and scantly applicable not only because of their complexity but also due to a lack of inclusion in the model of variables of great clinical interest—such as antimicrobial treatment—in a complex model that compares clinical constructs versus automated models in the treatment of sepsis,38 thereby invalidating clinical application of the model. Recently, Hu et al.39 published a study on the application of two ML techniques (gradient boosting XGBoost and RF) compared against an LR model for predicting 30-day mortality in a cohort of 336 patients with influenza. The authors concluded that the XGBoost (AUC ROC = 0.84) and RF models (AUC ROC = 0.80) afforded better discrimination than LR (AUC ROC = 0.70). These results do not coincide with those of our own study, which also used an RF model. This discrepancy could be explained by the small number of patients in relation to the large number of variables considered in the study of Hu et al.,39 which has an unfavorable impact upon regression models but not on models developed using decision trees. In addition, the mentioned authors used variables corresponding to the first 7 days; the instrument therefore cannot be regarded as an early predictor. Lastly, the discrimination of the best model (XGBoost), which is scantly interpretable for clinicians, was only slightly better than that of the SIS.
The scores routinely used in the ICU to measure general severity (APACHE II) or the degree of organ dysfunction (SOFA) have limitations when it comes to categorizing patients with severe influenza.7,8,39–41 The SIS therefore could be a simple alternative for application in this group of patients, since its performance has been shown to be similar to that of a random forest (RF) based predictive model. Although RF is one of the best ML methods for providing answers to complex problems, particularly those related to nonlinear associations,29 the main disadvantage of the technique is that it is difficult to understand for clinicians, since it does not allow us to know how the associations (black boxes) are made to generate the final model. In line with our own results but in the general ICU patient population, Kim et al.15 investigated the mortality predictive capacity of three different models developed using ML techniques (neural networks, support vector machine and decision trees) versus a traditional logistic regression model developed with the variables of the APACHE III score.42 The study included over 38,000 admissions and only considered the data compiled in the first 24 h of admission to the ICU. The authors found the predictive capacity to be similar for all four models, with logistic regression being identified as a valid method for predicting mortality versus more complex models.
Our study combines ML techniques with logistic regression, which affords robustness and objectivity. In addition, the fact that this was a multicenter study with a large number of patients allows generalization of the results, since the 184 participating ICUs represent approximately 50% of all the ICUs in Spain. However, our study has limitations that need to be mentioned in order to allow adequate interpretation of the data. Firstly, the SIS only uses information obtained upon admission to the ICU. Consequently, data related to the changes that occur during the patient clinical course are not considered. Although this may affect the predictive capacity, our primary objective was to develop an “early” risk score at the time of admission to the ICU and not over time – with the demonstration of adequate discrimination capacity. Secondly, the model has been developed considering only patients admitted to Spanish ICUs. As a result, it might not perform adequately in other countries or in other populations outside the ICU setting. Thirdly, although cross-validation was carried out, performance of the SIS has not been assessed on a prospective basis. Accordingly, our project contemplates a national and international prospective validation of the SIS to assess the real clinical impact and acceptance of the score on the part of intensivists.
In conclusion, the SIS developed from the data of over 3900 critical patients demonstrates predictive performance similar to that observed for a random forest model. Considering that the SIS is simple to apply and allows early mortality risk stratification, its use could have a favorable impact upon the evolution of patients admitted to the ICU due to severe influenza. However, these considerations need to be confirmed through prospective validation of the SIS.
Authorship / collaborationsStudy conception and design: AR (Alejandro Rodriguez), ED (Emili Díaz) ST (Sandra Trefler), JMC (Judth Marín-Corral), LC (Laura Claverias), IML (Ignacio Martín Loeches), MB (María Bodi), JSV (Jordi Sole-Violan), JG (Jose garnacho-Montero), MRB (Manuel Ruiz Botella), JG (Josep Gomez), JA (Jordi Albiol), EM (Eduard Mallol).
Data acquisition and analysis: AR (Alejandro Rodriguez), ST (Sandra Trefler), LC (Laura Claverias), GM (Gerard Moreno), MS (Manuel Samper), MB (María Bodi), JMC (Judith Marín-Corral), MRB (Manuel Ruiz-Botella), JG (Josep Gomez), JA (Jordi Albiol), EM (Eduard Mallol) AB (Ariel Barrios).
Data interpretation: AR (Alejandro Rodriguez), MS (Manuel Samper), GM (Gerard Moreno), MB (María Bodi), ED (Emili Díaz) ST (Sandra Trefler), JMC (Judith Marín-Corral), LC (Laura Claverias), JCY (Juan Carlos Yebenes), AT (Antoni Torres) PR (Paula Ramirez) JGM (Jose Garnacho-Montero), RF (Ricard Ferrer), IML (Ignacio Martín Loeches, LFR (Luis Felipe Reyes) JG (Juan Guardiola), MIR (Marcos I Restrepo), JSV (Jordi Sole-Violan).
Important intellectual contribution to the content: AT (Antoni Torres), JGM (Jose Garnacho-Montero), PR (Paula Ramirez), JCY (Juan Carlos Yebenes), RF (Ricard Ferrer), LFR (Luis Felipe Reyes), JG (Juan Guardiola), MIR(Marcos I Restrepo).
Drafting of the manuscript: AR (Alejandro Rodriguez), MS (Manuel Samper), GM (Gerard Moreno).
Critical review of the content: MB (María Bodi), ED (Emili Díaz), JMC (Judith Marín-Corral), LC (Laura Claverias), JCY (Juan Carlos Yebenes), JSV (Jordi Sole-Violan), AT (Antoni Torres), PR (Paula Ramirez), JGM (Jose Garnacho-Montero), RF (Ricard Ferrer), IML (Ignacio Martín Loeches), LFR (Luis Felipe Reyes), AB (Ariel Barrios), JG (Juan Guardiola), MIR (Marcos I Restrepo). All the authors approved the final manuscript submitted for evaluation and possible publication.
The findings and conclusions of the present manuscript are the responsibility of the authors and do not necessarily represent the official position of the SEMICYUC.
Auspice functionsThe SEMICYUC has not been involved in the design of the study, in analysis and interpretation of the data, or in drafting of the present manuscript. JG has had partial work leave for the analysis of the study, though a research grant from the Fundación Privada Barri. AR, the corresponding author, has had access to all the data of the study and is the person ultimately responsible for submission of the manuscript for publication.
Conflicts of interestAR has held a research grant from Gilead Science for the study of nebulized antibiotics. In addition, he has received payment for teaching conferences from Biomerieux, Astellas, Pfizer, Thermo Fisher, MSD, Gilead, Shionogi and BRHAMS. However, he has no conflicts of interest in relation to the present manuscript.
This study has been auspiced by the SEMICYUC (Sociedad Española de Medicina Intensiva, Crítica y Unidades Coronarias). The authors thank all the investigators of the GETGAG (Spanish Working Group in Severe Influenza A) for their continuous participation in the project since the year 2009 - without which the project would not have been possible.
Clinical coordinators: M. Samper, G. Moreno, M. Bodi, E. Díaz, J. Marín-Corral, L. Claverias, S. Trefler, J.C. Yebenes, J. Solé-Violán, A. Torres, P. Ramírez, J. Garnacho-Montero, R. Ferrer, A. Rodríguez.
Scientific data coordinators: M. Ruíz-Botella, J. Gómez, J. Albiol, E. Mayol
External consultants: I. Martín-Loeches, L.F. Reyes, A. Barrios, J. Guardiola, M.I. Restrepo.
The following are Supplementary data to this article:
Please cite this article as: Spanish Influenza Score (SIS): utilidad del Machine Learning en el desarrollo de una escala temprana de predicción de mortalidad en la gripe grave. Med Intensiva. 2021;45:69–79.