


The “Open Lung Approach” (OLA), that includes high levels of positive end-expiratory pressure coupled with limited tidal volumes, is considered optimal for adult patients with ARDS. However, many previous meta-analyses have shown only marginal benefits of OLA on mortality but with statistical heterogeneity. It is crucial to identify the most likely moderators of this effect.
To determine the effect of OLA strategy on mortality of ventilated ARDS patients. We hypothesized that the degree of recruitment achieved in the control group (PaO2/FiO2 ratio on day 3 of ventilation), and the difference in Mechanical Power (MP) or Driving Pressure (DP) between experimental and control groups will be the most likely sources of heterogeneity.
DesignA Systematic Review and Meta-analysis was performed according to PRISMA statement and registered in PROSPERO database. We searched only for randomized controlled trials (RCTs). GRADE guidelines were used for rating the quality of evidence. Publication bias was assessed. For the Meta-analysis, we used a Random Effects Model. Sources of heterogeneity were explored with Meta-Regression, using a priori proposed set of possible moderators. For model comparison, Akaike's Information Criterion with the finite sample correction (AICc) was used.
SettingNot applicable.
PatientsFourteen RCTs were included in the study.
InterventionsNot applicable.
Main variables of interestNot applicable.
ResultsEvidence of publication bias was detected, and quality of evidence was downgraded. Pooled analysis did not show a significant difference in the 28-day mortality between OLA strategy and control groups. Overall risk of bias was low. The analysis detected statistical heterogeneity. The two “best” explicative meta-regression models were those that used control PaO2/FiO2 on day 3 and difference in MP between experimental and control groups. The DP and MP models were highly correlated.
ConclusionsThere is no clear benefit of OLA strategy on mortality of ARDS patients, with significant heterogeneity among RCTs. Mortality effect of OLA is mediated by lung recruitment and mechanical power.
La Estrategia Open Lung (EOL), que incluye niveles elevados de presión positiva teleespiratoria junto con volumen corriente bajo, es considerada como el «patrón oro» para los pacientes adultos con SDRA. Sin embargo, varios metaanálisis previos han mostrado únicamente beneficios marginales de la EOL en la disminución de la mortalidad, aunque con gran heterogeneidad estadística. Es crucial identificar los moderadores más probables, así como determinar el efecto de la estrategia EOL en la mortalidad de los pacientes ventilados con SDRA.
La hipótesis fue que el grado de reclutamiento alcanzado en el grupo control (cociente PaO2/FiO2 en el día3 de ventilación) y la diferencia en potencia mecánica (MP) o driving pressure (DP) entre el grupo experimental y el grupo control son la fuente más probable de heterogeneidad.
DiseñoSe realizó una revisión sistemática y metaanálisis de acuerdo con la declaración PRISMA, y se registró en la base de datos PROSPERO (N.° CRD42020179778). Se seleccionaron únicamente ensayos clínicos aleatorizados (ECA). Se estratificó la calidad de la evidencia de acuerdo con la metodología GRADE. Se evaluó el sesgo de publicación. Para el metaanálisis se utilizó el modelo de efectos aleatorios. Se exploraron las fuentes de heterogeneidad mediante metarregresión utilizando a priori un conjunto establecido de posibles moderadores. Para el modelo de comparación se utilizó el criterio de información de Akaike con la corrección para muestras pequeñas (AICc).
ÁmbitoNo aplica.
PacientesSe incluyeron 14 ECA en el estudio.
IntervencionesNo aplica.
Variables de interésNo aplica.
ResultadosSe detectó un sesgo de publicación, y la calidad fue degradada. El análisis combinado no mostró una diferencia estadísticamente significativa en la mortalidad en el día28 entre la estrategia EOL y los grupos control. El riesgo total de sesgo fue bajo. El análisis detectó heterogeneidad estadística. Los dos «mejores» modelos de metarregresión para explicar esa heterogeneidad fueron los que utilizaron la PaO2/FiO2 del grupo control en el día3 de ventilación y la diferencia en MP entre el grupo experimental y los grupos control. Los modelos basados en DP y MP mostraron una elevada correlación.
ConclusionesNo existe un claro beneficio de la estrategia EOL en la mortalidad de los pacientes con SDRA, con heterogeneidad significativa entre ECA. El efecto de la EOL sobre la mortalidad está influenciado por el reclutamiento pulmonar y la potencia mecánica.
The “Open Lung Approach” (OLA) or “Protective Ventilation” are considered optimal strategies for patients with ARDS. This includes application of high levels of positive end-expiratory pressure (PEEP) to achieve lung recruitment coupled with limited tidal volumes (VT) or ventilator distending pressures. Occasionally, additional strategies such as prone positioning or recruitment manoeuvres (RM) are applied to help recruit the lung.
Based on the evidence of ARDSnet trial,1 strong agreement exists to support one component of the OLA, limiting VT and ventilator distending pressures. However, the evidence of benefit for high versus low PEEP is less clear. Many previous meta-analyses have evaluated the effect PEEP levels, with a suggestion of potential benefit of high PEEP strategies but notably with high statistical heterogeneity.2–4 The sources of heterogeneity are multiple and include factors related to the rules for PEEP management, levels of PEEP used to label an intervention as “High-PEEP”, differing inspiratory pressure and tidal volume limits, and patient related heterogeneity in ARDS severity and lung recruitabilty. As such, understanding the potential impact that these sources of heterogeneity have on the results of these trials is crucial before undertaking additional RCTs in this domain.
Since Amato MB et al.5 trial of 1995, PEEP is used more liberally as a routine strategy in mechanical ventilation (MV) of ARDS patients. Interestingly, this phenomenon was first observed in the control group of ALVEOLI trial,6 were the PEEP/FiO2 protocol for the intervention group was changed because there was little separation between intervention and control patients. Furthermore, after the ARDSnet trial1 was published in 2000, VT and distending pressures limitation became standard of care. We hypothesize that this evolving philosophy in the use of PEEP and VT in the control group is a significant source of heterogeneity among trials in evaluating the effect of OLA on mortality.
Also several modes of OLA strategy have been described, based on different forms of setting the high values of PEEP: above the lower inflection point of the static pressure-volume curve, using tables that fix mandatory PEEP/FiO2 scales, guided by the oesophageal pressure, due to the best compliance region, the effects of RMs, etc. This could also have had an influence on the heterogeneous effect of the OLA on ARDS mortality.
There is clear evidence that Driving Pressure (DP) is associated with excess mortality in ARDS patients.7 And recently Gattinoni et al.8 proposed that Mechanical Power (MP), a measure of the energy applied to the lung by the ventilator per unit of time, plays the main role in ventilator induced lung injury (VILI).9 Changes to PEEP can increase or decrease DP or MP. We hypothesize this is another major source of heterogeneity. Previous meta-analyses have incompletely explored all these sources of heterogeneity.
The main objective of this systematic review and meta-analysis was to determine the effect of OLA strategy on mortality of ventilated ARDS patients. We specifically sought to identify the most likely moderators of this effect, including variables such as modality of OLA strategy applied to the experimental group, the level of recruitment achieved in the control group, and the balance between MP or DP applied to both cohorts of patients in the randomized trials. We hypothesized that the most important moderators would relate to the degree of recruitment achieved in the control group, and differences in MP between control and intervention group.
MethodsThis work was performed according to the Preferred Reporting Items for Systematic Reviews and Meta-Analyses (PRISMA) statement,10 and the guidelines proposed by the Cochrane Collaboration in the Cochrane Handbook,11 was registered in the International Prospective Register of Systematic Reviews (PROSPERO, CRD number: CRD42020179778).
Study inclusion criteriaPatients: Mechanically ventilated, adult patients with ARDS.
Study designs: We included high quality Randomized Controlled Trials that compared mechanical ventilation using OLA strategy (OLA group) with conventional ventilation (control group). For this review, “OLA strategy” included any experimental MV strategy aimed to protect the patient's lungs, maximizing lung recruitment that resulted in low VT (or low distending pressure or driving pressure) and high PEEP levels. We included trials that allowed the use of RMs, but only if they used RMs as part of a general strategy of high PEEP and low VT. We excluded trials in which the experimental treatment were only RMs, prone position, inhaled Nitric Oxide, Surfactant, Corticosteroids or other medical or surgical treatments without a high PEEP protocol.
Outcome: Our outcome of interest was mortality within 28–30 days after the first intubation, substituting hospital mortality as needed. For this outcome we estimated the global relative risk (RR) with 95% confidence interval (CI) and so we also excluded studies that did not provide data to calculate RR with 95% CI.
Search strategyTwo researchers (S.F.U. and A.M.V.) conducted an independent literature search to identify potentially relevant studies. The two most recent systematic reviews of RCT's comparing higher versus lower PEEP ventilation strategies in patients with ARDS12,13 were identified and their bibliographies were manually reviewed. Then the search was updated to identify additional trials in electronic databases. Search terms and databases are detailed in the supplement. Discrepancies between the two researchers were evaluated by a third researcher (V.M.A.).
Study selectionTwo investigators (P.V.G. and C.C.) independently reviewed the search results to identify pertinent articles. Disagreements on eligibility were resolved by a third author (V.M.A.) through consensus. In duplicate, they also abstracted data and assessed risk of bias.
Data extraction and study qualityMeta-analysis was restricted only to High Quality RCTs, on a methodological basis. Each identified trial was assessed for evidence of bias using CASPe criteria14 and the Cochrane Collaboration risk of bias Tool.15 (see details in the online Supplement). Two investigators (P.V.G. and C.C.) independently completed the assessment. Disagreements were resolved by a third author (V.M.A.) through consensus.
The GRADE (Grading of Recommendations Assessment, Development, and Evaluation) guidelines were used for rating the quality of evidence for the group of studies included in our analysis (see details in the online Supplement). Summary of findings tables were prepared using GRADE Profiler software, through a project we created in GRADEpro GDT webpage database.
Statistical analysisIn all our analyses, we established the statistical significance in p-value less than or equal to 0.05. Publication bias was assessed via visual appraisal of symmetry of the Funnel–Plot, and a statistical test for Funnel–Plot asymmetry (Egger Regression). We also estimated the number of missing studies with the Trim and Fill method.
For the meta-analysis, we used a Random Effects Model (REM) assuming heterogeneity. The dependent variable was the natural log of the RR of mortality. The model was fit with a weighted least squares estimation. DerSimonian–Laird and Hartung–Knapp–Sidik–Jonkman tests were applied, and the model fit was evaluated with radial and QQ normality plots.
We performed all statistical analyses by using Review Manger 5.3 software (RevMan, The Cochrane Collaboration, Oxford, UK) and in R 3.6.3 with the metafor package.16
Sensitivity analysisTwo prespecified sensitivity analysis were performed. The first one, split the trials by the modality of OLA strategy applied in the experimental group. The second, split the trials based on if VT was limited in the control group.
Additional analysis of causes of heterogeneityOther possible causes of heterogeneity among studies were examined through meta-regression. For this analysis, a set of possible moderator variables was defined a priori to be included in different linear models. Rationale for the choice of these variables can be found in the online supplement.
- -
Model 1 (M1): PEEP in experimental group on day 1 (expPEEP_1st).
- -
Model 2 (M2): The moderator is PaO2/FiO2 ratio of control group at baseline (controlPF_0).
- -
Model 3 (M3): PaO2/FiO2 ratio of control group on day 3 (controlPF_3rd).
- -
Model 4 (M4): Difference in PaO2/FiO2 ratio between OLA and control groups on day 3 (gradPF_3rd).
- -
Model 5 (M5): Relative Driving Pressure (DP) on day 1(RelativeDP_1st).
- -
Model 6 (M6). Relative MP on day 1 (RelativeMP_1st). On the computation, we used Gattinoni's simplified formulae.17
Data on these variables were extracted from the published text and figures of the trials, including supplementary appendixes and files. For the meta-regression, a set of mixed-effects models (MEMs) were fitted, using one of the above variables as a moderator in each model. So, every model represents a candidate source of heterogeneity. The “best model”, representing the potential for largest source of heterogeneity was selected based on comparisons of information entropy measures of predictive accuracy (Akaike weights) derived from the Akaike's Information Criterion with the finite sample correction (AICc), removing the cases with missing values at the start to fit the models to exactly the same observations. Details on analysis and model assumptions are provided in the online supplement. In short, the model with the minimum AICc was selected as the “best” one (in the expected Kullbach-Leibler discrepancy sense). For every model we computed the Likelihood of the Model (relative to the “best” one) given the data. Then, the relative model likelihoods are normalized (i.e., divided by the sum of the likelihoods of all models) to obtain Akaike weights (the probability of every model in this set to be the “best” one). And in the last step, the Turing-Good Weights of Evidence (WOE) against (in decibans), relative to the “best” one, of all models were computed. All the additional analysis was done in R 3.6.3 with the metafor package.16
ResultsOf the articles examined, seven RCTs were excluded: one because it was duplicated publication,5 one because it was done on normal (not ARDS) lungs,18 one because experimental arm included low Vt without high PEEP,1 one because experimental arm included mandatory prone position,19 and three because experimental arm included only RMs.20–22
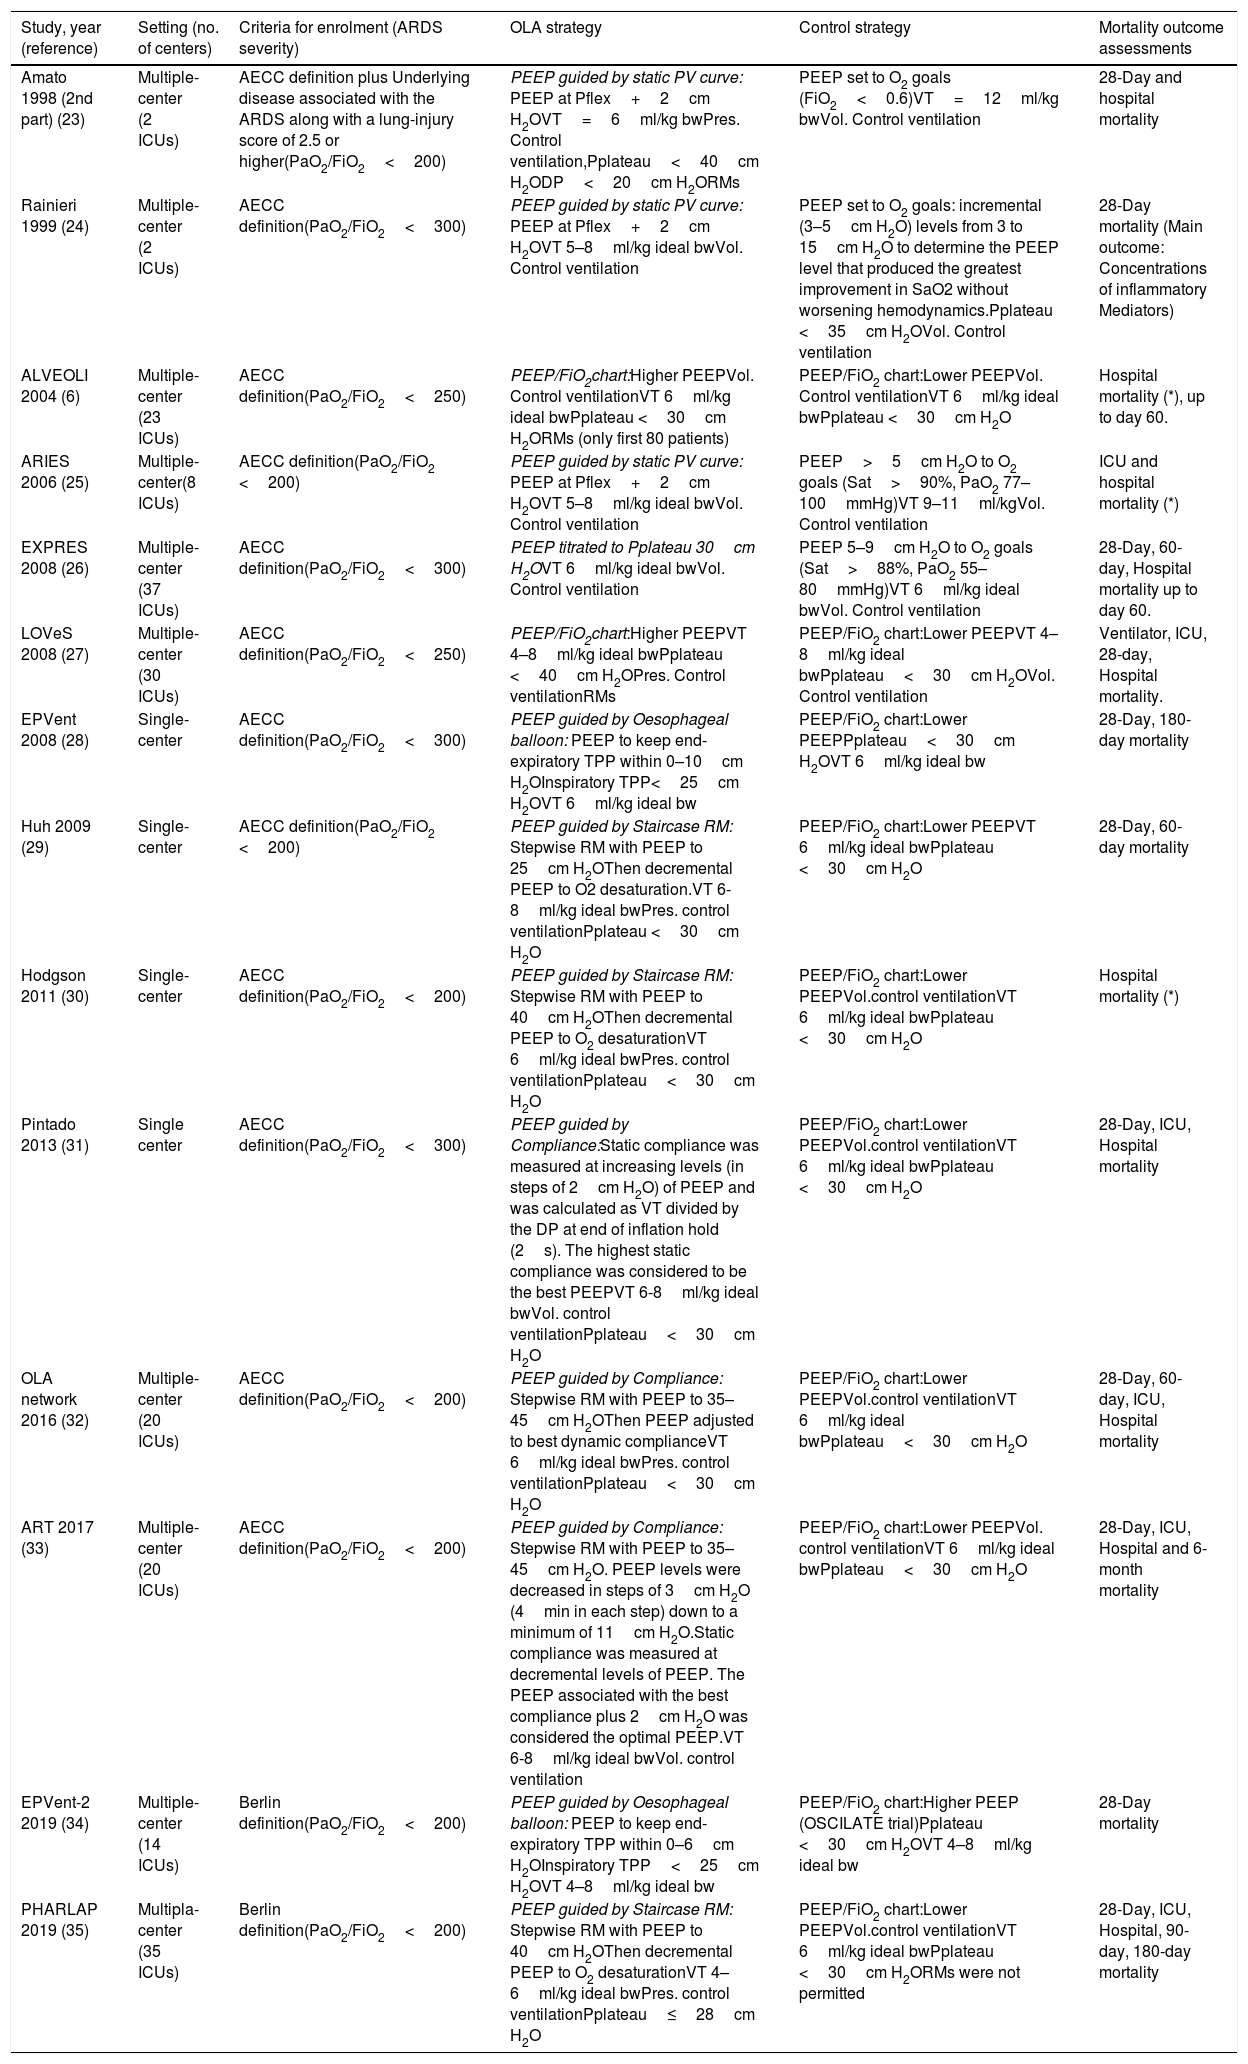
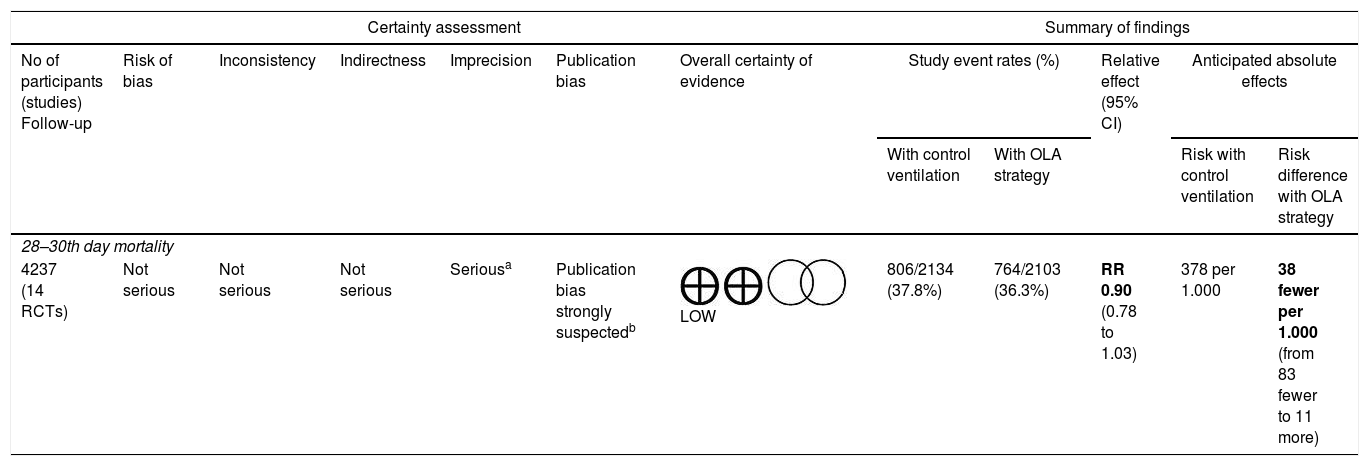
Fourteen RCTs met inclusion criteria (Fig. 1), including 4.237 ventilated adults with ARDS, of whom 1,570 (37.05%) died. Table 1 Apple6,23–35 summarizes baseline patient characteristics and the various OLA strategy protocols used among included studies. GRADE quality of evidence for mortality was downgraded (Table 2) because of imprecision, and because evidence of publication bias was detected. Fig. 2 shows the Funnel plot with a non-symmetric visual appearance. The Egger regression test was statistically significant (p=0.0405), and the Trim and Fill method detected that 2 studies could be missing.
 Flow diagram of the study selection process. PEEP: positive end-expiratory pressure. VT: tidal volume. RMs: recruitment manoeuvres. Exp.: experimental.")
Baseline patient characteristics and OLA strategy protocols used in the studies.
| Study, year (reference) | Setting (no. of centers) | Criteria for enrolment (ARDS severity) | OLA strategy | Control strategy | Mortality outcome assessments |
|---|---|---|---|---|---|
| Amato 1998 (2nd part) (23) | Multiple-center (2 ICUs) | AECC definition plus Underlying disease associated with the ARDS along with a lung-injury score of 2.5 or higher(PaO2/FiO2<200) | PEEP guided by static PV curve: PEEP at Pflex+2cm H2OVT=6ml/kg bwPres. Control ventilation,Pplateau<40cm H2ODP<20cm H2ORMs | PEEP set to O2 goals (FiO2<0.6)VT=12ml/kg bwVol. Control ventilation | 28-Day and hospital mortality |
| Rainieri 1999 (24) | Multiple-center (2 ICUs) | AECC definition(PaO2/FiO2<300) | PEEP guided by static PV curve: PEEP at Pflex+2cm H2OVT 5–8ml/kg ideal bwVol. Control ventilation | PEEP set to O2 goals: incremental (3–5cm H2O) levels from 3 to 15cm H2O to determine the PEEP level that produced the greatest improvement in SaO2 without worsening hemodynamics.Pplateau <35cm H2OVol. Control ventilation | 28-Day mortality (Main outcome: Concentrations of inflammatory Mediators) |
| ALVEOLI 2004 (6) | Multiple-center (23 ICUs) | AECC definition(PaO2/FiO2<250) | PEEP/FiO2chart:Higher PEEPVol. Control ventilationVT 6ml/kg ideal bwPplateau <30cm H2ORMs (only first 80 patients) | PEEP/FiO2 chart:Lower PEEPVol. Control ventilationVT 6ml/kg ideal bwPplateau <30cm H2O | Hospital mortality (*), up to day 60. |
| ARIES 2006 (25) | Multiple-center(8 ICUs) | AECC definition(PaO2/FiO2 <200) | PEEP guided by static PV curve: PEEP at Pflex+2cm H2OVT 5–8ml/kg ideal bwVol. Control ventilation | PEEP>5cm H2O to O2 goals (Sat>90%, PaO2 77–100mmHg)VT 9–11ml/kgVol. Control ventilation | ICU and hospital mortality (*) |
| EXPRES 2008 (26) | Multiple-center (37 ICUs) | AECC definition(PaO2/FiO2<300) | PEEP titrated to Pplateau 30cm H2OVT 6ml/kg ideal bwVol. Control ventilation | PEEP 5–9cm H2O to O2 goals (Sat>88%, PaO2 55–80mmHg)VT 6ml/kg ideal bwVol. Control ventilation | 28-Day, 60-day, Hospital mortality up to day 60. |
| LOVeS 2008 (27) | Multiple-center (30 ICUs) | AECC definition(PaO2/FiO2<250) | PEEP/FiO2chart:Higher PEEPVT 4–8ml/kg ideal bwPplateau <40cm H2OPres. Control ventilationRMs | PEEP/FiO2 chart:Lower PEEPVT 4–8ml/kg ideal bwPplateau<30cm H2OVol. Control ventilation | Ventilator, ICU, 28-day, Hospital mortality. |
| EPVent 2008 (28) | Single-center | AECC definition(PaO2/FiO2<300) | PEEP guided by Oesophageal balloon: PEEP to keep end-expiratory TPP within 0–10cm H2OInspiratory TPP<25cm H2OVT 6ml/kg ideal bw | PEEP/FiO2 chart:Lower PEEPPplateau<30cm H2OVT 6ml/kg ideal bw | 28-Day, 180-day mortality |
| Huh 2009 (29) | Single-center | AECC definition(PaO2/FiO2 <200) | PEEP guided by Staircase RM: Stepwise RM with PEEP to 25cm H2OThen decremental PEEP to O2 desaturation.VT 6-8ml/kg ideal bwPres. control ventilationPplateau <30cm H2O | PEEP/FiO2 chart:Lower PEEPVT 6ml/kg ideal bwPplateau <30cm H2O | 28-Day, 60-day mortality |
| Hodgson 2011 (30) | Single-center | AECC definition(PaO2/FiO2<200) | PEEP guided by Staircase RM: Stepwise RM with PEEP to 40cm H2OThen decremental PEEP to O2 desaturationVT 6ml/kg ideal bwPres. control ventilationPplateau<30cm H2O | PEEP/FiO2 chart:Lower PEEPVol.control ventilationVT 6ml/kg ideal bwPplateau <30cm H2O | Hospital mortality (*) |
| Pintado 2013 (31) | Single center | AECC definition(PaO2/FiO2<300) | PEEP guided by Compliance:Static compliance was measured at increasing levels (in steps of 2cm H2O) of PEEP and was calculated as VT divided by the DP at end of inflation hold (2s). The highest static compliance was considered to be the best PEEPVT 6-8ml/kg ideal bwVol. control ventilationPplateau<30cm H2O | PEEP/FiO2 chart:Lower PEEPVol.control ventilationVT 6ml/kg ideal bwPplateau <30cm H2O | 28-Day, ICU, Hospital mortality |
| OLA network 2016 (32) | Multiple-center (20 ICUs) | AECC definition(PaO2/FiO2<200) | PEEP guided by Compliance: Stepwise RM with PEEP to 35–45cm H2OThen PEEP adjusted to best dynamic complianceVT 6ml/kg ideal bwPres. control ventilationPplateau<30cm H2O | PEEP/FiO2 chart:Lower PEEPVol.control ventilationVT 6ml/kg ideal bwPplateau<30cm H2O | 28-Day, 60-day, ICU, Hospital mortality |
| ART 2017 (33) | Multiple-center (20 ICUs) | AECC definition(PaO2/FiO2<200) | PEEP guided by Compliance: Stepwise RM with PEEP to 35–45cm H2O. PEEP levels were decreased in steps of 3cm H2O (4min in each step) down to a minimum of 11cm H2O.Static compliance was measured at decremental levels of PEEP. The PEEP associated with the best compliance plus 2cm H2O was considered the optimal PEEP.VT 6-8ml/kg ideal bwVol. control ventilation | PEEP/FiO2 chart:Lower PEEPVol. control ventilationVT 6ml/kg ideal bwPplateau<30cm H2O | 28-Day, ICU, Hospital and 6-month mortality |
| EPVent-2 2019 (34) | Multiple-center (14 ICUs) | Berlin definition(PaO2/FiO2<200) | PEEP guided by Oesophageal balloon: PEEP to keep end-expiratory TPP within 0–6cm H2OInspiratory TPP<25cm H2OVT 4–8ml/kg ideal bw | PEEP/FiO2 chart:Higher PEEP (OSCILATE trial)Pplateau <30cm H2OVT 4–8ml/kg ideal bw | 28-Day mortality |
| PHARLAP 2019 (35) | Multipla-center (35 ICUs) | Berlin definition(PaO2/FiO2<200) | PEEP guided by Staircase RM: Stepwise RM with PEEP to 40cm H2OThen decremental PEEP to O2 desaturationVT 4–6ml/kg ideal bwPres. control ventilationPplateau≤28cm H2O | PEEP/FiO2 chart:Lower PEEPVol.control ventilationVT 6ml/kg ideal bwPplateau <30cm H2ORMs were not permitted | 28-Day, ICU, Hospital, 90-day, 180-day mortality |
In three studies (*), for the analysis we considered 28–30 day mortality same as hospital mortality. PEEP, positive end-expiratory pressure. SaO2, arterial oxygen saturation (%). DP, driving pressures (Pplateau – total PEEP) measured at inspiratory and expiratory holds. bw, body weight. RMs, recruitment manoeuvres. TPP, trans-pulmonary pressure. AECC definition: American-European Consensus Conference definition of ARDS. (1) Acute onset of hypoxemia (PaO2/FiO2<200mm Hg, acute lung injury: PaO2/FiO2<300mmHg); (2) Bilateral pulmonary infiltrates on an anterior/posterior chest radiograph; (3) A pulmonary artery occlusion pressure<18mm Hg or no evidence of left ventricular failure. Berlin definition: (1) Timing: within 1 week of a known clinical insult or new or worsening respiratory symptoms; (2) Chest imaging: bilateral opacities, not fully explained by effusions, lobar/lung collapse, or nodules; (3) Origin of oedema: respiratory failure not fully explained by cardiac failure or fluid overload, and need objective assessment to exclude hydrostatic oedema if no risk factor present; (4) Oxygenation: mild: 200mm Hg<PaO2/FiO2<300mm Hg with PEEP or continuous positive airway pressure (CPAP)≥5cm H2O; moderate: 100mmHg<PaO2/FiO2<200mm Hg with PEEP≥5cm H2O; severe: PaO2/FiO2<100mmHg with PEEP≥5cm H2O.
The GRADE quality of evidence for the outcome 28–30th day mortality.
| Certainty assessment | Summary of findings | ||||||||||
|---|---|---|---|---|---|---|---|---|---|---|---|
| No of participants (studies) Follow-up | Risk of bias | Inconsistency | Indirectness | Imprecision | Publication bias | Overall certainty of evidence | Study event rates (%) | Relative effect (95% CI) | Anticipated absolute effects | ||
| With control ventilation | With OLA strategy | Risk with control ventilation | Risk difference with OLA strategy | ||||||||
| 28–30th day mortality | |||||||||||
| 4237 (14 RCTs) | Not serious | Not serious | Not serious | Seriousa | Publication bias strongly suspectedb | LOW | 806/2134 (37.8%) | 764/2103 (36.3%) | RR 0.90 (0.78 to 1.03) | 378 per 1.000 | 38 fewer per 1.000 (from 83 fewer to 11 more) |
CI: confidence interval; RR: risk ratio.
Explanations:
.")
In ventilated adult patients with ARDS, pooled analysis in the Random Effect Model (REM) did not show a significant difference in the 28-day mortality between OLA strategy and control groups: RR=0.90; 95% CI=0.78–1.03; z-val=−1.513; p=0.1303 (DerSimonian–Laird method) or RR=0.89; 95% CI=0.77–1.05; t-val=−1.466; p=0.1664 (Hartung–Knapp–Sidik–Jonkman method). The analysis detected statistical evidence for heterogeneity among the studies (chi-square Q(df=13)=24.8607, p-val=0.0241, I2=48%), graphically represented in L’Abbé plot (Fig. S1, online supplement). The details are shown in Fig. 3, that includes risk of bias evaluation. Overall risk of bias was considered to be low. Fig. S2, online supplement shows the cumulative meta-analysis, highlighting that the beneficial effects of the OLA appear to be diminishing over time.
 Forest plot of comparison: OLA strategy vs. control ventilation, outcome: 28–30th day mortality. Includes risk of bias summary for each included study. (B) Risk of bias graph: review authors’ judgements about each risk of bias item presented as percentages across all included studies.")
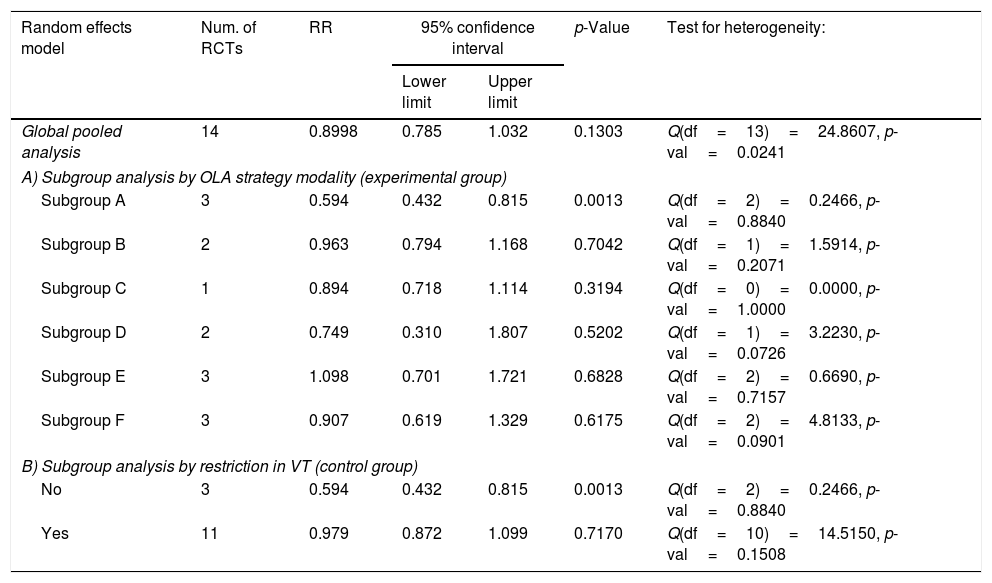
Table 3 shows the results of two prespecified subgroup sensitivity analysis. In the first, mortality was significantly lower in the OLA group compared to the control group only when the OLA strategy was based on setting PEEP based on the lower inflection point of the P-V curve. In the second, mortality was significantly lower in the OLA group only when VT was not limited in control group.
Sensitivity analysis: (A) Subgroups by OLA strategy modality in the experimental group. Subgroup A: PEEP guided by static PV curve: PEEP at Pflex+2cm H2O; Subgroup B: PEEP/FiO2 chart table; Subgroup C: PEEP titrated to Pplateau<30cm H2O (VT 6ml/kg ideal body weight); Subgroup D: PEEP guided by Oesophageal balloon; Subgroup E: PEEP guided by Staircase MR; Subgroup F: PEEP guided by maximal Compliance. (B) Subgroups by restriction in VT in the control group. No: No restriction of tidal volume in control group. Yes: Restriction in tidal volume in control group.
| Random effects model | Num. of RCTs | RR | 95% confidence interval | p-Value | Test for heterogeneity: | |
|---|---|---|---|---|---|---|
| Lower limit | Upper limit | |||||
| Global pooled analysis | 14 | 0.8998 | 0.785 | 1.032 | 0.1303 | Q(df=13)=24.8607, p-val=0.0241 |
| A) Subgroup analysis by OLA strategy modality (experimental group) | ||||||
| Subgroup A | 3 | 0.594 | 0.432 | 0.815 | 0.0013 | Q(df=2)=0.2466, p-val=0.8840 |
| Subgroup B | 2 | 0.963 | 0.794 | 1.168 | 0.7042 | Q(df=1)=1.5914, p-val=0.2071 |
| Subgroup C | 1 | 0.894 | 0.718 | 1.114 | 0.3194 | Q(df=0)=0.0000, p-val=1.0000 |
| Subgroup D | 2 | 0.749 | 0.310 | 1.807 | 0.5202 | Q(df=1)=3.2230, p-val=0.0726 |
| Subgroup E | 3 | 1.098 | 0.701 | 1.721 | 0.6828 | Q(df=2)=0.6690, p-val=0.7157 |
| Subgroup F | 3 | 0.907 | 0.619 | 1.329 | 0.6175 | Q(df=2)=4.8133, p-val=0.0901 |
| B) Subgroup analysis by restriction in VT (control group) | ||||||
| No | 3 | 0.594 | 0.432 | 0.815 | 0.0013 | Q(df=2)=0.2466, p-val=0.8840 |
| Yes | 11 | 0.979 | 0.872 | 1.099 | 0.7170 | Q(df=10)=14.5150, p-val=0.1508 |
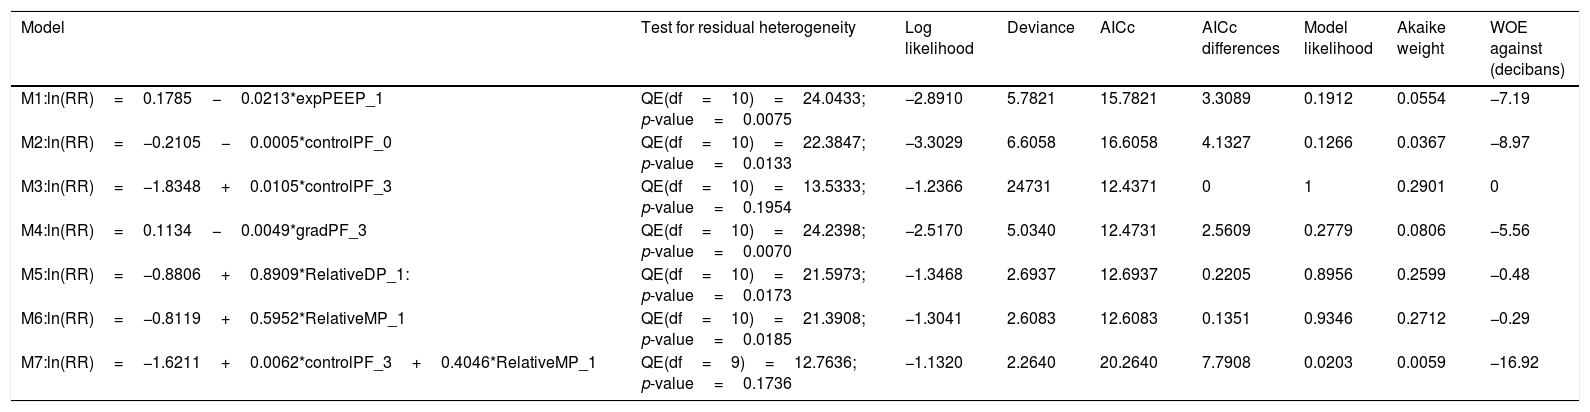
Other possible causes of heterogeneity between studies were explored by meta-regression. We had complete data for all necessary variables in twelve RCTs. Seven meta-regression models were fit. The first six models used one of the above-mentioned variables as the hypothesized moderator, representing possible candidate theories to explain the relationship between the OLA strategy and mortality. The seventh model combined the two more probable candidates. Table 4 shows the results of model selection process.
Model selection process.
| Model | Test for residual heterogeneity | Log likelihood | Deviance | AICc | AICc differences | Model likelihood | Akaike weight | WOE against (decibans) |
|---|---|---|---|---|---|---|---|---|
| M1:ln(RR)=0.1785−0.0213*expPEEP_1 | QE(df=10)=24.0433; p-value=0.0075 | −2.8910 | 5.7821 | 15.7821 | 3.3089 | 0.1912 | 0.0554 | −7.19 |
| M2:ln(RR)=−0.2105−0.0005*controlPF_0 | QE(df=10)=22.3847; p-value=0.0133 | −3.3029 | 6.6058 | 16.6058 | 4.1327 | 0.1266 | 0.0367 | −8.97 |
| M3:ln(RR)=−1.8348+0.0105*controlPF_3 | QE(df=10)=13.5333; p-value=0.1954 | −1.2366 | 24731 | 12.4371 | 0 | 1 | 0.2901 | 0 |
| M4:ln(RR)=0.1134−0.0049*gradPF_3 | QE(df=10)=24.2398; p-value=0.0070 | −2.5170 | 5.0340 | 12.4731 | 2.5609 | 0.2779 | 0.0806 | −5.56 |
| M5:ln(RR)=−0.8806+0.8909*RelativeDP_1: | QE(df=10)=21.5973; p-value=0.0173 | −1.3468 | 2.6937 | 12.6937 | 0.2205 | 0.8956 | 0.2599 | −0.48 |
| M6:ln(RR)=−0.8119+0.5952*RelativeMP_1 | QE(df=10)=21.3908; p-value=0.0185 | −1.3041 | 2.6083 | 12.6083 | 0.1351 | 0.9346 | 0.2712 | −0.29 |
| M7:ln(RR)=−1.6211+0.0062*controlPF_3+0.4046*RelativeMP_1 | QE(df=9)=12.7636; p-value=0.1736 | −1.1320 | 2.2640 | 20.2640 | 7.7908 | 0.0203 | 0.0059 | −16.92 |
AICc: Second-Order Bias Corrected Akaike Information Criterion. AICc differences: AICc−minimum AICc of the set. Akaike Weight: Probability that every model is the “best” model (in the expected Kullback–Leibler discrepancy sense). WOE against: Weight of Evidence (in decibans) against every model, relative to the best model.
Model M3, using PaO2/FiO2 in the control group on day 3 of ventilation, had a probability of 0.290 of being the “best” one. Model M6, which represents the mechanical power theory, was the second-best model with a probability of 0.271 and a WOE against of −0.29 decibans. Model M5, representing the driving pressure theory, was the third best model (probability=0.260 and WOE against=−0.45 decibans). RelativeDP_1 and RelativeMP_1 were highly correlated variables (R2==0.709, 95% CI=0.228–0.912, p.value=0.0098; see Fig. S3, online supplement) probably because they are mathematically coupled (DP intervenes in MP computation). For the rest of the models, the evidence weights against them. Model M7, with two moderators, scores the worst.
Figs. 4 and 5 represent the two best models (both with WOE=0). In Fig. 4 (and Fig. S4, online supplement), it is clear that the benefit of the OLA over the control group is seen when the PF ratio on day 3 in the control group is lower, with a suggestion of potential for harm when PF ratio climbs above 180. In Fig. 5 (and Fig. S5, online supplement), the benefit of the OLA over the control group is seen only when the MP in the OLA group is less than the MP in the control group, with a suggestion for potential harm when the MP in the OLA group exceeds 1.4 times the MP in the control group.
 on RR of mortality. Each trial is represented by a symbol of area proportional to its precision (inverse variance of RR).")
 on RR of mortality. Each trial is represented by a symbol of area proportional to its precision (inverse variance of RR).")
We were not able to show that OLA strategy reduces mortality in ventilated adults with ARDS, although there was significant statistical heterogeneity. We found that sources that account for this heterogeneity include the method of PEEP management in the intervention group, the lack of use of lung protective tidal volume in the control group, the level of recruitment achieved in the control group (PF ratio on day 3 of ventilation), and the relative difference in mechanical power or driving pressure between intervention and control patients. This highlights that interpretation of the benefits of the OLA must consider these factors, and future randomized trials should specifically try to address these sources of heterogeneity to truly understand the combination of interventions and patients who are likely to benefit from a particular OLA strategy.
Our results differ from previous meta-analysis on the OLA and/or high-PEEP strategies. Lu et al.13 included 15 RCTs focused on an OLA strategy which included high PEEP (with or without prone position) and/or RMs. High PEEP was therefore not a mandatory constituent of the experimental arm. Using a subgroup of 9 studies the found lower 28-day mortality with the OLA, with no substantial heterogeneity. Their analysis included 2 trials in which the experimental treatment consisted only of RMs (one of them with mandatory prone position) that were excluded in our analysis. However, they did not include 3 big RCTS published since 2017, which are included in our analysis, and likely contribute to the different results (note the influence of these 3 recent trials on Fig. S2, online supplement).
Our meta-analysis is congruent with the results of Walkey et al.12 and Santa Cruz et al.2 These studies showed no beneficial effects of High PEEP strategies on mortality. Both authors made attempts to restrict inclusion of studies to minimize heterogeneity related to aspects of the OLA outside PEEP management, with focused meta-analysis on PEEP. We choose to take a different approach because when ventilating ARDS patients, ICU clinicians tend to use the whole protective ventilation strategy. Therefore, the relevant clinical question is the effect of the whole strategy. If the price to pay is heterogeneity, statistical techniques can be used to explore the sources of heterogeneity.
Statistical heterogeneity was detected in our study. Fig. 3 shows substantial quantitative differences in the results from the different RCTs, and it is probable that there were substantial clinical differences between studies and the patients in them. An analysis which ignores this heterogeneity is a missing opportunity for investigation.36 For this reason, we estimated the global effect using classical Der Simonian–Laird and a Hartung–Knapp–Sidik–Lonkman37 REMs. We could have used another Likelihood based (or Bayesian) method.38 However, when heterogeneity among RCTs is present, if the results are to affect future clinical practice a single overall summary estimate of treatment benefit has little practical applicability. So, it is of clinical and scientific importance to investigate potential sources of that heterogeneity.
We performed two sensitivity analysis to explore heterogeneity. The first looked at modality of achieving the OLA. We found evidence of heterogeneity coming from studies in which PEEP was adjusted based on a lower inflection point of the static Pressure-Volume curve. However, this was applied in only 101 of the 2103 patients (less than 5%) of the experimental arm, in 3 early trials, and the OLA resulted in lower mortality as was seen in previous meta-analysis.39 The second sensitivity analysis focused on limited VT in the control group. Higher VT was applied in the control group in the same subgroup of 3 early trials, and again the OLA resulted in lower mortality only when limited VT was not applied. Given this small number, we cannot exclude residual confounding (or regression to the mean) so we cannot assure that therapeutic modality in the way the OLA strategy was prescribed, limiting VT or both were the primary source of heterogeneity.
Another major source for heterogeneity relates to whether there is variation in the treatment benefit according to a patient's underlying risk of the event that the treatment is designed to decrease. We attempted to take a statistical approach39 to evaluate this, using MEM meta-regression to investigate the dependence of the treatment effect on a priori stated predictors in every trial. Each predictor represented a competitive hypothesis on the causal pathways of mortality through Ventilator Induced Lung Injury (VILI). Our results showed two theories were practically equal in terms of probability of being the “best” explicative model, given the data and relative to this set of models.
The most probable “best” model of our set represents heterogeneity in treatment effect based on the recruitment achieved in the control group, measured with the PaO2/FiO2 of the control group on the day 3 of ventilation. As the randomization has created equivalent cohorts at the beginning of the trial, this measure also represents the counterfactual evolution of experimental group if the OLA strategy had not been applied. Our analysis shows that OLA strategy is only effective when conventional strategies (control group) fail to yield a PaO2/FiO2≥170. This threshold of a potential differential treatment effect and/or outcome when the PF ratio passes an inflection point between 150 and 175 is reproducible in many areas of the ARDS literature, including Non-Invasive Ventilation (NIV),40 prone positioning,41 neuromuscular blockade,42 and High-Frequency Ventilation literature.43
The second most probable “best” model, represents heterogeneity in treatment effect based on the difference in Mechanical Power between experimental and control groups. We used Gattinoni's simplified formulae17 to compute this, making some adjustments in Pressure-Controlled ventilation cohorts because there is no generally accepted formula for MP in Pressure-Controlled modes. We found that the OLA strategy is no longer beneficial over control group when the OLA results in higher MP than the control group, the beneficial effects of OLA ventilation vanishes. MP is associated with mortality,44 and some authors are trying to explain the benefits of prone position45 and neuromuscular blockade46 in terms of MP. However, the subject is far from being completely understood.
Nearly identical results were seen when using Driving Pressure instead of MP to explain heterogeneity, which is expected given high mathematical coupling and high statistical significance in correlation between DP and MP. When the OLA strategy group receives a higher DP than the control group, the beneficial effects of OLA are not seen. The effects described for DP on mortality of ventilated patients7 mimic those produced by MP.9,47,48 Likely MP and DP are carrying the same clinical information and our results confirm that DP seems to be the most important contributor to MP. DP is therefore unlikely an independent source of heterogeneity. The evidence weights against the rest of the models of our set, including the two-moderator model (MP and PF ratio combined) that raises concern of overfitting.
This study has limitations. First, we identified publication bias. We estimated that 2 studies could be missing, and their results could change the conclusions. Second, our set of possible theories explaining heterogeneity is not exhaustive, it might be that there are other alternative explanations that have not been investigated in this study. Third, the heterogeneity analysis was done only in twelve of the fourteen RCTs. In this way, our analysis loses power with higher Type II error (false negative rate). Fourth, as a secondary analysis of RCTs the effect of our “best” candidate moderators is not as robust as would be generated by a new RCT specifically addressed to clarify those hypotheses. However, there may be challenges to conducting such, an RCT because of lack of equipoise. In fact, both recently published RCTs were planned with the highest PEEP levels ever in the control group.34,35 And both were inconclusive, probably because the control groups were also OLA strategies in and of themselves. We are unaware of any RCT underway or planned that specifically address the relationship between MP and mortality in ARDS patients. We hope our results will encourage new trials to clarify this likely relationship.
In conclusion, this systematic review and meta-analysis has not been able to show the benefit of OLA strategy on mortality during mechanical ventilation of ARDS patients. However, our study points in the direction that the mortality effect of OLA strategy depends on recruitment (PaO2/FiO2) and mechanical power. Taken together, these results highlight important physiologic concepts which will be crucial for future RCTs: attempts to further open the lung with an OLA strategy are likely only going to be beneficial in those who have not already been recruited with conventional strategies (i.e. PF<170), and in whom application of higher PEEP results in less amount of energy applied to lung (i.e. lowers DP or MP).
Authors’ contributionVM and AM conceived the presented idea. AB developed the theory and performed the computations. PV and SFU conducted an independent literature search to identify potentially relevant studies. PV and CC independently reviewed the search results to identify pertinent articles. VM, AM, PV, CC, SFU, FG and RK contributed to the interpretation of the results. VM, AM, RK took the lead in writing the manuscript. All authors provided critical feedback and helped shape the research, analysis and manuscript.
Conflict of interestsThe authors declare that they have no conflict of interest.

