

In nested case-control studies, sampling of controls is usually done by density of incidence and pairing. With regard to the classic control cases studies, nested ones are more efficient, allow the calculation of the incidence of the disease and they have more internal validity due to the lower presence of bias. Competitive risks techniques can be used if we study different types of events and focus on the time and type of the first event. Recursive partitioning is a type of multivariate analysis whose purpose is the construction of classification algorithms, and it is especially useful when there are a large number of predictive variables with complex relationships with the event.
En los estudios de casos y controles anidados, el muestreo de los controles se hace habitualmente por densidad de incidencia y mediante emparejamiento. Con respecto a los casos control clásicos, son más eficientes, permiten el cálculo de la incidencia de la enfermedad y cuentan con más validez interna por la menor presencia de sesgo. Las técnicas de riesgos competitivos pueden usarse si se estudian diferentes tipos de eventos y nos centramos en el tiempo y el tipo del primer evento. El particionamiento recursivo es un tipo de análisis multivariante cuyo propósito es la construcción de algoritmos de clasificación, especialmente útiles cuando hay un gran número de variables predictoras con relaciones complejas con el evento objeto de estudio.
Research in health inevitably begins with the definition of the clinical problem we are dealing with and which we seek to resolve. While this may seem obvious, the need to ask ourselves what we want to do, what the reasons are, and whether someone else has already asked the same questions might not be so obvious.
It is necessary to contrast the information we intend to generate in relation to the clinical problem of our patients in the Intensive Care Unit (ICU) with the data found in the literature. We need to be consequent with the available evidence and with our objectives. In other words, it currently does not seem pertinent to conduct an observational study on the effect of an adequate antibiotic treatment upon mortality among critical patients with septic shock. We always must seek to carry out quality studies with an impact. This does not mean that we are always obliged to conduct randomized experimental studies, though it is also meaningless to carry out just one more of a long series of descriptive cohort studies of limited local value. Another important issue is ethics. Before conducting a study, we must take ethical particulars into account, since we always must remember that the ultimate aim of research is to improve patient quality of life. This means that it would be clearly unacceptable to carry out a clinical trial in which we adequately treat a group of patients and decide to suspend such treatment to see if mortality increases as a result.
Conditioned to the needs raised by our study, we should ask ourselves the same questions as those in the summarizing table below:
- –
Will we be carrying out some kind of intervention?
An intervention is not limited to the administration of a treatment but can also refer to a diagnostic test, a preventive measure, etc.
Yes→clinical trial (experimental design)
No→observational study
- –
Do the data we are going to use correspond to individuals or to groups of individuals?
Individuals→individual studies
Subgroups of patients→ecological studies
- –
Do we have a causal hypothesis or is a description first needed to establish the hypothesis?
Descriptive→cross-sectional studies
Analytical→longitudinal studies
- –
How are we going to measure the causal relationship?
Forwards→(exposure→effect). Cohort study
Backwards→(effect→exposure). Case-control study
In this chapter we will focus on some advanced designs that are still little used in clinical research in general and in the ICU setting in particular.
Cohort and case-control studies. Hybrid studiesIn recent times some studies have made use of designs that are somewhat different from what we commonly see in scientific publications. This may be because the authors seek to overcome as far as possible the limitations of the so-called classical methods, or because of the rising interest and advances of these more modern and robust methods. Both explanations are probably involved, however. This chapter will deal with one such design, included among the so-called hybrid studies, specifically the nested case-control study design.
Within research methodology, the most important area may be that referred to study design, for in sum, if we want to answer a research question arising from the observation of our patients, we need to know how to adequately design a study in order for the conclusions drawn to possess the required validity. It is not enough to simply have a question requiring an answer; we also need to know what design or type of study is adequate for the purpose.
Since case-control studies nested in a cohort are a kind of blend between cohort studies and case-control studies, we feel that both types of study should be contextualized here.
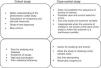
Cohort and case-control studiesThese two types of studies are longitudinal and analytical observational studies of individual data. In other words, they are studies in which we do not intervene but only observe what happens; each subject is a unit of the study we carry out over time to verify a cause-effect hypothesis. In practice, these are the most numerous studies, since they afford a good level of evidence without the need for great resources. A good summary of the differences between both types of studies can be found in Fig. 1.
Cohort studies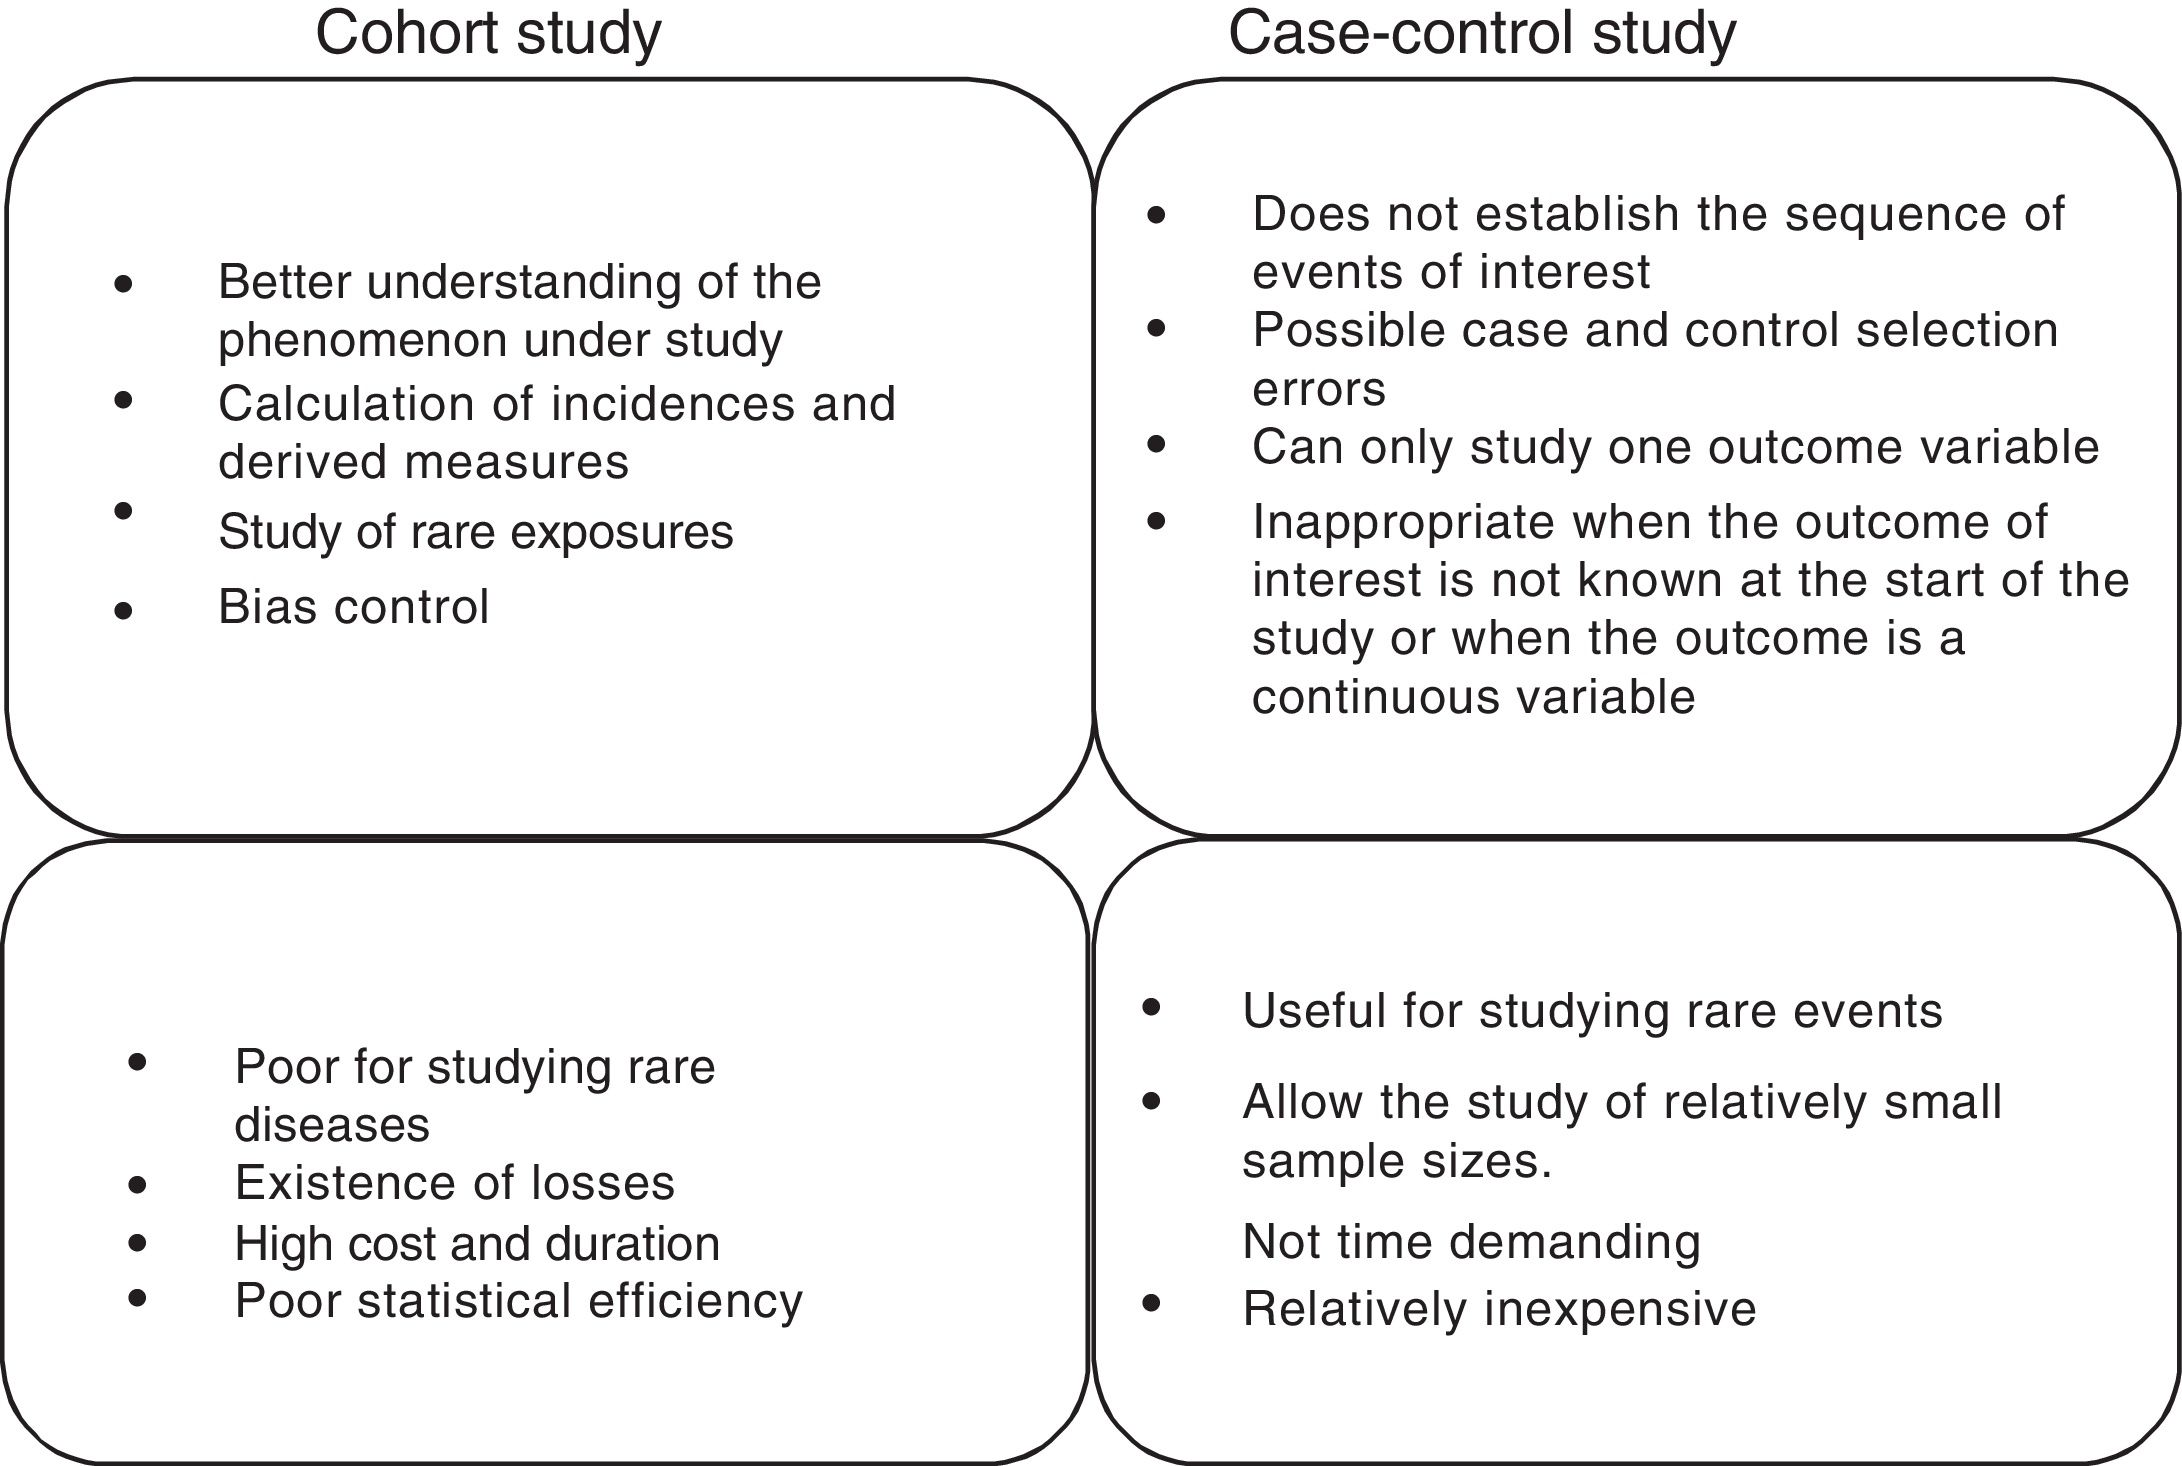
A cohort is a group of patients that have at least one characteristic in common and are observed over a period of time, e.g., patients with ventilator-associated pneumonia, patients with ischemic stroke subjected to anticoagulation therapy, or septic shock patients with hypoxemia. This type of design is used to observe patients that are or have been exposed to a certain factor or circumstance, establishing comparisons of the prevalence or incidence of a certain event with respect to another group that is not or has not been exposed to the same factor. Therefore, the most logical chronology for the conduction of studies of this kind would involve observation from a given point in time onwards. The most advantageous consequence of this approach is the possibility of calculating the incidence of the event and therefore the relative risk (RR) of its occurrence between exposed and non-exposed individuals.1
The usefulness of cohort studies is that they allow us to verify causal hypotheses. In other words, they allow us to reject or accept a certain hypothesis alternative to another null hypothesis initially accepted up to that time, due to a lack of elements of judgment allowing us to replace it with another hypothesis supported by greater evidence. In fact, cohort studies are the best design for identifying causal associations between a risk factor and a disease (where experimental studies cannot be made). However, their main limitation is referred to the comparability of the groups under study, i.e., determination of whether the two groups being compared (exposed versus non-exposed) are interchangeable.
We can illustrate this with an example. Suppose that our hypothesis is that the administration of adequate antibiotic treatment prior to admission to the ICU of septic shock patients reduces in-hospital mortality. Our sampling population would be the patients admitted under conditions of septic shock, separating them into individuals that receive adequate antibiotic treatment prior to admission to the ICU and individuals that receive such treatment once already admitted to the ICU. Follow-up is carried out for some months and we finally compare the in-hospital mortality in the two groups. The main defect of the study is that we do not know whether the group of patients treated before admission to the ICU is identical to the group treated after admission to the ICU. In other words, is the fact of administering adequate antibiotic treatment prior to admission to the ICU influenced by some other variable we have not considered?
Among the cohort studies, and conditioned to the timing of inclusion, we can find fixed or dynamic cohorts. Depending on the selection of the cohorts, the latter can involve internal or external comparisons and, according to the start of the study, they may be prospective or retrospective. A retrospective cohort does not mean that the chronological orientation is from the time of appearance of the Event to the study of the Factor (E>F), but that the information is retrieved from the past and not from the present time.1
Case-control studiesCase-control studies involve a non-experimental analytical epidemiological design, i.e., they are based on observation, and a priori are more efficient in verifying or contrasting hypotheses. In studies of this kind we start with the effect or event, and we seek to study its antecedents. Two groups of patients are selected for this purpose, called cases and controls, according to whether the effect (disease, death or other) appears or not. The groups are compared for previous exposures or characteristics to determine whether they are associated to the study effect or not. Therefore, the most common chronology of the observation is that which takes the previous exposures or characteristics into account, and from there we try to determine whether they are associated to the effect under study or not. For this reason the case-control design goes not allow us to calculate the incidence or RR, except in infrequent situations.
In contrast, the measure of association used in these studies is the odds ratio (OR). This measure could be understood as the ratio between the proportion of patients with antecedents of exposure to the factor under study and the proportion without such previous exposure. In other words, if there is no association between exposure and effect, there will be no reason to believe that such exposure occurs differently between cases and controls, and the OR therefore would be equal to 1.
The main disadvantages of this type of design are its increased vulnerability to the presence of certain systematic errors or biases; the inability to detect weak associations between exposure and response; and the fact that it may prove difficult (and sometimes almost impossible) to validate the information obtained regarding exposure.
In practice, case-control studies are made because we have a series of cases and wish to analyze the predisposing factors that have generated those cases, based on comparison against a control population. What we must remember is that both the cases and the controls must come from one same original cohort; if this is not the case, i.e., if the cases and controls represent different populations, we run into what is known as Berkson's bias.2
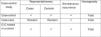
The term “control” is used in experimental epidemiology in reference to the group that receives the conventional treatment or placebo, though it must be remembered that case-control studies are of an observational nature and should not be confused with clinical trials or interventional studies (Fig. 2).
An illustrative example would be a series of critical patients with nosocomial infection caused by an infrequent organism such as Klebsiella pneumoniae carbapenemase (KPC) producing bacteria, in which we wish to study the risk factors associated to the infection. What controls would we use?
- a.
Any patient in the ICU without nosocomial infection
- b.
Patients with nosocomial infection caused by other organisms
- c.
Patients of the same age range and gender
The correct answer would be any patient in the ICU, since any patient in the hospital would be susceptible to nosocomial infection but has not developed such an infection. Both the cases and controls come from the same original cohort, i.e., patients admitted to the ICU.
Case-control studies nested in a cohortAfter our brief description of cohort studies and case-control studies, it should be mentioned that case-control studies nested in a cohort (nested case-control studies) belong to what is commonly referred to as “hybrid” studies, since they possess features of both cohort studies and case-control studies, though obviating some of their limitations.
The first known hybrid study was published in 1962 and analyzed the relationship between in utero exposure to X-rays and the subsequent risk of cancer.3 Nested studies analyze all the cases appearing in a stable cohort followed-up on over time, and the controls consist of a sample of subjects from that same cohort. Investigators commonly have a cohort they have been studying and following-up on for a certain period of time, with the compilation of different types of data and the filing of imaging studies and/or samples, with the purpose of conducting a future study when the patients are seen to produce unexpected responses. In other words, we have information on possible exposure, and when the response occurs we already have data with which to work and explore possible causal relationships.
This means that we are monitoring a dynamic population (that in which stability of the entry and exit of individuals is assumed) to detect all the cases of the target disease. These cases in turn are compared with a reference group (not necessarily controls as understood up until to now) that has been selected on a random basis or by pairing of the same population from which the cases originate.4
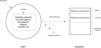
In general terms, we can distinguish two types of nested studies: simple nested studies and those that use density of incidence. Both types may be either prospective or retrospective. In the first case the response is infrequent, and an initial measurement of exposure is sufficient. The investigator first identifies all the participants of the cohort that exhibit the response at the end of follow-up (cases), and then establishes a random sample of those who have not exhibited the response (controls). The investigator then analyzes the predictive variables in both groups and compares the levels or categories of the risk factor in the cases against the controls. In studies involving density of incidence, follow-up may be variable, or exposure may vary over time. These are therefore dynamic cohorts, and sampling of the controls is made by density of incidence and pairing; we therefore need to wait for all the cases to have been generated in order to select the reference population. Here measurement at a single point is not enough and we must consider that the controls need to be selected as individuals belonging to the same cohort and exposed in the same way as the cases, i.e., individuals at risk, but who have not yet shown the response. In this design, since the controls are patients from the initial cohort, we lose statistical precision – though this fact is partly compensated by the decrease in the number of subjects studied, by the lesser cost of data compilation, and by a usually shorter duration of follow-up (Fig. 3).
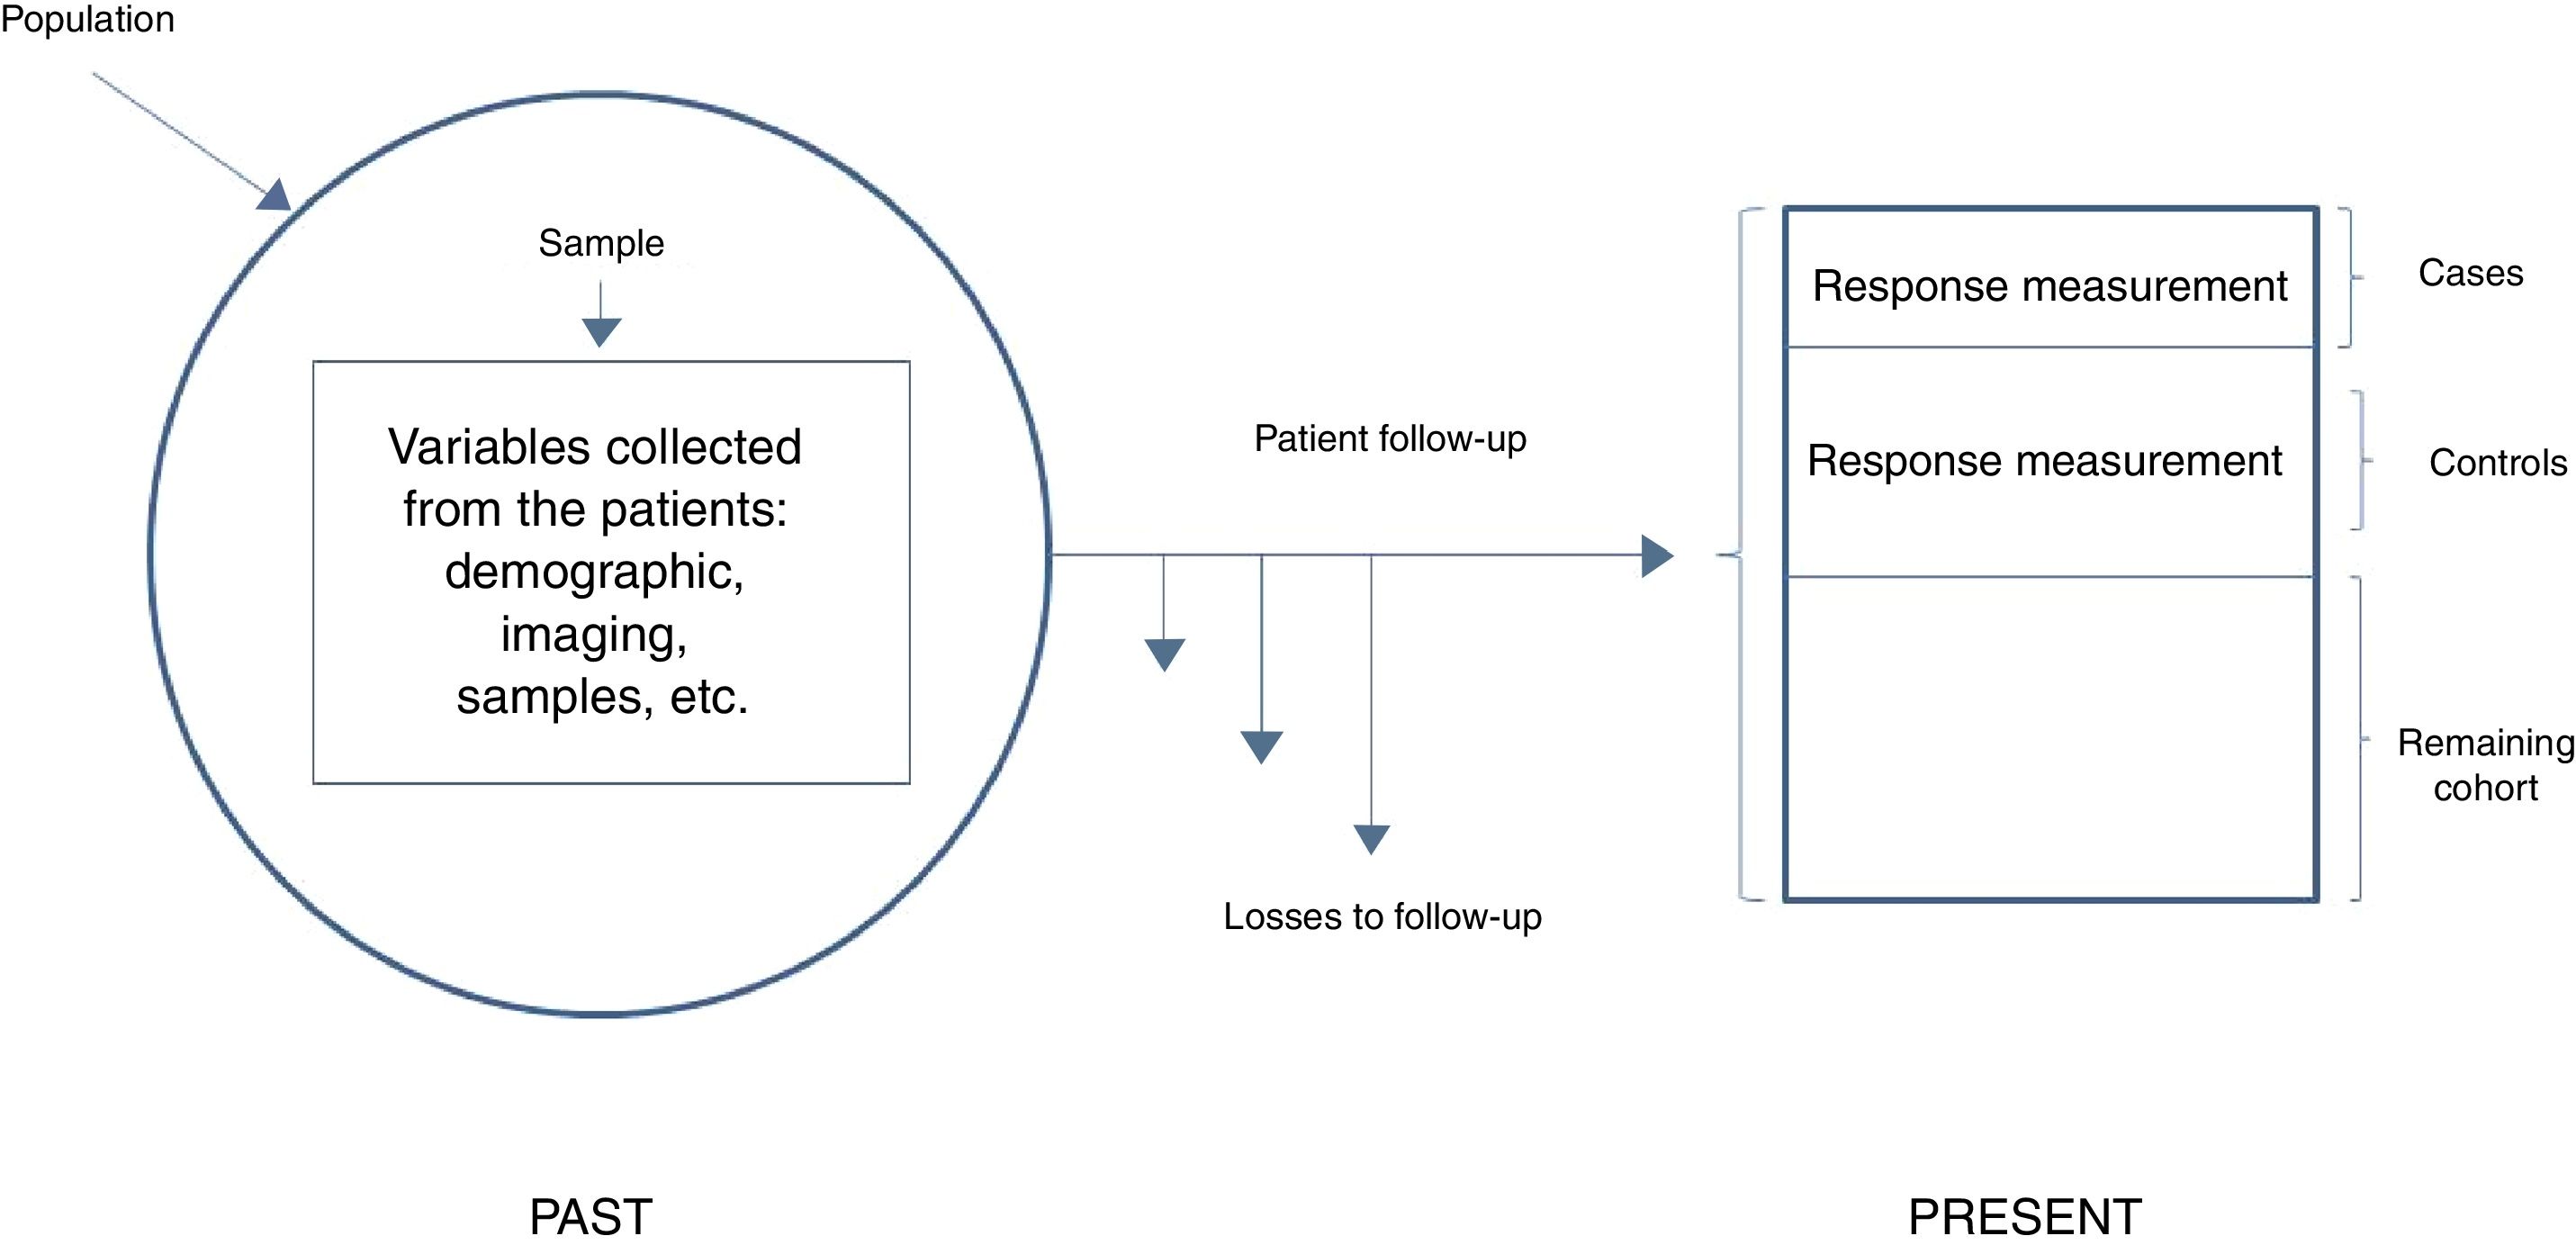
Simple nested case-control study.
Adapted from Hulley,5 2014.
In nested case-control studies the information referred to the risk factors of interest and the principal variables have been compiled at the start of follow-up on a prospective basis and before the disease develops; as a result, there is a lesser risk of incurring in the classical information bias of case-control studies, which are of a retrospective nature.
We start from a large initial cohort which – as has been commented – is often available from previous studies. This cohort is used to generate a case-control design in order to reduce the number of subjects in which independent variables or covariables need to be managed (instead of having to consider those of the entire cohort for the statistical analysis). Case selection is immediate, since these are our patients. We first need to identify them, assuming a case definition as homogeneous as possible. The only particularity here is that we collect all the cases during a given period and in a defined population. Furthermore, since the incidence of most diseases studied is relatively low, it is of interest to select all the cases appearing in the cohort – though any other sampling fraction could be used.
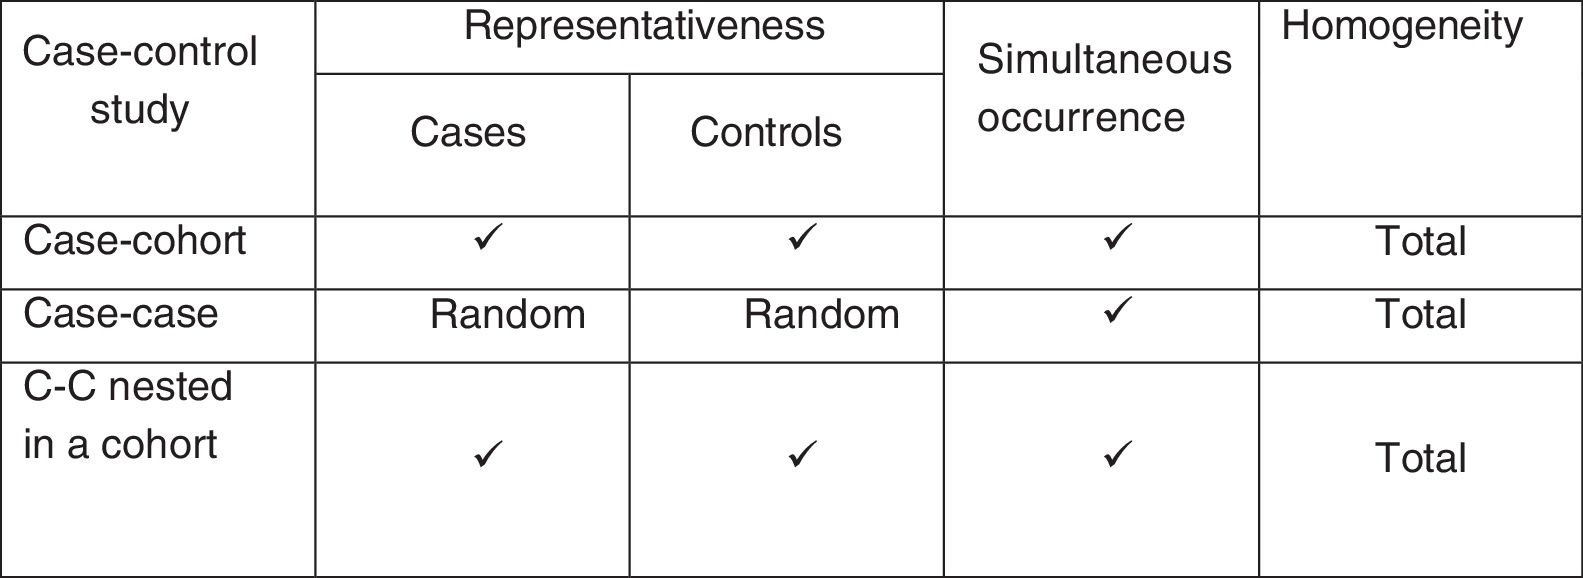
In fact, according to the sampling method used based on the individual patients of the initial cohort and yielding two groups, we will have different types of nested designs: case-control studies nested in a cohort, and cohort and case studies. In the case of nested case-control studies, we use a sampling scheme known as risk group sampling, since the selection of an individual as a control depends on this individual being at risk, i.e., he or she must be a member of the cohort at the time when the case is selected or identified. The cases and the global individuals at risk that do not develop the event constitute the risk group.
Selection of controlsWith regard to the selection of controls in these nested studies, the method described in the case of classical case-control studies proves acceptable. It is advisable to pair them considering confounding and time-dependent variables such as for example the years the cases have been included in the cohort. In this way one same individual can serve as control several times and become a case at some other time – a fact that must be considered in the statistical analysis of the study. Furthermore, pairing for time-dependent variables limits the analysis of such variables in the hybrid nested designs, though if exposure is time-dependent, these studies do not have to compile information beyond the time of case selection.
Although one control is usually selected per case, if the study sample size is limited we can select more than one control per case with a view to boosting the statistical power of the study, provided the proportion of 4:1 (four controls for every case) is not exceeded.
Pairing is a method that is relatively simple to understand and offers some important advantages, including the capacity to balance cases and controls in the stratum of the variable for which they are paired. In this way, if pairing is perfect (in the case of dichotomic or quantitative variables where the same threshold is used for pairing), the control of confounding influences is almost total. Furthermore, pairing allows us to detect interactions between exposure and the factor used for pairing. In contrast, pairing also has some limitations, including the fact that this is a time-consuming method, and it is essential to apply specific statistical tests for paired data. The complexity of the analysis increases as a result and is almost never accompanied by a parallel increase in the precision of estimation of the parameters. Moreover, if the variable used for pairing is not a confounding variable, the final estimation will be imprecise. In addition to these inconveniences, the development of multivariate regression models has relegated pairing as a system for the control of confounders.
Measures of association in nested case-control studiesIn contrast to the classical case-control studies, in nested studies, since the cases are identified a priori and are recorded as the study response or disease manifests, the incidence measured as density can be calculated without problems, and this will allow us to estimate relative risks. This is an important difference with respect to the conventional case-control studies in which the OR is usually calculated as measure of association, since the OR can only be similar to RR when the prevalence of the effect is very low. Accordingly, the difference between OR and RR increases as the incidence of the disease under study increases.6,7
As an example, if we wish to study nosocomial infection in the ICU – a frequent problem with a prevalence according to the local epidemiology of over 20% – the nested design would not be the most appropriate strategy for studying the risk factors underlying such infection, due to the strong distortion between OR and RR – though it could be used to study the prolongation of stay attributable to nosocomial infection.
These characteristics must be taken into account in the analysis, which proves somewhat more complex, though with the advantage that the OR is always a statistically non-biased estimator of the risk ratio. Furthermore, these studies are very efficient in analyzing a risk factor or for controlling a confounding factor if the necessary information for the entire cohort is not available or, if such information is available, obtaining it proves very expensive – as when having to perform measurements in biological samples, for example.
In order to carry out a nested case-control study, we first define the initial cohort of patients to be studied and establish the risk period. This is followed by identification of the cases, including the appearance dates, and we then obtain a sample of controls paired to each of the cases. Lastly, we define and quantify the predictive variables. In using this type of selection it is clear that a subject initially identified as a control could develop the event of interest during follow-up and subsequently be selected as a case. In the presence of any selection bias, the fact that controls are subsequently selected as cases compensates such bias to a degree. In any case, this situation is not a source of error or bias, since in cohort studies one same individual can contribute both to the numerator and to the denominator, and this same situation is maintained in this type of strategy.
Practical application to research in intensive careThis type of design is recommended for studying infrequent diseases in dynamic cohorts in which the determination of exposure and its changes over time, in all the cohort members, would prove very costly.
Another situation in which this design is recommended is when costly determinations are required. An example could be its use in a key line of research in recent years, focused on the construction of predictive models allowing us to determine as early as possible the probability of developing certain syndromes or disorders directly related to a poor clinical outcome. This comprises the study of different diagnostic or prognostic biomarkers as risk indicators. Their use is becoming particularly relevant in the critical care setting, fundamentally due to the fact that they represent a scantly invasive way of determining patient susceptibility to certain events such as sepsis, or of knowing how their measurement at certain timepoints is correlated to clinical outcomes of great relevance, such as mortality in the ICU.8–10
A practical case of the application of this type of nested design in an ICU is the study of risk factors for readmission to the ICU following an initial stay among liver transplant patients, recently carried out by a Canadian group.11
In this study the authors used a case-control nested in a cohort of liver transplant patients design in which each case (i.e., each transplant patient requiring admission to the ICU) was randomly assigned a control forming part of the cohort. The cohort in this case was represented by all the transplant patients in the study period (7 years). As mentioned, this type of design is used for the study of scantly prevalent events.
Following analysis of the data, with statistical comparison of the cases (patients readmitted to the ICU) and controls (patients without the need for readmission to the ICU), the authors concluded that readmission to the ICU has a negative impact upon the clinical outcome of these patients, and they moreover specified which factors are related to such need for readmission.12
Another example of the use of this type of hybrid design could be the study of the consequences of mesenteric embolization following aortoiliac endovascular surgery. In this example, the authors selected the controls on a random basis but additionally paired them for age and gender.12
As a final comment, nested case-control studies are more similar to classical case-control studies than to cohort studies. The fundamental difference between them is that in the nested design sampling of the controls is usually performed by density of incidence and with pairing. These studies are more efficient, allow us to calculate the incidence of the disease, and have more internal validity as a consequence of the lesser presence of bias.
Analysis of competitive eventsIntroduction to competitive riskIn prospective evaluation studies, the outcome is obtained from the longitudinal evaluation of a cohort of subjects in a period of time until the phenomenon of interest occurs (referred to as the event). As an example, the event may be death, myocardial infarction or the recurrence of disease. The statistical analysis used for estimating these outcomes is known as analysis of time to event or – more commonly – analysis of survival. The most frequent method for estimating the probability of an event is the nonparametric approach, generally referred to as the Kaplan–Meier (KM) method.
The KM method analyzes the subjects that experience the event in a certain period of time, and the subjects who do not experience the event and do not complete follow-up are referred to as censored cases, since they do not present the event of interest. It is not infrequent for a participant in a study to experience more than one type of event during follow-up. A situation of competitive risk (CR) is observed when the appearance of a type of event modifies the capacity to observe the event of interest of the study.
A clear example of this is when the event to be studied is patient survival after heart valve replacement surgery as treatment for infectious endocarditis. In this case the CR is the suffering of stroke during admission, since such patients cannot be subjected to surgery.
There are many examples in the literature of the use of these CR techniques,8,13–15 though the main issue for the investigator is to decide whether or not to take CR into account. If CR is not taken into account, the analysis is limited to the usual time to event analysis. However, this approach overestimates the true probability.16–20 The magnitude of the overestimation is what should cause us to decide whether to take CR into account or not.
Returning to the previous example, the mortality rate after heart surgery for the treatment of endocarditis is 40%, but 25% of the patients have neurological complications before surgery – thus indicating that the estimate may be very different from what is actually observed.
Calculation of the cumulative incidence functionWhen encountering data with CR, it is essential to estimate the absolute risk of occurrence of an event of interest to a timepoint t over follow-up. This risk is calculated by the cumulative incidence function (CIF), which is defined for each type of event separately and increases over time. The CIF of an event at timepoint t is defined as the probability that an event of this type will occur at any time between baseline and timepoint t. If the data do not include censored individuals, the CIF at timepoint t can be estimated as the proportion of subjects that experience this type of event until timepoint t divided by the total number of subjects in the global body of data. As time progresses, the CIF increases from zero to the total proportion of events of this type in the data.
Modeling and effect of the covariablesCox proportional hazard models are used to assess the effect of the covariables and an event of interest in the absence of CR.21 Such models are difficult to interpret in the presence of CR, however.
A number of regression models have been proposed in CIF – the most popular being the model of Fine and Gray,22 which has also been incorporated to the main statistical packages, including R, STATA and SAS.23,24 The resulting effect measure for each covariable is called the subdistribution hazard ratio (sHR). While the numerical interpretation of sHR is not direct, sHR=1 means that there is no association between the covariable and the corresponding CIF; sHR>1 means that an increase in the value of the covariable is associated to increased risk; and sHR<1 implies the opposite. Moreover, the further sHR is from 1, the greater the estimated effect size in CIF. The assumption of risk proportionality over follow-up remains a requirement.
Key aspects- 1.
Competitive risk occurs when during the observation period for a specific event of interest other events may occur that can modify the occurrence of that event. In a more general sense, CR methods can be used if different types of events are studied and we focus on the time and type of the first event.
- 2.
The basic descriptive statistics of the CR data comprise the CIF, which describes the absolute risk of an event of interest over time. The KM method should not be used in the presence of competing events, since it overestimates the true absolute risk.
- 3.
A complication of CR is that the covariables can affect the absolute risk and the event rate differently. Regression models based on CR (e.g., Fine–Gray models) explore the association between the covariables and absolute risk, and are therefore essential for medical decision making and for prognostic research questions. On the other hand, specific event rate models (e.g., specific Cox proportional hazard models) are to be preferred for answering etiological research questions.
- 4.
A full description of the CR data should include modeling of all the types of events and not only the main event of interest.
- 5.
The CR models can evaluate the effect of an intervention upon the individual components of a composite assessment criterion.
Recursive partitioning is a type of multivariate analysis used to produce classification algorithms. These algorithms were first published in 1963,25 and in turn gave rise to other algorithms over the years.26 The most widely used in the field of health was introduced by Breiman et al. in 1984.27 With these tools we can classify observations and develop prediction systems based on a series of decision rules.
These algorithms are useful when the studied event has numerous predictor variables with complex relationships among them, and are widely used in bioinformatics and in genetic studies.28
Construction of a classification treeClassification and regression trees are a nonparametric procedure for the prediction of a dependent variable or response on the basis of a series of independent variables or predictors. The response may be of a categorical nature.
The tree is constructed through the recurrent division of data. This division of the population seeks to produce subpopulations that are homogeneous with respect to the dependent variable. These partitions are successively repeated until the degree of homogeneity cannot be further incremented through another partition.29 The choice of variable for performing the partition is always based on a criterion of homogeneity of the subpopulations resulting from the partition. Complete homogeneity of the nodes is rarely achieved, but there are functions that determine the degree of impurity as a measure of the degree of homogeneity of the nodes.
The Gini index is one of the functions most commonly used to measure the homogeneity of a node in classification trees. For an outcome variable with “c” different classes, the impurity of a node g is defined as follows:
where pj is the proportion of individuals in class j in node g. We can see this better with a practical example.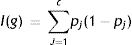
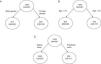
If we are talking about total mortality in a series of patients with infectious endocarditis,30 we have three variables that can serve to classify patient mortality, namely age, gender and the type of affected valve (native/prosthetic). The total mortality rate of the cohort is 29.8% (401/1345). The mortality rate as per male gender is 29%, that of patients over 70 years of age is 41%, and that of patients with endocarditis over a prosthetic valve is 40%.
If we divide the initial node as represented in A and the impurity of each node is:
I (initial)=0.70×(1–0.70)+0.30×(1–0.30)=0.42
I (masculine)=0.71×(1–0.71)+0.29×(1–0.29)=0.410
I (feminine)=0.68×(1–0.68)+0.32×(1–0.32)=0.435the decrease in impurity of this partition is given by:
ΔI=1345×I (initial)−(911×I [masculine]+434×I[feminine])=0.87
Continuing with the other two examples (Fig. 4B and C), the reduction in impurity is:
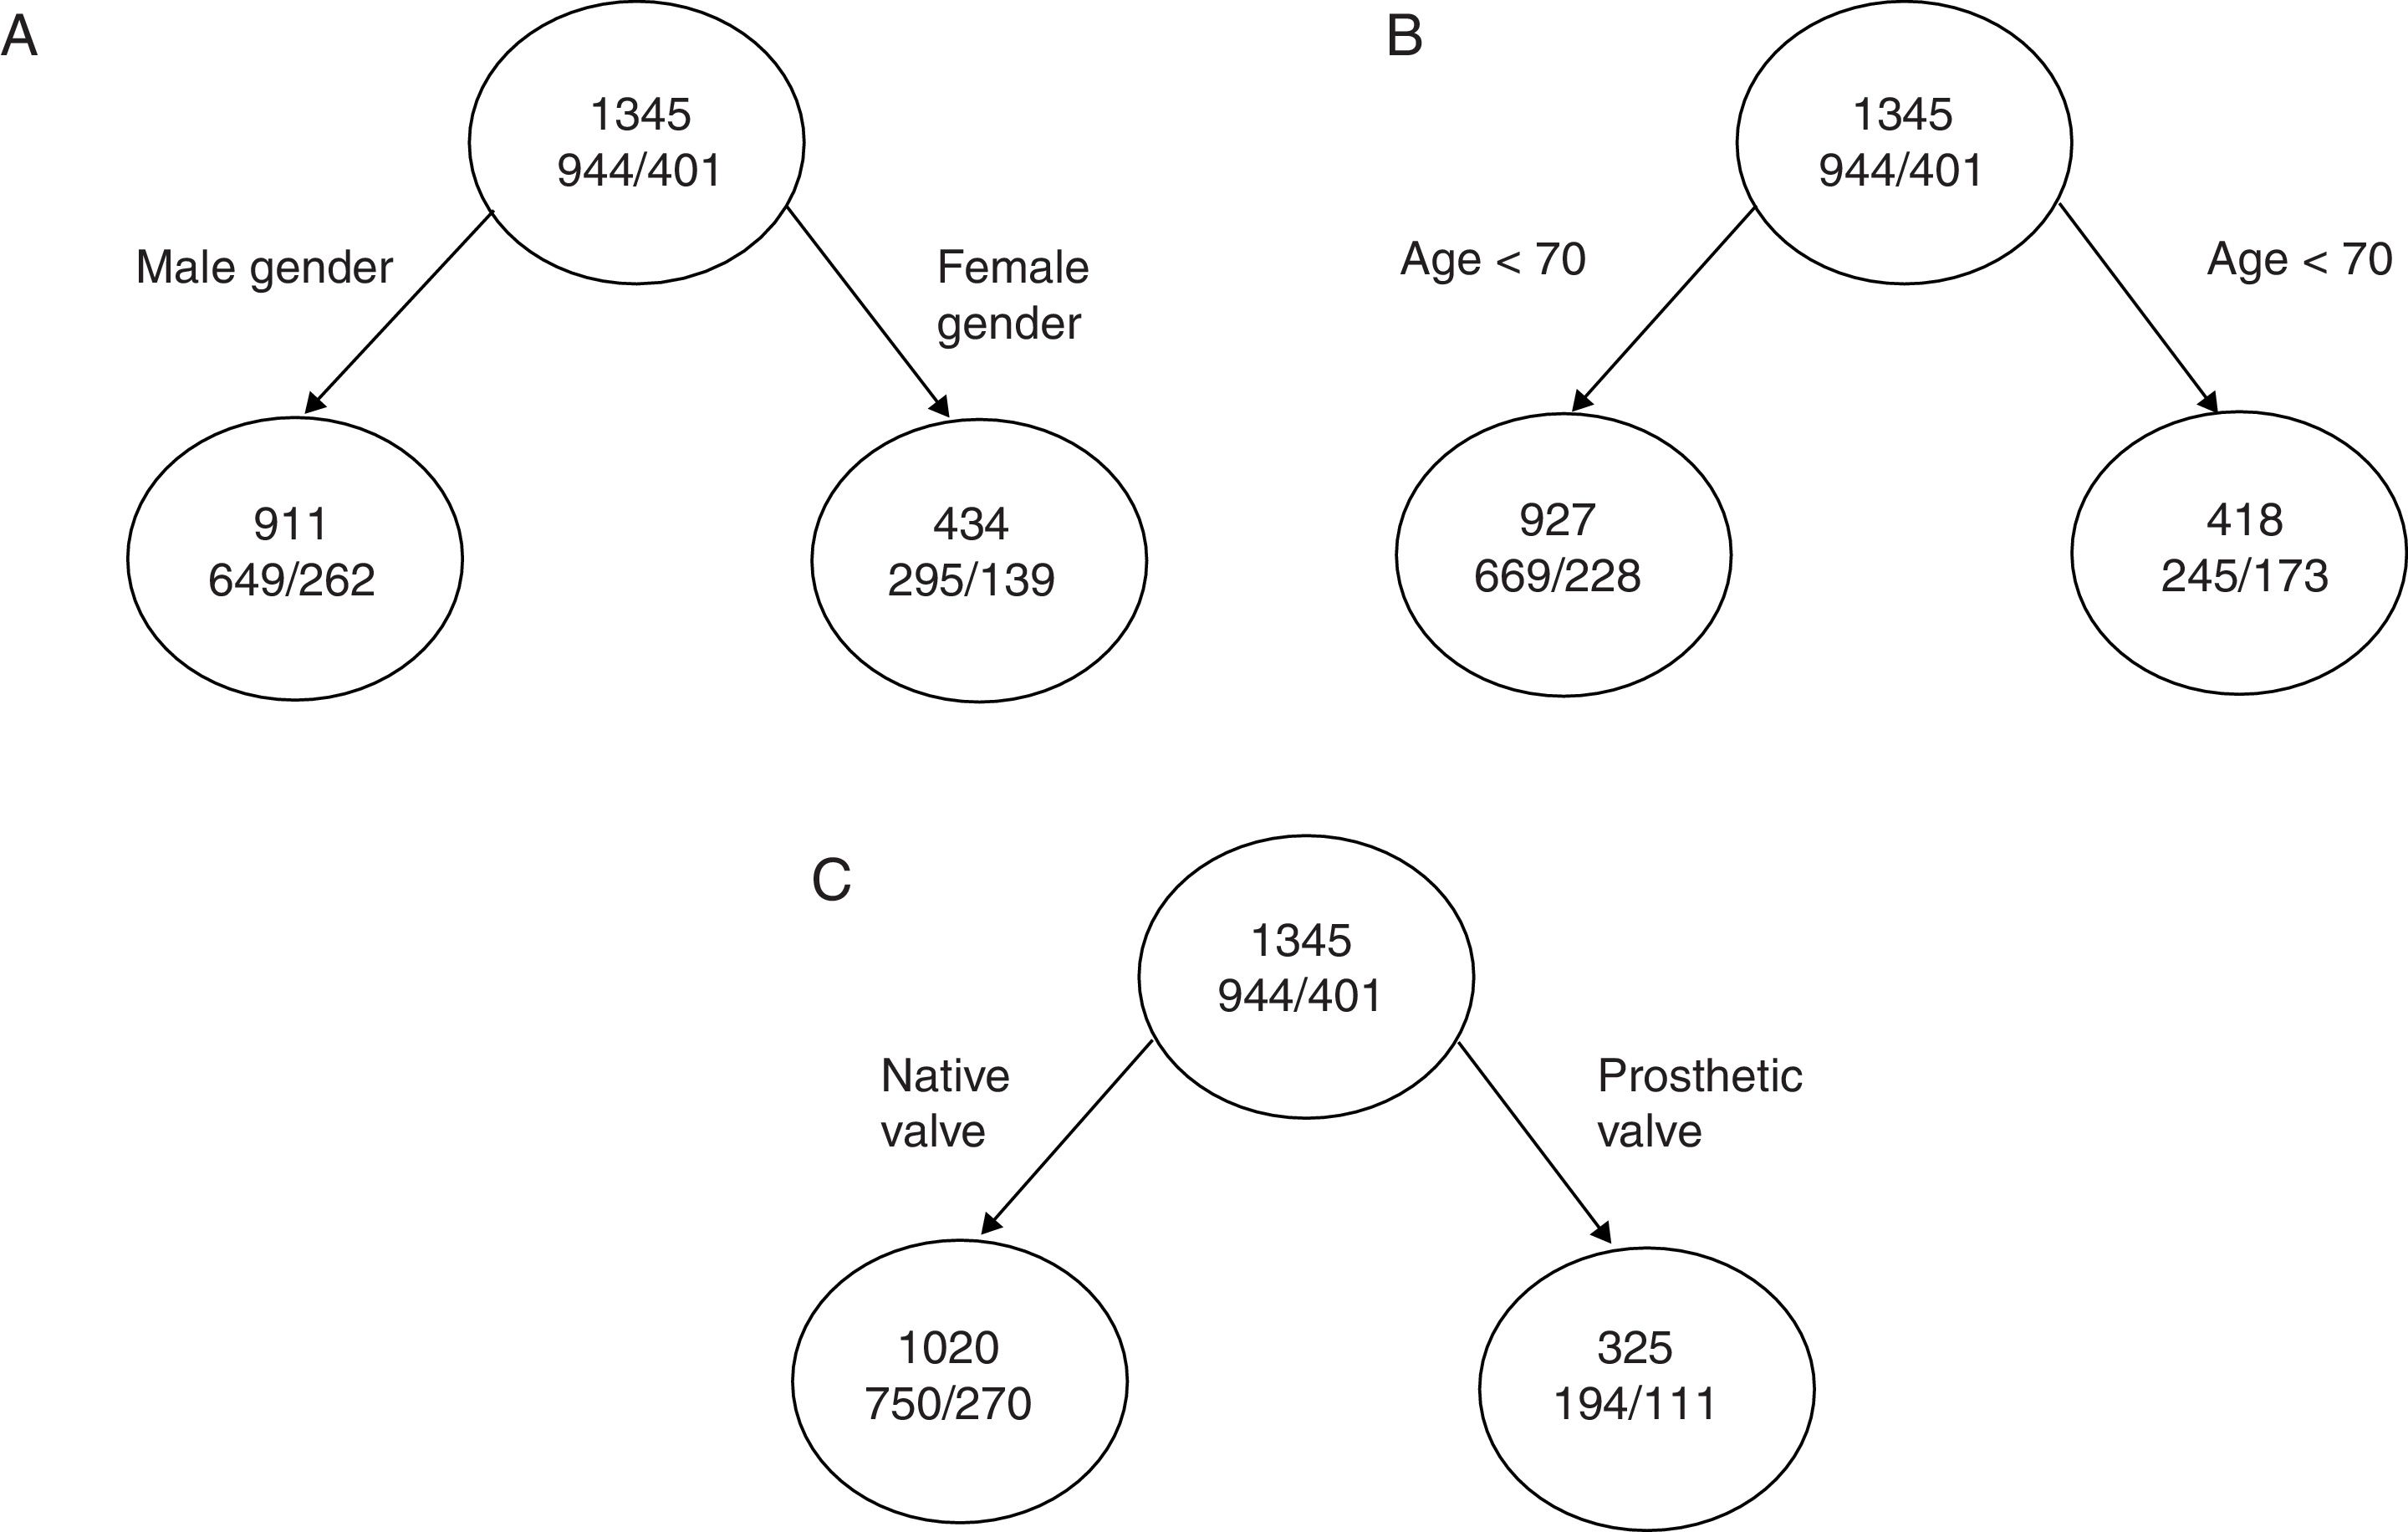
ΔI (age)=1.98ΔI (valve)=14.55
We can see that with similar percentage mortality rates, dividing the tree by the variable corresponding to the type of valve affected results in far greater reduction of impurity, with an increase in classification capacity.
Number of nodesOne of the most important issues is determining the final number of partitions of a tree or, in other words, determining the size of the tree. If the division process ends too soon, we will not have obtained the full classification capacity of the tree – i.e., under-adjustment occurs. In contrast, if we perform too many divisions, we run the risk of classifying random particularities of the data – a situation known as over-adjustment.
In order to secure the correct size of the tree (what is known as an honest tree), we must model the sample in several attempts to reach this optimum point.
Advantages and disadvantages with respect to other multivariate modelsAdvantages- –
Clinically more intuitive models are generated.31
- –
The order of the classification can be varied to create decision rules of greater sensitivity and specificity,32 since we can identify nonlinear relationships with the dependent variables.
- –
Precision may be incremented, and the approach is particularly useful in identifying interactions that can be entered in multivariate models.33
- –
Not applicable to continuous variables that would have to be dichotomized. Nevertheless, we can select the most adequate cut-off point as alternative to the receiver operating characteristic (ROC) curves.34
- –
Data over-adjustment.
The authors declare that they have no conflicts of interest.
Please cite this article as: Gutiérrez-Pizarraya A, García-Cabrera E, Álvarez-Márquez E. Métodos estadísticos alternativos y su aplicación a la investigación en Cuidados Intensivos. Med Intensiva. 2018;42:490–499.