


To analyze the nutritional management practices in Intensive Care (ICU) to detect the need for improvement actions. Re-evaluate the process after implementation of improvement actions.
DesignProspective observational study in 3 phases: (1) observation; (2) analysis, proposal development and dissemination; (3) analysis of the implementation.
SettingICU of a hospital of high complexity.
ParticipantsAdult ICU forecast more than 48h of artificial nutrition.
Primary endpointsParenteral nutrition (PN), enteral nutrition (EN) (type, average effective volume, complications) and average nutritional ratio.
ResultsA total of 229 patients (phase 1: 110, phase 3: 119), after analyzing the initial results, were proposed: increased use and precocity of EN, increased protein intake, nutritional monitoring effectiveness and increased supplementary indication NP. The measures were broadcast at specific meetings. During phase 3 more patients received EN (55.5 vs. 78.2%, P=.001), with no significant difference in the start time (1.66 vs. 2.33 days), duration (6.82 vs. 10.12 days) or complications (37.7 vs. 47.3%). Use of hyperproteic diets was higher in phase 3 (0 vs. 13.01%, P<.05). The use of NP was similar (48.2 vs. 48.7%) with a tendency to a later onset in phase 3 (1.25±1.25 vs. 2.45±3.22 days). There were no significant differences in the average nutritional ratio (0.56±0.28 vs. 0.61±0.27, P=.56).
ConclusionsThe use of EN and the protein intake increased, without appreciating effects on other improvement measures. Other methods appear to be necessary for the proper implementation of improvement measures.
Analizar las prácticas de tratamiento nutricional en un Servicio de Medicina Intensiva (SMI) para detectar la necesidad de acciones de mejora. Reevaluar el proceso tras la implementación de las acciones de mejora.
DiseñoEstudio observacional prospectivo en 3 fases: 1) observación; 2) análisis, elaboración de propuestas y su difusión; 3) análisis de la implantación.
ÁmbitoSMI de un hospital de alta complejidad.
ParticipantesAdultos en UCI con previsión de nutrición artificial de más de 48 h.
Variables de interés principalesNutrición parenteral (NP), nutrición enteral (NE) (tipo, volumen eficaz medio, complicaciones) y ratio nutricional media.
ResultadosParticiparon 229 pacientes (fase 1: 110; fase 3: 119). Tras el análisis de los resultados, se propusieron: incremento en uso y precocidad de NE, incremento en aporte proteico, monitorización de la eficacia nutricional y mayor indicación de NP complementaria. Las medidas fueron difundidas en reuniones específicas. Durante la fase 3 hubo más pacientes con NE (55,5 vs. 78,2%; p=0,001), sin diferencia significativa en el tiempo de inicio de NE (1,66 vs. 2,33 días), duración (6,82 vs. 10,12 días) o complicaciones (37,7 vs. 47,3%).
La utilización de dietas hiperproteicas fue mayor en la fase 3 (0 vs. 13,01%; p<0,05). El empleo de NP fue similar (48,2 vs. 48,7%) con tendencia al inicio más tardío en la fase 3 (1,25±1,25 vs. 2,45±3,22 días; p=NS). No hubo diferencias significativas en la ratio nutricional media (0,56±0,28 vs. 0,61±0,27; p=0,56).
ConclusionesSe incrementó la utilización de la NE y el aporte proteico sin apreciarse efectos sobre el resto de las medidas propuestas. Otros métodos parecen ser necesarios para la adecuada implantación de medidas de mejora.
Artificial nutrition forms part of the management of critically ill patients that cannot receive an oral diet. The benefits of artificial nutrition go beyond the provision of nutrients and can modify host response to aggression and patient outcome.1 Many studies have shown denutrition in critical patients to be associated to an increase in infectious complications and a longer stay in the Intensive Care Unit (ICU).2,3 Consequently, one of the quality indicators in the management of critical patients is the early start of nutritional support.
Different recommendations and clinical practice guides on the metabolic and nutritional management of critical patients have been published both in Spain1 and in other countries.4–6 Although the methodology followed by the different recommendations is similar, the conclusions drawn sometimes differ depending on how the same available scientific evidence is interpreted. In this regard, one of the issues subject to debate refers to the early start of nutritional treatment or the use of pharmaconutrients.7 This requires the physician in charge of prescribing nutritional support in critical patients to decide which recommendation is best suited to each individual patient.
In the context of routine clinical practice, a number of studies have shown that it is difficult to reach the caloric targets in the first few days of admission to the ICU. Indeed, in most cases it is not possible to exceed 60% of the prescribed daily energy intake.6,8 The concomitant administration of parenteral nutrition (PN) is therefore recommended as a complement to enteral nutrition (EN) when the caloric target is not reached by day four of admission or during two consecutive days.1 Nevertheless, the early introduction of PN is also subject to debate, with contradictory recommendations being found in the different guides.4,5
The present study analyzes the nutritional treatment practices in the Department of Intensive Care Medicine (DICM) of a high-complexity hospital center with the purpose of identifying weak points and adopting measures for improvement based on the existing recommendations.
Patients and methodsA three-phase prospective observational study was carried out. The first phase involved monitoring of compliance with nutrition practices according to the nutritional support protocol used in the DICM. This protocol is based on the recommendations of the SEMICYUC-SENPE,1 and is periodically revised in order to adapt it to the existing scientific evidence and the type of patient involved. The nutrition protocol was not modified during this phase of the study.
The second phase involved an analysis of the data obtained, with the definition of proposals for improvement and their distribution within the ICUs.
The third phase in turn consisted of a new monitoring period, with assessment of the nutritional practices, in order to analyze compliance with the changes proposed in the previous study phase.
Two ICUs of the DICM participated in the study: a Unit specialized in trauma and emergency care, and a polyvalent Unit. We included adult critical patients with indications of nutritional support (artificial nutrition upon admission, or expected impossibility of oral feeding during the first three days of admission). Patients who did not receive nutritional treatment were excluded.
Data collection was carried out by an observer who did not participate in the clinical decisions (NLM). The following data were collected for all included patients: age, weight, height, reason for admission, stay in the ICU, condition at discharge, mechanical ventilation (duration), PN (start, type, duration, metabolic complications), EN (type, duration, mean effective volume [ratio of administered diet/calculated diet], complications, cause of suspension), oral diet, nutritional requirements (calculated using the Harris–Benedict equation corrected for stress) and mean nutritional ratio (proportion of calories administered in relation to the daily requirements). Calculation of the kcal supplied per day was based on the sum of the energy provided by EN, PN and other lipid infusions (propofol). Daily assessment was also made of whether the indications of nutritional support complied with the nutrition protocol (nutrient administration route, calorie supply, definition and management of complications related to EN). These data were collected from the time of inclusion in the study until patient discharge from the Unit.
The complications associated to EN were considered based on the critical patient nutritional intervention algorithms9: increase in gastric residue, abdominal distension, diarrhea, constipation, nausea and vomiting-regurgitation. An increase in gastric residue was defined as the presence of a volume of over 500ml obtained at each evaluation of residue. Abdominal distension was assessed on the basis of changes in the abdominal exploration, with the presence of tympanism, and with or without the presence of peristaltic sounds. Diarrhea associated to EN in turn was defined as a number of depositions of 5 or more in a period of 24h, or as at least two depositions, each with an estimated volume of 1000ml, over a period of 24h. Constipation was defined as the absence of depositions during four days from the start of EN, or the absence of depositions during three consecutive days from the second week of EN. Lastly, regurgitation was defined as the presence of diet material in the oropharyngeal cavity, detected at exploration of the oral cavity or in the course of patient oral hygiene care.
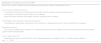
The first study phase covered a period of 2 months (from 1 February 2010 to 31 March 2010). The results obtained were analyzed internally by two of the investigators (CGF, JMG), and a number of measures for improvement were proposed based on the recommendations of the scientific societies.1,6 The proposed measures were presented by both investigators to the healthcare personnel (physicians, nurses and nursing assistants) of each Unit in specific sessions, in which the results of the observation period (phase 1) were commented. Two sessions were held per Unit. The measures were decided by consensus and consisted of the following: increase in the percentage of patients receiving EN, restriction of diets enriched with pharmaconutrients (arginine, omega-3 fatty acids, docosahexaenoic acid [DHA], nucleotides, glutamine) after the first week of admission, increase in protein supply with EN (administration of hyperproteic diets), the convenience of daily monitoring of the nutritional ratio, and the use of complementary PN conditioned to the mentioned ratio (Table 1).
Proposed measures for improvement.
| Modification of the nutrition practices in the DICM |
|---|
| Increase in use of EN. Consider preferential indication of EN in patients without contraindications to EN |
| Diets enriched with pharmaconutrients |
| Use restricted to the first week of admission (which usually coincides the phase of greatest metabolic stress) |
| Assess longer use in patients with persistently severe conditions |
| Select diet enriched with fish oil for patients with acute respiratory distress syndrome |
| “Chronic phase” diets (from the second week of admission) |
| Use preferably in stable patients after the first week of admission. A hyperproteic diet with a mixture of dietetic fiber is proposed |
| Nutritional monitoring |
| The case history should reflect (comments on evolution/nursing chart) the calories supplied each day and the administered calories/calculated required calories (nutritional ratio) |
| Use of complementary PN |
| Suggestions: prescribe if no more than 60% of the calculated requirements are supplied by day 4 of enteral nutrition (nutritional ratio<60%) |
The third phase again comprised a 2-month data collection period in the same Units. In order to determine whether the proposed measures had been adequately put into effect in routine clinical practice, we decided to conduct the second observation period following a prolonged interval after the first phase, in order to avoid immediacy effects in implementing the proposed measures (i.e., changes made in the first few months after the sessions of the second phase of the study). Accordingly, data collection was performed from 1 February 2011 to 31 March 2011 in the trauma and emergency care Unit, and from 15 September 2011 to 25 December 2011 in the polyvalent Unit.
The results were analyzed using the IBM SPSS® version 19 statistical package. Quantitative variables exhibiting a normal distribution were reported as the mean±standard deviation (SD), while qualitative variables were reported as absolute (numbers) or relative frequencies (percentages). Comparisons were made using the Student t-test in the case of quantitative variables exhibiting a normal distribution and homogeneous variance. The Pearson chi-squared test in turn was used to compare qualitative variables. Statistical significance was considered for p<0.05.
Since this was an observational, non-interventional and anonymized study, informed consent for data collection was not considered necessary. The study was approved by the Clinical Research Ethics Committee of the hospital.
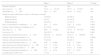
ResultsIn the first phase of the study, a total of 162 patients were admitted to both Units. Of these, 110 were included in the study: 34 patients in the trauma and emergency care Unit (66 admissions) and 76 patients in the polyvalent Unit (96 admissions). In the third phase of the study a total of 215 patients were admitted to both Units. Of these, 119 were included in the study: 20 patients in the trauma and emergency care Unit (75 admissions) and 99 patients in the polyvalent Unit (140 admissions).
Table 2 shows the characteristics of the patients. The distribution by diseases differed between the two data collection phases, with a larger number of polytraumatized patients in the third phase. The patients in the third phase presented a higher frequency (and a longer duration) of mechanical ventilation. The duration of stay in the ICU and the mortality rate were also higher in this phase. Nevertheless, the severity level upon admission, as assessed by the APACHE II score, was similar in both phases.
Characteristics of the patients and of the nutritional treatment.
| Phase 1 | Phase 3 | P-value | |
|---|---|---|---|
| Patients included | 110 | 119 | |
| Age (years) (x±SD) | 52.10±16.128 | 55.03±15.874 | NS |
| APACHE II (x±SD) | 18.0±10.0 | 18.36±9.94 | NS |
| Diagnoses upon admission (n and % with respect to total) | |||
| Medical disease | 75 (68.2) | 79 (66.4) | NS |
| Surgical disease | 9 (8.2) | 23 (19.2) | NS |
| Polytraumatisms | 26 (23.6) | 17 (14.3) | 0.017 |
| Days on mechanical ventilation (x±SD) | 4.97±5.974 | 7.85±8.278 | 0.005 |
| Patients with mechanical ventilation n (%) | 81 (73.6) | 110 (92.4) | 0.001 |
| Stay (days) (x±SD) | 6.89±7.4282 | 10.74±10.1723 | 0.005 |
| Survival n (%) | 102 (92.7) | 94 (79.0) | 0.003 |
| Nutritional requirements (kcal) (x±SD) | 1891.58±341.631 | 2127.17±368.943 | NS |
| Patients with enteral nutrition n (%) | 61 (55.5) | 93 (78.2) | 0.0001 |
| Patients with parenteral nutrition n (%) | 53 (48.2) | 58 (48.7) | NS |
| Start of enteral nutrition (days) (x±SD) | 1.66±0.998 | 2.33±2.050 | NS |
| Start of parenteral nutrition (days) (x±SD) | 1.25±1.254 | 2.45±3.224 | NS |
| Duration of enteral nutrition (x±SD) | 6.82±7.239 | 10.12±9.416 | NS |
| Duration of parenteral nutrition (x±SD) | 3.53±4.191 | 4.61±5.037 | NS |
| Complications of PN n (%) | 1 (1.9) | 1 (1.7) | NS |
The results of quantitative variables are expressed as the mean±standard deviation (x±SD). The results of qualitative variables are expressed as n and percentage.
Phase 2 corresponds to the educational period in which no data collection was carried out.
The significant results appear in boldface.
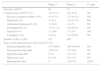
Compliance with the established nutrition protocol was optimum in both study phases, independently of the modifications introduced in the second phase. There were no alterations in the parameters analyzed: nutrient administration route, recommended energy supply, or definition and management of gastrointestinal complications of EN. The incidence of gastrointestinal complications related to EN was similar in both periods (Table 3). Two patients (one in each group) suffered metabolic complications probably related to EN (one case of hypertriglyceridemia and one case of hyperbilirubinemia), though no special treatment measures were required.
Characteristics of enteral nutrition (EN) in the study phases.
| Phase 1 | Phase 3 | P-value | |
|---|---|---|---|
| Patients with EN | 61 | 93 | |
| Complications of ENan (%) | 23 (37.7) | 44 (47.3) | NS |
| Increase in gastric residuean (%) | 9 (14.75) | 15 (16.13) | NS |
| Diarrheaan (%) | 5 (8.2) | 15 (16.13) | NS |
| Abdominal distensionan (%) | 3 (4.91) | 4 (4.3) | NS |
| Constipationan (%) | 13 (21.31) | 19 (20.43) | NS |
| Nauseaan (%) | 1 (1.64) | 1 (1.07) | NS |
| Vomitingan (%) | 5 (8.2) | 14 (15.05) | NS |
| Number of days of EN | 421 | 907 | |
| Type of diet administered to the patientsbn (%) | |||
| Pharmaconutrition diet | 272 (64.6) | 589 (64.94) | NS |
| Normoproteic fiber diet | 139 (33) | 173 (19) | NS |
| Hyperglycemia diet | 4 (1) | 11 (1.2) | NS |
| Oligomeric diet | 6 (1.4) | 16 (1.8) | NS |
| Hyperproteic diet | 0 | 118 (13) | <0.05 |
Phase 2 corresponds to the educational period in which no data collection was carried out.
In relation to monitoring of the measures for improvement, we noted an increase in the use of EN during the third phase of the study, in which 87.2% of the patients received EN versus 55.5% in the first phase (p<0.0001) (Table 2). Regarding the type of diet used, no decrease in the administration of diets enriched with pharmaconutrients was achieved (64.6% versus 64.9% of the days with EN) – though the use of hyperproteic diets effectively increased (Table 3).
The mean nutritional ratio (volume of administered diet/calculated diet) during the data collection periods of the study was 0.56±0.28 in the first phase and 0.61±0.27 in the third phase, with no significant differences between the two phases (p=0.56) (Figs. 1 and 2). Nevertheless, calculation of the nutritional ratio in clinical practice and its inclusion in the patient records (nursing charts or medical evolution comments) was merely anecdotal: in most cases no such calculations were entered in the records.
 of the mean nutritional ratio per day of admission in the first phase of the study. This figure shows the mean and SD of the mean nutritional ratio, i.e., the proportion of calories administered by artificial nutrition in relation to the requirements per day of admission.")
Mean and standard deviation (SD) of the mean nutritional ratio per day of admission in the first phase of the study. This figure shows the mean and SD of the mean nutritional ratio, i.e., the proportion of calories administered by artificial nutrition in relation to the requirements per day of admission.
 of the mean nutritional ratio per day of admission in the third phase of the study. This figure shows the mean and SD of the mean nutritional ratio, i.e., the proportion of calories administered by artificial nutrition in relation to the requirements per day of admission.")
Mean and standard deviation (SD) of the mean nutritional ratio per day of admission in the third phase of the study. This figure shows the mean and SD of the mean nutritional ratio, i.e., the proportion of calories administered by artificial nutrition in relation to the requirements per day of admission.
The use of PN−another of the proposed measures for improvement–was not seen to increase in the third study phase (Table 2).
DiscussionOur DICM has used an artificial nutrition protocol since 1996. The protocol is regularly updated to adapt it to the advances in knowledge, the recommendations of the scientific societies, and the work routines of the DICM. It is important to mention that all the healthcare personnel involved in the process (physicians, nurses and nursing assistants) intervene in the different versions of the protocol. As a result, the degree of implication in complying with the protocol is very high, as reflected by its correct application in the scenarios analyzed in our study.
With a well implemented artificial nutrition protocol, the purpose of our study was to assess the points amenable to improvement, with a view to updating the protocol. The results indicate that divulgating actions alone for presenting the measures for improvement are not enough to ensure that such measures are adequately incorporated to clinical practice. In effect, only two of the 5 proposed recommendations were correctly implemented: increased use of EN and increase administration of hyperproteic diets.
The preferential use of EN in patients who do not present contraindications to this form of nutrition is clearly accepted by the scientific community.1 Critical patients requiring mechanical ventilation also receive EN in most cases. This circumstance may have conditioned the increased use of EN recorded in the third phase of our study, since the patients in this phase presented a greater need for mechanical ventilation, and ventilation moreover lasted longer. These were also patients with a longer stay in the ICU and with greater mortality, compared with the first phase. Thus, the differences in the population of patients admitted might explain the change in the use of EN between the two study phases.
Some authors10 have analyzed the reasons why critical patients do not receive the amount of EN they need according to the calculated energy requirements. The mean nutritional ratio recorded in different studies in critical patients is between 50% and 90%. The reasons for this decrease in diet supply are diverse and include factors related to the patient disease condition, the type of nutritional catheter used, the timing of the start of EN, and interruptions in diet supply (due to the performance of tests, nursing procedures, surgery or complications of any kind). In the present study we likewise recorded an inadequate nutritional ratio in the context of EN in critical patients, though the study was not designed to analyze the reasons for this decrease in ratio.
Changes in nutritional practices designed to increase the effectiveness of nutritional treatment in critical patients have been evaluated by a number of authors. In a study of the implementation of a nutritional protocol in the ICU, Barr et al.11 compared different variables before and after introducing the protocol. The authors found the use of EN to be more frequent after introducing the protocol, with no changes in calorie supply by day four of nutritional support. The main difference between their study and our own is that the mentioned Unit had no previously implemented protocol, though the existing nutritional practices facilitated adoption of the protocol.
Other authors have published their experience with the introduction of changes in the nutritional management of critical patients. Jones et al.12 conducted a randomized clinical study to assess the adoption of 17 measures recommended to improve nutritional treatment in different DICMs divided into two groups: Departments with an educational program including the intervention of a nutritionist to facilitate access to and diffusion of the measures, and Departments in which the measures were simply distributed to each Unit. The results after a period of 12 months showed no differences in clinical evolution between the two groups, with the exception of blood glucose control in the intervention group. The factors complicating introduction of the changes in the nutritional process were related to the medical professional (reluctance to accept change, lack of knowledge and lack of experience), the clinical characteristics of the patient, the characteristics of the institution (limited resources, bureaucracy, care overload) and aspects related to the clinical practice guides (obsolete or limited evidence, and multiple or complicated recommendations). In turn, the factors facilitating introduction of the changes were their incorporation to routine practice, training, facility of access and application of the guides, as well as the adoption of reminder strategies (checklists, protocols, multidisciplinary sessions).
Cabana13 classified the obstacles facing adequate compliance with the clinical practice guides into 7 categories: lack of knowledge, lack of familiarity, lack of agreement, self-efficacy, expected benefit, motivation and external barriers.
Doig et al.14 defined 18 interventions grouped into categories for the implementation of measures designed to improve nutritional support. They identified a leader per Unit, conducted visits and meetings, included the role of the nutritionist, and produced algorithms and posters. The adoption of these measures resulted in statistically significant improvements in the provision of nutrition, but no associated changes in hospital mortality were recorded. In a study carried out in a Brazilian ICU, the introduction of a nutritional protocol following an educational program improved the quality of nutrition practice.15 Cheater et al.,16 in a systematic review of the interventions that can modify clinical practice, concluded that the efficacy of the interventions is generally modest, and that the particularities of each institution seem to be more important than the type of measures used to introduce change. The best approach therefore would be to analyze the characteristics of each individual Unit referred to the presence of protocols and check their daily implementation. This in turn should be followed by an analysis of the results obtained, with definition of those circumstances that facilitate or complicate application of the protocols, with a view to proposing corrective changes for incorporation to daily practice. The way in which the protocols are diffused, and the control of compliance, should be adapted to each individual Unit and scenario in order to secure significant changes.
Our study has some limitations. On one hand, this was a single-center study. However, as has been mentioned above, knowledge of the characteristics inherent to each individual Unit appears to be decisive in selecting the measures to be introduced and their success. On the other hand, our study included no control group to allow us to affirm that the changes observed were attributable to the program and not to other external factors. The study was not designed for comparison with a control group, and such comparison moreover would not have been possible, since there were no other Units using the same nutrition protocol. Another of the limitations of our study refers to the differences in the patient populations of the two data collection phases. These differences are attributable to chance and probably to the short data collection time period involved (2 months). A longer period probably would have contributed to minimize the differences between the groups. Nevertheless, since this was a study designed to evaluate the impact of passive (educational) interventions upon changes in patient care, such changes could have manifested in the same way. Lastly, our study was not designed to analyze the causes of success or failure of the implementation of measures to improve nutritional support; rather, it was limited to describing the impact of an intervention upon the process.
In sum, our results indicate that the simple recommendation of changes in the nutritional support of critical patients induces minor modifications in clinical practice, but is not accompanied by increased effectiveness of nutritional treatment. The data obtained support the need to apply active measures of an educational nature, with evaluation of the results, in order to guarantee effective change of clinical relevance for the patients.
Financial supportThis project was financed in part by a research grant from Abbott Nutrición, España.
Conflict of interestThe authors declare that they have no conflicts of interest.
Thanks are due to the medical and nursing personnel of the Department of Intensive Care Medicine of Hospital Universitario Doce de Octubre (Madrid, Spain) for their contribution to the data collection phase of this study.
Please cite this article as: Lázaro-Martín NI, Catalán-González M, García-Fuentes C, Terceros-Almanza L, Montejo-González JC. Análisis de los cambios en las prácticas de nutrición en UCI tras una intervención en el proceso. Med Intensiva. 2015;39:530–536.

