

To describe the results of the application of a Machine Learning (ML) model to predict in-hospital cardiac arrests (ICA) 24 hours in advance in the hospital wards.
DesignRetrospective observational cohort study.
SettingHospital Wards.
PatientsData were extracted from the hospital's Electronic Health Record (EHR). The resulting database contained a total of 750 records corresponding to 620 different patients (370 patients with ICA and 250 control), between may 2009 and december 2021.
InterventionsNo.
Main variables of interestAs predictors of ICA, a set of 28 variables including personal history, vital signs and laboratory data was employed.
ModelsFor the early prediction of ICA, predictive models based on the following ML algorithms and using the mentioned variables, were developed and compared: K Nearest Neighbours, Support Vector Machine, Multilayer Perceptron, Random Forest, Gradient Boosting and Custom Ensemble of Gradient Boosting estimators (CEGB).
ExperimentsModel training and evaluation was carried out using cross validation. Among metrics of performance, accuracy, specificity, sensitivity and AUC were estimated.
ResultsThe best performance was provided by the CEGB model, which obtained an AUC = 0.90, a specificity = 0.84 and a sensitivity = 0.81. The main variables with influence to predict ICA were level of consciousness, haemoglobin, glucose, urea, blood pressure, heart rate, creatinine, age and hypertension, among others.
ConclusionsThe use of ML models could be of great support in the early detection of ICA, as the case of the CEGB model endorsed, which enabled good predictions of ICA.
Although in-hospital cardiac arrests (ICA) are rare, they are linked to a high mortality rate, being therefore crucial the identification of patients with high risk of ICA, since it allows immediate intervention, avoiding the acute event and decreasing the probability of a fatal outcome. Therefore, unexpected clinical deterioration in hospitalised patients is an important concern for the clinical safety of the patient and for the Intensive Care Unit (ICU).1 In fact, more than a half of cardiac arrests result from respiratory failure,2 or hypotension and fall in Glasgow Coma Scale,3 and up to 80% of patients with cardiac arrest show signs of deterioration in the 8 hours before cardiac arrest.4 To identify hospitalised patients at risk of clinical deterioration, Early Warning Systems (EWS)5 such as the Modified Early Warning Score (MEWS)6 or Cardiac Arrest Risk Triage Score7 are normally used, which are currently incorporated in many hospitals, and whose aim is to identify and act promptly on these patients. The introduction of a management system in Intensive Care Medicine based on the safety of the seriously ill patient during their entire hospitalisation has shown promising results,8 reducing rates of ICA and mortality.9 Besides, a large amount of daily information from different medical systems and devices that can be processed digitally to be used in the personalised patient’s treatment. All this information allows the use of techniques known as Big Data Analysis (BDA) and Machine Learning (ML), used for improving the clinical patient’s safety in people with high-risk of complications.10 As other studies explained, the information technologies (ITs) as BDA can be a complementary tool to the daily work of the ICU,11 since they could contribute to ameliorate the prognosis of patients hospitalised in the wards.12 Consequently, ITs are being under study for the creation of clinical decision support systems, having great potential for the prediction of various conditions such as sepsis,13 massive haemorrhage in patients with severe traumatic injury14 and mortality.15 Recently, several studies that used ML to predict ICA through patient clinical features have reported that ML-based models are superior to conventional rule-based tools.16
Different ITs strategies have been proposed,17 describing that algorithms based on ML have a greater sensitivity and a lower false alarm rate than traditional systems for early identifying patients with cardiac arrest,18 reinforcing the idea that ML with BDA will allow better diagnosis, risk stratification and personalised treatments, by generating precision medicine. The presented study tries to detect ICA 24 hours in advance by means of ML models that have been trained with a larger set of predictor variables, which includes patient antecedents. On top of that, an analysis of which of these predictors most influence the model is included.
Primary objectivesTo develop and evaluate several predictive models, based on ML algorithms, that estimate the risk of ICA 24 hours before the event, by using variables registered the hospital’s Electronic Health Record (EHR) that belonged to a cohort of both ICA and non-ICA patient. To validate the hypothesis that ML models may allow to predict ICA with a significantly higher accuracy than traditional score systems that employ a smaller set of features. To establish which demographic, clinical, laboratory and antecedent variables are most powerful predictors of ICA.
MethodsStudy design and settingsA retrospective, observational, based on real-world data, cohort study was performed. Two cohorts of patients belonging to the Son Llàtzer University Hospital (HUSLL), a Spanish second regional level hospital, were used1: all patients who had suffered an ICA (positive cases)2; a sample of patients with no ICA (control patients), randomly selected among hospitalisations where no cardiac arrests occurred. All patients had been hospitalised through the Emergency Department, and the distribution of patients among hospital services was similar in the two cohorts. For data collection of positive cases, the Utstein style guidelines18 were followed, where the inclusion criteria were: all patients over 18 years of age who suffered a cardiorespiratory arrest in the hospital wards from September 2009 to december 2021 and treated by the ICU, with cardiac arrest being defined as loss of pulse with attempted resuscitation.19 The total number of admissions in HUSLL was 1,065,722 during this period, with a prevalence of around 0.64 ICAs per 1,000 admitted patients. The exclusion criteria of ICAs for the study were: cardiac arrests where the patients refused resuscitation manoeuvres despite medical recommendation. Besides, ICAs that followed another cardiac arrest from the same patient in a less-than-7-days period were also excluded, to avoid analysis alterations. ICAs from the same patient, separated in time by more than 7 days, were considered separately. As the goal of the study was to build a model to predict ICA 24 hours before the event, the predictor variables were filtered to focus on the time of the event, analysing the measurement of each variable that was closest in time to 24 hours before the episode. It was made sure that the measurement selected as the value of each variable had been recorded in a time interval of 72 to 12 hours before the ICA. Furthermore, if no measurements of the variables had been recorded for the patient between 36 and 12 hours before an arrest, the arrest itself was discarded and not used as a data point, as it was considered that the predictor information could not represent the patient’s state one day before the event.
In healthy patients, measurements of clinical and laboratory variables that had been recorded during their hospitalisations were extracted. Then, preliminary data points were constructed every time a variable received a new measurement, with these points being composed of the last measurement of each variable in a 60 -h window. Hence, there was initially a great number of data points per hospitalisation per patient. Those data points that minimised the number of missing values for each patient were selected, considering that at least one record for each control must be selected so as not to lose patients in the sampling. Once this set of 250 points was obtained, other 125 data points were sampled randomly from the remaining ones, to complete the control cohort. In addition, it was forced that the 60 -h-window data points chosen for one same patient were more than 6 days apart, so that there was variability in the measurements. The resulting database contained a total of 750 data points (a data point consists in a row of the processed dataset that was built for the analysis of the study, extracted from the Electronic Health Records (EHR) of patients that were hospitalised during a certain period in HUSLL) corresponding to 620 different patients, 370 patients with ICA and 250 controls, where 375 records were extracted from each cohort, obtaining a balanced dataset.
This retrospective cohort study was approved by Research Ethics Committee of Illes Balears (Code: IB 4951/22 PI). The use and processing of the collected data was ensured to comply with the Organic Law 3/2018, of 5 December, on the Protection of Personal Data and the Guarantee of Digital Rights. Patient information was anonymised prior to the study.
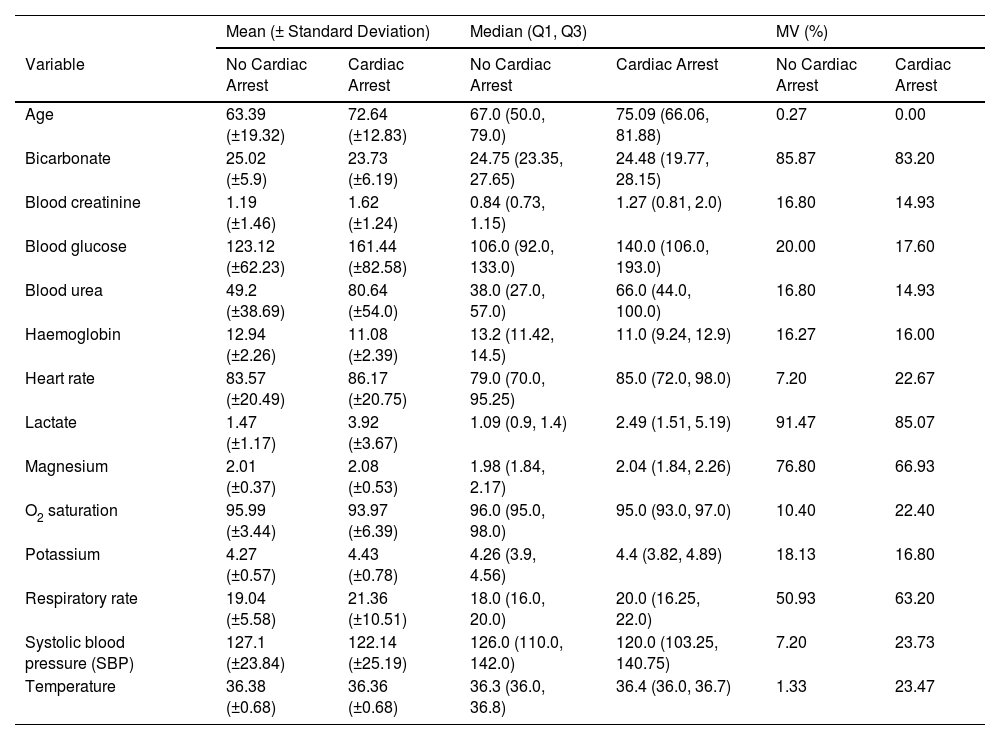
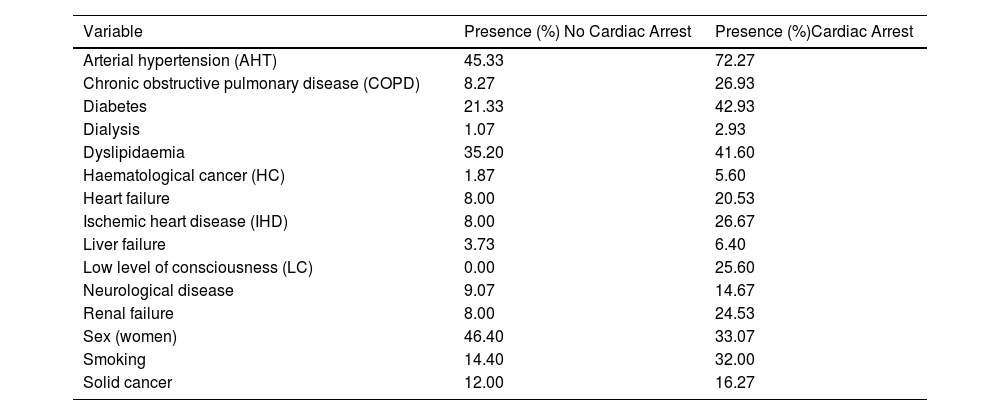
Selected variablesA total of 28 variables were collected from the EHR. These variables were classified in the following types of predictors: demographic (sex and age at the time of hospitalisation), vital signs (respiratory rate (RR), systolic blood pressure (SBP), heart rate (HR), body temperature, saturation oxygen (SO2) and low level of consciousness (LC) measured with Glasgow scale), laboratory biomarker analyses (bicarbonate, blood creatinine, blood glucose, blood urea, haemoglobin, lactate, magnesium, O2 saturation, potassium) and comorbidities (arterial hypertension (ATH), chronic obstructive pulmonary disease (COPD), diabetes, dialysis, dyslipidaemia, smoking, ischemic heart disease (IHD), liver failure, neurological disease, renal failure, cancer). Continuous variables were represented as numbers (Table 1), categorical variables were classified in binary categories (Table 2). The comorbidities were identified using ICD-9/10 code.
Comparison of baseline characteristics between the train and test cohorts.
| Mean (± Standard Deviation) | Median (Q1, Q3) | MV (%) | ||||
|---|---|---|---|---|---|---|
| Variable | No Cardiac Arrest | Cardiac Arrest | No Cardiac Arrest | Cardiac Arrest | No Cardiac Arrest | Cardiac Arrest |
| Age | 63.39 (±19.32) | 72.64 (±12.83) | 67.0 (50.0, 79.0) | 75.09 (66.06, 81.88) | 0.27 | 0.00 |
| Bicarbonate | 25.02 (±5.9) | 23.73 (±6.19) | 24.75 (23.35, 27.65) | 24.48 (19.77, 28.15) | 85.87 | 83.20 |
| Blood creatinine | 1.19 (±1.46) | 1.62 (±1.24) | 0.84 (0.73, 1.15) | 1.27 (0.81, 2.0) | 16.80 | 14.93 |
| Blood glucose | 123.12 (±62.23) | 161.44 (±82.58) | 106.0 (92.0, 133.0) | 140.0 (106.0, 193.0) | 20.00 | 17.60 |
| Blood urea | 49.2 (±38.69) | 80.64 (±54.0) | 38.0 (27.0, 57.0) | 66.0 (44.0, 100.0) | 16.80 | 14.93 |
| Haemoglobin | 12.94 (±2.26) | 11.08 (±2.39) | 13.2 (11.42, 14.5) | 11.0 (9.24, 12.9) | 16.27 | 16.00 |
| Heart rate | 83.57 (±20.49) | 86.17 (±20.75) | 79.0 (70.0, 95.25) | 85.0 (72.0, 98.0) | 7.20 | 22.67 |
| Lactate | 1.47 (±1.17) | 3.92 (±3.67) | 1.09 (0.9, 1.4) | 2.49 (1.51, 5.19) | 91.47 | 85.07 |
| Magnesium | 2.01 (±0.37) | 2.08 (±0.53) | 1.98 (1.84, 2.17) | 2.04 (1.84, 2.26) | 76.80 | 66.93 |
| O2 saturation | 95.99 (±3.44) | 93.97 (±6.39) | 96.0 (95.0, 98.0) | 95.0 (93.0, 97.0) | 10.40 | 22.40 |
| Potassium | 4.27 (±0.57) | 4.43 (±0.78) | 4.26 (3.9, 4.56) | 4.4 (3.82, 4.89) | 18.13 | 16.80 |
| Respiratory rate | 19.04 (±5.58) | 21.36 (±10.51) | 18.0 (16.0, 20.0) | 20.0 (16.25, 22.0) | 50.93 | 63.20 |
| Systolic blood pressure (SBP) | 127.1 (±23.84) | 122.14 (±25.19) | 126.0 (110.0, 142.0) | 120.0 (103.25, 140.75) | 7.20 | 23.73 |
| Temperature | 36.38 (±0.68) | 36.36 (±0.68) | 36.3 (36.0, 36.8) | 36.4 (36.0, 36.7) | 1.33 | 23.47 |
MV % missing values are displayed (MV%).
Summary characteristics of the binary predictor variables.
| Variable | Presence (%) No Cardiac Arrest | Presence (%)Cardiac Arrest |
|---|---|---|
| Arterial hypertension (AHT) | 45.33 | 72.27 |
| Chronic obstructive pulmonary disease (COPD) | 8.27 | 26.93 |
| Diabetes | 21.33 | 42.93 |
| Dialysis | 1.07 | 2.93 |
| Dyslipidaemia | 35.20 | 41.60 |
| Haematological cancer (HC) | 1.87 | 5.60 |
| Heart failure | 8.00 | 20.53 |
| Ischemic heart disease (IHD) | 8.00 | 26.67 |
| Liver failure | 3.73 | 6.40 |
| Low level of consciousness (LC) | 0.00 | 25.60 |
| Neurological disease | 9.07 | 14.67 |
| Renal failure | 8.00 | 24.53 |
| Sex (women) | 46.40 | 33.07 |
| Smoking | 14.40 | 32.00 |
| Solid cancer | 12.00 | 16.27 |
The missing values were filled with the median value for numerical variables and mode for binary ones.
ModelsSeveral ML algorithms were used to address the problem of predicting which patients would suffer an ICA. These methods employ mathematical models to capture complex associations between predictor and target variables. The target variable was the presence or absence of ICA around 24 hours after the measurement of their predictor variables.
Such algorithms were the following: K Nearest Neighbours (KNN),20,21 Support Vector Machine (SVM),22 Multilayer Perceptron (MLP),23 Random Forest (RF),24,25 Gradient boosting (GB),26 Custom Ensemble of Gradient Boosting estimators (CEGB). The latter, as its name implies, was a self-made algorithm based on combining other several GB algorithms. The ML model training is furtherly explained in Annex I in the Supplementary material.
Furthermore, MEWS6 was also evaluated on the dataset as a reference system to compare ML-based models with.
ExperimentsCross validationThe experiments were carried out with the iterative method of 4-fold cross-validation (CV).27 With this technique, average performance metrics with 95% confidence intervals (CI) were obtained for the different models. More details on this process are in Annex II in the Supplementary material.
MetricsThe performance of the ML models was evaluated with several metrics28: accuracy, recall or sensitivity, negative recall or specificity, area under ROC curve (AUC), precision or positive predictive value (PPV), negative precision or negative predictive value (NPV). They were calculated in every iteration of the 4-fold CV, by comparing the actual classes of the testing data with the predictions generated by the models. While negative and positive recalls reveal the performance of the model per class, in terms of the cases that can be expected to be detected by a model, the precisions allow to evaluate the reliability of the predictions and thus a model’s clinical utility. Accuracy is a global (not per-class) representation of both performance and reliability. A further explanation of these metrics is in Annex III in the Supplementary material.
Features importanceThere exist methods based on algorithmic explainability that allow an insight of how the ML model uses the predictor variables to make predictions. In this study, Shapley Additive exPlanations (SHAP) technique29 was employed on the ML model that showed the best overall performance. Such method gives a SHAP value to every variable of every data point for which the model has generated a prediction. This value represents, on the one hand, how much influence the variable has in the prediction for the data point. The higher the magnitude of the SHAP value, the greater the influence of the variable. On the other hand, it also illustrates the direction of the association between the variable and the prediction. If the SHAP value is positive, the variable has influenced the prediction to be positive (presence of ICA), and vice versa. Note that the SHAP method considers the interactions between predictor variables when estimating their influences on the predictions.
In this analysis, the SHAP technique was used on the test data of every iteration of the 4-fold CV, so a summary plot with the aggregated SHAP values is displayed.
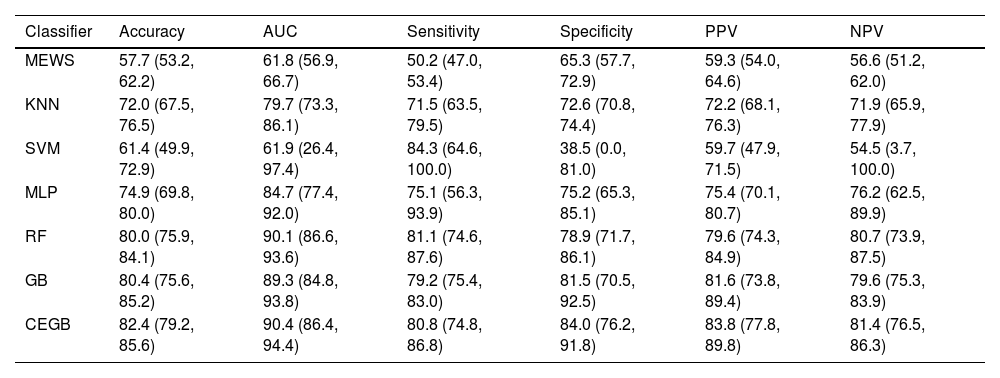
ResultsML models performance and validationThe metrics of discrimination obtained by the different ML models are shown in Table 3. All the studied ML models correctly classified most of the test data points, although the extremely wide CI in the SVM’s metrics (reaching 0 for specificity and 100 for sensitivity) indicate that said model always predicts as positive in some CV iterations. The RF, GB and CEGB algorithms correctly predict 4 out of 5 cases, with balance between the two classes. Furthermore, their CI imply that none of these tree-based models can be said to outperform the others at 95% confidence. AUC also showed a higher general predictive capacity for the tree-based algorithms, and a more limited one for the KNN and SVM classifiers. The ML model that offered an overall optimal performance was the CEGB estimator, which showed the highest accuracy, AUC, specificity, PPV and NPV, while still classifying correctly 4 out 5 positive data points (sensitivity of 0.81). It also tended to produce the narrowest CI among the tree-based models, which entails that its performance across the CV splits was the most stable.
Metrics obtained by the different ML models and the reference model, MEWS. The results are the averages (in %, with Confidence Intervals at 95%) across the four splits in the cross-validation.
| Classifier | Accuracy | AUC | Sensitivity | Specificity | PPV | NPV |
|---|---|---|---|---|---|---|
| MEWS | 57.7 (53.2, 62.2) | 61.8 (56.9, 66.7) | 50.2 (47.0, 53.4) | 65.3 (57.7, 72.9) | 59.3 (54.0, 64.6) | 56.6 (51.2, 62.0) |
| KNN | 72.0 (67.5, 76.5) | 79.7 (73.3, 86.1) | 71.5 (63.5, 79.5) | 72.6 (70.8, 74.4) | 72.2 (68.1, 76.3) | 71.9 (65.9, 77.9) |
| SVM | 61.4 (49.9, 72.9) | 61.9 (26.4, 97.4) | 84.3 (64.6, 100.0) | 38.5 (0.0, 81.0) | 59.7 (47.9, 71.5) | 54.5 (3.7, 100.0) |
| MLP | 74.9 (69.8, 80.0) | 84.7 (77.4, 92.0) | 75.1 (56.3, 93.9) | 75.2 (65.3, 85.1) | 75.4 (70.1, 80.7) | 76.2 (62.5, 89.9) |
| RF | 80.0 (75.9, 84.1) | 90.1 (86.6, 93.6) | 81.1 (74.6, 87.6) | 78.9 (71.7, 86.1) | 79.6 (74.3, 84.9) | 80.7 (73.9, 87.5) |
| GB | 80.4 (75.6, 85.2) | 89.3 (84.8, 93.8) | 79.2 (75.4, 83.0) | 81.5 (70.5, 92.5) | 81.6 (73.8, 89.4) | 79.6 (75.3, 83.9) |
| CEGB | 82.4 (79.2, 85.6) | 90.4 (86.4, 94.4) | 80.8 (74.8, 86.8) | 84.0 (76.2, 91.8) | 83.8 (77.8, 89.8) | 81.4 (76.5, 86.3) |
MEWS also showed narrow CI, which suggests robustness, but its overall performance was poorer than most of the ML-based models. In general, it only classified correctly slightly more than a half of the samples. The lower limits of the KNN, MLP, RF, GB and CEGB were seldomly lower than the upper limits of MEWS’s metrics, implicating a lower performance in the true population with a 95% confidence.
SHAP analysisSHAP analysis was carried out for the best overall performing ML model: the CEGB estimator. A summary plot displaying the features’ influences on the model’s predictions is shown in Fig. 1, whose interpretation is: first, the most important variable for the model is a low level of consciousness, which means in Glasgow scale a value less than 13. A value of 1 (presence) for said variable greatly influences the model to predict ICA. Second, the most influential quantitative variables are haemoglobin, blood glucose, blood urea, SBP, heart rate, blood creatinine and age. In the case of haemoglobin and SBP, low values tend to be predictive of ICA and high values tend to be predictive of no ICA. The association is opposite for blood glucose, blood urea, heart rate, blood creatinine and age. Third, regarding the antecedents, the most influential are hypertension, ischemic heart disease, smoking and chronic obstructive pulmonary disease. The presence of these features is predictive of ICA, although their absence is not particularly predictive of no ICA. Fourth, the least influential variables in the dataset are antecedents of dialysis, liver failure, haematological cancer and solid cancer. Note, however, that the presence of such conditions is infrequent in the dataset.
. If it is negative, such is the influence (induces to predict no cardiac arrest). As there is a SHAP value assigned to every variable of every data point, the clouds are grouped by variable. The variables are sorted in a descending overall importance ranking. The overall importance of a variable is established by the average magnitude of its SHAP values among all the data points. Finally, the colour of each point in a cloud represents the original value of the variable of such point. If the variable has a low value in a data point, such point will be coloured in blue in the cloud of the variable in question. Inversely, if the original value is high, the colour will be red.")
SHAP summary plot with the aggregated SHAP values generated in each iteration of the cross-validation. SHAP analysis was carried out for the CEGB estimator. Each cloud of points represents the data points of the aggregated test splits among the iterations of the cross-validation. The horizontal axis shows the SHAP values assigned to every data point. If the magnitude is higher, the influence is greater. If the value is positive, the influence is positive (induces to predict cardiac arrest). If it is negative, such is the influence (induces to predict no cardiac arrest). As there is a SHAP value assigned to every variable of every data point, the clouds are grouped by variable. The variables are sorted in a descending overall importance ranking. The overall importance of a variable is established by the average magnitude of its SHAP values among all the data points. Finally, the colour of each point in a cloud represents the original value of the variable of such point. If the variable has a low value in a data point, such point will be coloured in blue in the cloud of the variable in question. Inversely, if the original value is high, the colour will be red.
With the advancement of EHR and BDA, ML algorithms have become widely used tools for individualised medicine to help decision making.30–32 The different predictive models used so far in literature to predict cardiac arrest differ in several aspects such as architecture, processing and learning methods, exclusion criteria and alarm response times. Besides, few studies have been focused specifically on episodes of ICA. Hong et al.16 developed a cardiac arrest prediction model in the ED using ML and sequential characteristics, and it was validated for clinical usefulness. Yet, in that model, missing demographic data or delayed reporting times for laboratory tests may reduce predictive performance. It also presented a limited number of predictor variables, although with high compliance.10,33 In contrast, this report describes the development and evaluation of several predictive models based on ML algorithms, integrating a larger set of demographics, clinical and laboratory variables, as well as personal antecedents and comorbidities of the patients. Some resulting ML models manage to distinguish the cases of cardiac arrest and no cardiac arrest with a high level of success, reaching an AUC of 90%, and accuracies, recalls and precisions of above 80%. These metrics show, on the one hand, that the great majority of both healthy and ICA patients can be identified as such by the ML models; on the other, the predictions of these ML models can be trusted as correct with high probability. This is a remarkable performance for such a complex problem, both because of the nature of the target variable (occurrence of cardiac arrest one day in advance), and because of the limitations of the dataset (small volume of patients and some variables with many missing values). Furthermore, some of the ML models clearly outperform a traditional scoring system like MEWS.
The use of SHAP in this study provides an insight on the relevant associations between predictor variables and the occurrence of ICA. Among the clinical variables, the most influential to predict an ICA are a low level of consciousness, low haemoglobin, high glucose and urea levels, low systolic blood pressure, and high heart rates, creatinine levels and ages. Comparing with existing studies, such as the one by Sun et al.,15 respiratory rate, bicarbonate concentration, oxygen saturation and age had been the most relevant to predict mortality. Other studies that only analysed vital signs found heart and respiratory rates to be the most influential34 for deterioration prediction. On another note, few ML-based predictive tools include personal antecedents and comorbidities. In this analysis, the influences of the presence of hypertension, IHD, smoking and CPOD stand out to predict ICA. However, these variables are conventionally extracted by manual means. To generate on-line predictions with a ML model, they should be extracted in a structured way instead.
Another important issue is the prediction horizon. In 2022, the Su et al’s study34 only evaluated vital signs 48 hours before the event, while in the studies by Kwon et al.18 and by Cho et al.,10,33 age and vital signs were validated 24 hours prior cardiac arrest. Our study also describes the prediction of ICA 24 hours in advance, so that that the medical staff can have enough time to intervene when using an EWS that embeds the model. It is very important for the rapid response team to have the information before an ICA occurs: the faster cardiopulmonary resuscitation is conducted, the higher the probability of patient survival.
There are several limitations in this analysis. First, it is a retrospective study with a small sample size, coming from a single centre and from a span of 14 years. During this period, there may be heterogeneity when recording physiological constants in the computer system, therefore results may not be generalised. Thirdly, the lack of measurement of the response time of the doctor on duty to the alteration of the physiological constants may bias the time from the records. Fourthly, it remains to analyse treatments before ICA. These questions, together with the promising results from this study, would justify the execution of a prospective analysis, where a final model would be constructed and trained with the complete dataset, and its predictions would be compared with reality to ratify its predictive capability.
ConclusionThe CEGB ML model presented the best performance and its most predictive variables of ICA 24 hours before the event were examined. The obtained results encourage the prolongation of the study with a future prospective analysis, in which the model would be run in real-time in the hospital and its performance validated, together with its most influential predictors. ML, applied to the prediction of ICA, may help physicians act quickly and enhance the prognosis of the patient.
Funding statementThis work was partially supported by Microport®. The funder had no role in the study design, data collection, analysis, decision to publish, or preparation of the manuscript.
Author contributionsConceptualization: Socias L, Borges-Sa M. Methodology: Sarubbo F. Validation: Serrano-García A, López-Ramos D, Pruenza C. Formal analysis: Serrano-García A, López-Ramos D, Pruenza C. Investigation: Socias L, Gutierrez L. Resources: Socias L, Gutierrez L. Data curation: Serrano-García A, López-Ramos D. Writing—original draft preparation: Socias L, Sarubbo F. Writing—review and editing: Sarubbo F, Socias L. Supervision: Sarubbo F. Project administration: Socias L.
Conflict of interestThe authors declare that they have no conflicts of interest. They were informed and consent the manuscript publication.
The authors appreciate the interest, effort and dedication given to the nursing team led by Ana Pérez and to Department of Informatic of Hospital Universitario Son Llàtzer (Maria Ponseti, Victor Estrada, Toni Contesti, Antonio Hernandez).
The following is Supplementary data to this article: