


Study the relationship and concordance between calculated respiratory effort using the signals of the ventilator (Pmus) and that measured in esophageal pressure (Pes) on mechanical ventilation with different levels of respiratory assistance.
DesignProspective cohort study.
AmbitIntensive Care Unit of 2 universitary hospitals.
PatientsPatients on weaning time.
ProcedureAirway, esophageal and respiratory flow were recorded on CPAP, assist volume control (ACV) and pressure support (PS), with complete (ACV1, PS1) and partial assistance (ACV5, PS5). Measurement: respiratory variations of Pes and Pmus (Δ: cmH2O) and pressure time product (PTPm: cmH2O·s/m).
ResultsFourty one records were studied, the assistance was in CPAP of 5cmH2O, PS1 of 15±5 reduced to 9±4cmH2O. In ACV1 the inspiratory flow was 1±0.2l/s, reduced to 0.49±0.1l/s for ACV5. The increase in respiratory assistance decreases respiratory effort, measured in Delta Pes (CPAP, ACV5, ACV1, PS5, PS1): 11±3, 6±3, 5±3, 9±6, 7±7 and in Pmus 16±5, 10±6, 5±3, 10±6, 5±4cmH2O (p<.001). The PTP per minute measured in Pes: 213±87, 96±91, 23±24, 206±121, 108±100 (p=.001) and in Pmus: 293±117, 156±84, 24±32, 233±121, 79±90 (p<.001). The measurements in Pes and Pmus showed the following correlation, in Delta: 0.72 and PTPm, 0.87. The Bland–Altman analysis indicates that the difference between Delta Pes-Pmus can be 16 and the PTPm of 264 and the systematic error in Delta: −0.98±4.4 and PTPm −23.69±66.3cmH2O·s/m.
ConclusionsCalculated and measured parameters of respiratory effort showed unacceptable differences in clinical practice.
Analizar la relación y concordancia entre el esfuerzo respiratorio calculado con las señales del respirador (Pmus) y el medido con presión esofágica (Pes), en ventilación mecánica con diferentes niveles de asistencia respiratoria.
DiseñoEstudio prospectivo de una cohorte.
ÁmbitoUnidad de cuidados intensivos polivalente en 2 hospitales terciarios.
PacientesPacientes en fase de retirada de la ventilación mecánica.
IntervencionesLa presión en la vía aérea, esofágica y flujo respiratorio se registraron en CPAP, ventilación asistida controlada por volumen (ACV) y presión soporte (PS) con asistencia respiratoria completa (ACV1, PS1) y parcial (ACV5, PS5). Variables medidas en Pes y Pmus: amplitud respiratoria (Δ: cmH2O) y el producto presión tiempo por minuto (PTPm: cmH2O·s/m).
ResultadosEn 10 pacientes se estudiaron 41 registros. La asistencia en CPAP fue de 5cmH2O, PS1 15±5 y PS59±4cmH2O. En ACV1 el flujo inspiratorio fue 1±0,2l/s, reducido a 0,49±0,1l/s para ACV5. El esfuerzo respiratorio disminuyó con el aumento de la asistencia respiratoria: ΔPes (CPAP, ACV5, ACV1, PS5, PS1): 11±3, 6±3, 5±3, 9±6, 7±7 y en ΔPmus 16±5, 10±6, 5±3, 10±6, 5±4cmH2O (p<0,001). PTPm Pes: 213±87, 96±91, 23±24, 206±121, 108±100 (p=0,001) y en Pmus: 293±117, 156±84, 24±32, 233±121, 79±90cmH2O·s/m (p<0,001). Las medidas en Pes y Pmus mostraron una correlación Δ:0,72 y PTPm: 0,87. El análisis de Bland–Altman demostró que la diferencia ΔPes-Pmus puede ser de 16cmH2O y el PTPm de 264 y el error sistemático en Δ: −0,98±4,4 y PTPm −23,69±66,3cmH2O·s/m.
ConclusionesLos parámetros calculados de esfuerzo respiratorio y los medidos directamente presentan diferencias que no son aceptables en la práctica clínica.
Programming assisted ventilation parameters in daily practice is a challenge, since excessive assist results in diaphragmatic dysfunction due to muscle rest and facilitates trigger failure. On the other hand, excessive respiratory effort causes dyspnea,1 asynchrony and even muscle fatigue and damage,2 with the risk of prolonging the duration of mechanical ventilation (MV).3 It therefore seems advisable to determine muscle effort, and recent reviews address this issue as well as the difficulty of incorporating it to routine monitoring practice in the Intensive Care Unit (ICU).4 At the patient bedside or point of care, respiratory effort is assessed through clinical examination and monitoring of the respiratory signals generated by the respirator. The clinical assessment of respiratory difficulty is based on a series of clinical signs, though observation and quantification are characterized by important inter-observer variability.5 To the best of our knowledge, no clinical studies have compared clinical evaluation with objective measures of respiratory muscle effort. Interpretation of the curves generated onscreen by the respirator depends on the experience of the physician, though even experienced professionals can have difficulties in interpreting such curves.6 The changes which respiratory muscle effort produce in the airway pressure curve in volume assist control ventilation (ACV) and in inspiratory flow in ventilation with pressure support (PS) allow us to deduce the intensity of respiratory effort.7,8 In these cases we are assuming that patient effort modifies the pressure in ACV or PS, and therefore the morphology of the curve with respect to passive or controlled ventilation represented by the calculated respiratory muscle pressure (Pmus).9,10 The incorporation of this signal to the monitoring of patients subjected to mechanical ventilation allows for improved interaction with the respirator,8,11 but little information is available on the capacity to estimate pleural pressure amplitude in assist mode ventilation.12 In this regard, it has been used in ventilation with PS to optimize the assist level, showing good correlation with esophageal pressure (Pes),8 but the concordance between the two signals has not been established, and it is therefore not clear whether they are equivalent in measuring respiratory effort.13
The present study was carried out to evaluate the concordance between invasive measurement of respiratory effort with the Pes probe and noninvasive measurement based on the curves generated by the respirator.
Material and methodsPatientsThe present study involved a group of patients requiring mechanical ventilation for different reasons and admitted to the medical-surgical ICUs of two third-level hospitals, with criteria for weaning from mechanical ventilation, and who agreed to participate in the study. Patients with active pleural effusion, recent gastrointestinal bleeding or surgery, and thoracic deformities were excluded from the study.
Patient monitoring was carried out based on the electrocardiogram (ECG), pulsioximetry and noninvasive arterial pressure recording. The protocol was approved by the Research Committee of the hospital, and consent to participation was obtained from the patient or family.
Recorded signals. Respiratory flow (V′) was measured with a pneumotachograph (Fleisch no. 2) positioned between the endotracheal tube and the Y-connection of the respirator circuit. The volume (V) was obtained by integration of the flow signal. The airway pressure (Paw) was recorded from a connection between the endotracheal tube and the respirator circuit. We measured Pes with a balloon catheter after insufflating 0.5ml of air and confirming the position with an occlusion test. The pressures were measured with a differential pressure transducer, processed and filed in electronic format for subsequent analysis using the Anadat software application.
Respiratory mechanics were calculated in volume high assist control ventilation (ACV1), without additional maneuvers. Multiple linear regression analysis with the minimum squares method was used to adjust the pressure, volume and flow values over the entire respiratory cycle to a mechanical behavior model with elastance and resistance values. Basically, the volume and flow signals were used to establish two constants (Esr, Rsr) allowing us to reproduce the pressure measured in the airway – considering the latter to be the sum of an elastic pressure and a resistive pressure. The dependent variable was Paw and the independent variables were flow and volume [Paw(t)=Esr V(t)+Rsr (V′)+Pesp]. In this context, Esr is the dynamic elastance and Rsr represents the total resistance of the respiratory system, respectively. In turn, Pesp represents the dynamic positive end-expiratory pressure (PEEP) or point on the pressure curve where flow integration starts.14 We used the mean value of the respiratory cycles included in the registry interval (40s) if the coefficient of determination of the fit was >0.95. In cases with high PEEPi levels, we used the inspiratory and expiratory occlusion method.
Calculated Pmus. Use was made of the same respiratory mechanics analytical model, assuming that the pressure in the system is the result of the pressure exerted by the respirator and the respiratory muscles [Rsr·V′+Esr·V+Pesp=Paw−Pmus]. Knowing the above variables, we were able to calculate Pmus [Pmus=Rsr·V′+Esr·V+Pesp−Paw].7,15 The value of Pmus during the expiratory phase is related to PEEP, but does not represent the true value, which cannot be calculated.
ProcedureWith the patient in the reclined position and before recording the signals, we removed the humidifier and aspirated the bronchial secretions. At the start of the study we performed a continuous positive airway pressure (CPAP) test, and volume high assist control ventilation (ACV1) was started 30min after recording. For this purpose, the inspiratory trigger was programmed for maximum sensitivity, without auto-trigger, PEEP was set according to PEEPi, and the respiratory frequency was defined to allow respiratory triggering to be made by the patient. The tidal volume was 6–8ml/kg of ideal body weight, and we increased the inspiratory flow (squared) in order to secure minimum respiratory effort, as assessed from the Pes curve. If necessary, the tidal volume was temporarily increased to reduce effort. After recording the signals, the inspiratory flow was reduced according to the level of effort by up to 50%, and the recording was repeated (ACV5). In pressure support ventilation, the sensitivity of the inspiratory and expiratory trigger, and PEEP, were not modified. The assist level was raised in steps of 2–5cmH2O until effort proved minimal (PS1). After recording, the assist level as reduced by 50% (PS5).
Physiological indices measured by esophageal and muscle pressureRespiratory amplitude of Pes and Pmus (delta Pes, delta Pmus), measured as the difference between the start of the inspiratory decrease of Pes and Pmus and the maximum descent or nadir of each signal.
Inspiratory pressure-time product (PTP),16,17 quantified as the area between the elastic rebound pressure of the thoracic wall (Pre.pt) and the inspiratory Pes or Pmus. The end of inspiratory effort was regarded as the pressure point equivalent to flow zero. We measured Pre.pt from thoracic wall elastance during passive ventilation and tidal volume during assisted ventilation. This pressure was extrapolated at the start of inspiratory effort in Pes and Pmus [Pre.pt=(Ept·v)+Pes.esp], where Pes.esp is the Pes or Pmus at the end of expiration, and Ept is the elastance of the thoracic wall measured in ACV1, as the ratio between the respiratory variation of Pes and tidal volume. The area was measured from integration of the pressure (Pes, Pmus) according to time. We measured three representative cycles of the respiratory pattern of the patient in each ventilation mode and calculated the mean value (expressed per minute), considering the respiratory frequency measured in the flow signal. These measurements were made in each ventilation mode and CPAP.
Statistical analysisThe Kolmogorov–Smirnov test was used to assess normal data distribution. The values were reported as the mean and standard deviation (SD), and as the median and quartiles 25–75%. Comparisons were made using the Student t-test or nonparametric Mann–Whitney U-test, as applicable. Analysis of variance (ANOVA) was used for the comparison of repeated means. The relationship between variables was explored by simple linear regression analysis, and the fit between the two measurement methods was assessed by means of Bland–Altman concordance analysis. The percentage of error was calculated as the limits of fit (2SD) of the differences in means divided by the mean of the two methods18. Statistical significance was considered for p<0.05.
ResultsTen patients were studied. Their characteristics are summarized in Table 1. A total of 50 recordings were obtained, of which 41 proved suitable for analysis. The rest were discarded due to artifacts in the Pes signal. The applied CPAP was 5cmH2O, except in one case that required 18cmH2O because of PEEPi 20cmH2O. In this mode the peak inspiratory flow (V′max) was 0.7±0.1l/s and the minute volume (VE) was 9±2l/m. In ACV1, the tidal volume was 0.42±0.04l, VE was 9±2l/m and V′ 1±0.2l/s. The inspiratory flow decreased to 0.49±0.1l/s for ACV5, with VE 9±3. In PS the assist for maximum muscle rest (PS1) was 15±5cmH2O, and decreased to 9±4cmH2O in PS5, without significant changes in V′ 0.8±0.1 versus 0.8±0.04l/s; VE was higher than with the other modes, 10±3l/m (Fig. 1).
Characteristics of the patients, respiratory mechanics and prognosis.
| No | Sex | Age (years) | Apache II upon admission | Days MV | Diagnosis | Esr cmH2O/l | Rsr cmH2O/l/s | Ept cmH2O/l | Rpt cmH2O/l/s | PEEPi cmH2O | Outcome |
|---|---|---|---|---|---|---|---|---|---|---|---|
| 1 | M | 74 | 29 | 40 | PostOP abd-ARDS | 30 | 8 | 10 | 0.4 | 1 | Discharge |
| 2 | F | 48 | 17 | 35 | Peritonitis ARDS | 21 | 10 | 9 | 0.9 | 7 | Death |
| 3 | F | 55 | 16 | 25 | Pancreatitis-ARDS | 36 | 9 | 11 | 0.6 | 0 | Discharge |
| 4 | F | 70 | 22 | 1 | ECRF | 12 | 7 | 4 | 0.6 | 4 | Discharge |
| 5 | F | 65 | 23 | 25 | ECRF | 28 | 22 | 15 | 1 | 20 | Discharge |
| 6 | F | 20 | 16 | 1 | Asthma | 20 | 13 | 2 | 0.5 | 2 | Discharge |
| 7 | F | 55 | 22 | 7 | PostOP neurosurgery | 16 | 10 | 4 | 0.6 | 0 | Discharge |
| 8 | F | 62 | 20 | 7 | Sepsis abd ARDS | 31 | 11 | 7 | 3.5 | 0 | Discharge |
| 9 | M | 40 | 15 | 70 | Pneumonia ARDS | 40 | 31 | 14 | 3.2 | 14 | Discharge |
| 10 | F | 55 | 6 | 10 | Pneumonia ARDS | 19 | 21 | 5 | 2.1 | 0 | Discharge |
Abd: abdominal; Ept: elastance of the thoracic wall (cmH2O/l); Esr: elastance of the respiratory system (cmH2O/l); ECRF: exacerbated chronic respiratory failure; PEEPi: dynamic autoPEEP (cmH2O); PostOP: postoperative; Rpt: resistances of the thoracic wall (cmH2O/l/s); Rsr: total resistances of the respiratory system (cmH2O/l/s); ARDS: acute (adult) respiratory distress syndrome; MV: mechanical ventilation.
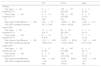
 and calculated signals (Pmus, vol) in CPAP, ACV and PS. With low assist, the respiratory variation of calculated esophageal and muscle pressure is evident and of greater amplitude than with high assist. The amplitude of both is different, however. In this case measurement is difficult: in the case of esophageal pressure due to the oscillation caused by the heart beat, and in the case of calculated pressure muscular due to oscillations or “spikes” caused by changes in inspiratory flow. ACV1: assist control ventilation with flow 0.95l/s; ACV5: assist control ventilation with flow 0.75l/s; CPAP: continuous positive airway pressure 5cmH2O; F: flow (l/s); Pes: esophageal pressure; Pmus: calculated muscle pressure (cmH2O); PS5: pressure support of 8; PS1: 16cmH2O with PEEP 4cmH2O; Paw: airway pressure; Vol: volume (l).")
Representative example, recorded (Paw, Pes, IF) and calculated signals (Pmus, vol) in CPAP, ACV and PS. With low assist, the respiratory variation of calculated esophageal and muscle pressure is evident and of greater amplitude than with high assist. The amplitude of both is different, however. In this case measurement is difficult: in the case of esophageal pressure due to the oscillation caused by the heart beat, and in the case of calculated pressure muscular due to oscillations or “spikes” caused by changes in inspiratory flow. ACV1: assist control ventilation with flow 0.95l/s; ACV5: assist control ventilation with flow 0.75l/s; CPAP: continuous positive airway pressure 5cmH2O; F: flow (l/s); Pes: esophageal pressure; Pmus: calculated muscle pressure (cmH2O); PS5: pressure support of 8; PS1: 16cmH2O with PEEP 4cmH2O; Paw: airway pressure; Vol: volume (l).
The variables measured in Pes and Pmus are shown in Table 2. The increase in respiratory assist reduced the measured and calculated effort to a significant degree (p<0.001). On comparing these measurements in each ventilation mode, the mean differences did not prove significant, but the concordance analysis reflected important dispersion (Table 3). Accordingly, the variation between the measurement and calculation of effort could be 16cmH2O for respiratory variation and 264cmH2O·s/m in PTPm (Figs. 2 and 3). These differences were not influenced by the amplitude of effort, but the percentage error between the measurements and calculations was smaller with low assist levels (CPAP, ACV5, PS5).
Variables referred to effort measured in all data, assist 100% (ACV1 and PS1) and assist ≤50% (CPAP, PS5, ACV5).
| CPAP | ACV5 | ACV1 | PS5 | PS1 | |
|---|---|---|---|---|---|
| ΔPes | 11±3 | 6±3 | 5±3 | 9±6 | 7±7 |
| ΔPmus | 16±5 | 10±6 | 5±3 | 10±6 | 5±4 |
| PTPes.es | 213±87 | 96±91 | 23±24 | 206±121 | 108±100 |
| PTPmus.m | 293±117 | 156±84 | 24±32 | 233±121 | 79±90 |
Delta: respiratory variation; Pes: esophageal pressure; Pmus: calculated muscle pressure (cmH2O); PTP, pressure-time product per cycle (cmH2O/s); PTPm: pressure-time product per minute (cmH2O·s/m).
Descriptive statistics and concordance.
| PTP | PTPm | Delta | |
|---|---|---|---|
| All data | |||
| Pes, mean±SD Quartile 25–75 | 9±1 (1–9) | 130±110* (22–223) | 8±5 (3–10) |
| Pmus, mean±SD Quartile 25–75 | 9±14 (1–11) | 155±133 (23–256) | 9±6 (3–14) |
| R | 0.92 | 0.87 | 0.72 |
| Bias (mean of the difference±SD) | 0.23±6.7 | −23.69±66.3 | −0.98±4.4 |
| 2SD (95% confidence interval) | 13.17–13.63 | 108.91–156.29 | 7.82–9.78 |
| Assist 100% | |||
| Pes, mean±SD Quartile 25–75 | 11±24 (0.8–7) | 66±83 (22–223) | 6±5 (3–10) |
| Pmus (mean±SD) Quartile 25–75 | 9±19 (0.5–8) | 51±71 (23–256) | 5±3 (3–14) |
| Bias (mean of the difference±SD) | −2.14±9.00 | −14.25±62.59 | −1.08±4.62 |
| 2SD (95% confidence interval) | 15.86–20.14 | 110.93–139.44 | 8.16–10.32 |
| Assist <50% | |||
| Pes (mean±SD) Quartile (25–75) | 7±4* (4–10) | 176±108* (74–268) | 9±4* (6–11) |
| Pmus (mean±SD) Quartile 25–75 | 9±4 (6–11) | 234±119 (119–344) | 12±6 (8–16) |
| Bias (mean of the difference) | 2.50±2.03 | 57.85±49.62 | −2.95±3.33 |
| 2SD (95% confidence interval) | −1.56 6.56 | −41.39 157.09 | −3.71 9.61 |
Bias or systematic error; SD: standard deviation; Delta: respiratory variation; Pes: esophageal pressure; Pmus: calculated muscle pressure (cmH2O); PTP, pressure-time product per cycle (cmH2O/s); PTPm: pressure-time product per minute (cmH2O·s/m); R: coefficient of correlation. Confidence interval or random error.
. Delta Pe-Pmus.")
. PTPPe-Pmus.")
The results of our study indicate that the calculated respiratory effort does not allow us to infer the measured value in Pes. These differences may be due to a number of factors, particularly the parameters that intervene in the calculation of Pmus, the accuracy of the respiratory mechanics measurements, and their validity in the presence of muscle effort. The measurement of Pes and the transmission of effort to the airway may also exert an influence.
The calculated Pmus signal depends on the respiratory mechanics parameters (E and R) that intervene in the equation of movement.19,20 Any measurement method has limitations, since these parameters can change from one respiratory cycle to another, even with deep sedation.21 In practice, the most widely used method is inspiratory and expiratory occlusion, based on a mathematical model that assumes the absence of effort.22 We used a previously validated model under spontaneous breathing,23 assisted ventilation13,24 and controlled ventilation.25 The differences observed between measured and calculated effort were similar to those published elsewhere using this approach based on a simple mechanical method.26 More complicated methods have failed to improve the results. In ventilation with PS,27,28 respiratory effort calculated with Pmus and other ventilation variables may differ with respect to the measured value by up to 7j/m (normal 5–10j/m). Experimental studies using complex mathematical algorithms have reported differences of 0.3j/l.29 In patients with proportional assisted ventilation, the difference in measured and calculated respiratory effort may be 5cmH2O/s,11 which is high on considering the acceptable limit in mechanical ventilation (4cmH2O/s17). In this ventilation mode greater similarity between the two signals was to be expected. By definition, in proportional assisted ventilation, pressure and flow are proportional to the calculated respiratory effort,30 and the respiratory mechanics measurements are periodic.18
The conditions of the respiratory mechanics measurements may exert and influence. These parameters are estimated in passive ventilation and may change under conditions of spontaneous respiration,31 limiting their usefulness for calculating muscle effort.32,33 Thus, after failed respirator weaning, a decrease in compliance has been observed, with an increase in resistances and PEEPi.34,35 However, these results have not been confirmed in other studies in patients requiring mechanical ventilation due to chronic obstructive pulmonary disease (COPD) and acute respiratory distress syndrome (ARDS).36 Differences in the respiratory pattern may modify the respiratory mechanics in assisted ventilation, due to the dependency of elastance and resistance upon volume and flow respectively.37 The high inspiratory flow used for passive ventilation may overestimate the inspiratory resistances, and the calculated Pmus therefore will be greater than Pes.
Other factors can influence the differences between calculated and measured respiratory muscle effort. The fact that Pes does not adequately represent pleural pressure and/or the respiratory effort does not modify Paw. The Pes is a point pressure value and might not reflect the global lung surface. Thus, in the presence of lung zones with different mechanical characteristics, pleural pressure will not only exhibit a gravitation distribution and will prove more heterogeneous, as has been evidenced in individuals with COPD38 and recently in patients with ARDS.39 In these cases, respiratory effort produces a redistribution of the air at the start of inspiration, without changes in volume, and Pes does not represent pleural pressure, particularly in dependent zones. On the other hand, respiratory effort might not generate a proportional pressure change in the airway, and consequently calculated Pmus will not represent the change in pleural or esophageal pressure. In healthy individuals, the change in alveolar pressure during inspiration is similar to the change in Paw, though there may be inter-individual differences of up to 12%.40 However, when airway resistance is increased (COPD), respiratory effort does not adequately transmit to the airway, as has been demonstrated following electrical stimulation of the phrenic nerve,41 and respiratory effort is underestimated.19,38 Likewise, in the presence of low lung compliance, respiratory effort causes compression of the inhaled gas, with few changes in lung volume and a disproportion between Pes and the airway.42 Our results show that in the presence of high assist and weak effort, the measured Pes is greater than the calculated value. In other words, in the case of high assist, minor effort does little to modify Paw in ACV or inspiratory flow in PS. In contrast, in the case of low assist, with high muscle effort, the calculated pressure exceeds the measured value, due to the aforementioned causes.
The main limitation of our study is the heterogeneity of the group of patients involved. Although they were undergoing weaning from the respirator, the respiratory mechanics and days of mechanical ventilation differed greatly. A larger and/or stratified sample could improve the results obtained in this regard.
In conclusion, the pressure and flow curves of the respirator allow us to assess the changes in respiratory muscle effort on modifying the ventilation parameters, but not to quantify their amplitude.
Contribution of the authorsFrancisco Ruiz-Ferrón: Preparation of the protocol, registries in 5 patients, analysis of the data and preparation of the manuscript.
Jose Manuel Serrano-Simón: Preparation of the protocol, registries in 5 patients, analysis of the data and preparation of the manuscript.
Financial supportNone declared.
Conflicts of interestNone declared.
Please cite this article as: Ruiz Ferrón F, Serrano Simón JM. La monitorización convencional no es suficiente para valorar el esfuerzo respiratorio durante la ventilación asistida. Med Intensiva. 2019;43:197–206.

