


To design a mortality indicator in acute coronary syndrome (ACS) in the intensive care unit (ICU).
DesignA multicenter, observational descriptive study was carried out.
ParticipantsPatients with ACS admitted to the ICUs included in the ARIAM-SEMICYUC registry between January 2013 and April 2019.
InterventionsNone.
Main variables of interestDemographic parameters, time of access to the healthcare system, and clinical condition. Revascularization therapy, drugs and mortality were analyzed. Cox regression analysis was performed, followed by the design of a neural network. A receiver operating characteristic curve (ROC) was plotted to calculate the power of the new score. Lastly, the clinical utility or relevance of the ARIAM indicator (ARIAM’s) was assessed using a Fagan test.
ResultsA total of 17,258 patients were included in the study, with a mortality rate of 3.5% (n = 605) at discharge from the ICU. The variables showing statistical significance (P < .001) were entered into the supervised predictive model, an artificial neural network. The new ARIAM’s yielded a mean of 0.0257 (95%CI: 0.0245−0.0267) in patients discharged from the ICU versus 0.27085 (95%CI: 0.2533−0.2886) in those who died (P < .001). The area under the ROC curve of the model was 0.918 (95%CI: 0.907−0.930). Based on the Fagan test, the ARIAM’s showed the mortality risk to be 19% (95%CI: 18%–20%) when positive and 0.9% (95%CI: 0.8%–1.01%) when negative.
ConclusionsA new mortality indicator for ACS in the ICU can be established that is more accurate and reproducible, and periodically updated.
Diseñar un Indicador de Mortalidad del síndrome coronario agudo (SCA) en el servicio de medicina intensiva (SMI).
DiseñoEstudio descriptivo observacional multicéntrico
ParticipantesPacientes con SCA ingresados en SMI incluidos en el registro ARIAM- SEMICYUC entre enero de 2013 y abril de 2019.
IntervencionesNinguna.
Variables de interés principalesLas variables analizadas fueron demográficas, tiempo de acceso al sistema sanitario y estado clínico. Se analizó la terapia de revascularización, los fármacos y la mortalidad. Se realizó un análisis de regresión logística de COX y posteriormente se diseñó una red neuronal. Se elaboró una curva ROC para calcula la potencia del nuevo score. Finalmente, la utilidad clínica o relevancia del Indicador ARIAM’s se evaluará mediante un Gráfico de Fagan.
ResultadosSe incluyeron 17.258 pacientes, con una mortalidad al alta del SMI del 3.5% (605). Las variables analizadas con significación estadística (P < .001) fueron introducidas en el modelo predictivo supervisado, una red neuronal artificial. El nuevo indicador ARIAM’s mostro una media de 0.0257 (95%IC 0.0245−0.0267) en los pacientes dados de alta de UCI y de 0.27085 (95%IC 0.2533−0.2886) en los que fallecieron, P < .001. El área ROC del modelo conseguido fue de 0.918 (95% IC: 0.907−0.930). El test de Fagan, se demostró que el Indicador ARIAM’s muestra que la probabilidad de exitus del 19% (95% IC: 18%–20%) cuando es positivo y de 0.9% (95% IC: 0.8%–1.01%) cuando es negativo.
ConclusionesEs posible crear un nuevo indicador de mortalidad del SCA en el SMI que sea más exacto, reproducible y actualizable periódicamente.
Since ancient times, knowing the patient’s prognosis has been one of the main objectives in Medicine. Risk stratification dates back to the early days of intensive care medicine, with the use of different specific scales or scores validated for each type of disease condition. At present, the most widely used tools in this regard are the APACHE and SOFA scores, while in the concrete setting of the Coronary Unit, the most commonly used scores are the GRACE (Global Registry of Acute Coronary Events) or TIMI (Thrombolysis in Myocardial Infarction).1
Acute coronary syndrome (ACS) is frequently seen in the Department of Intensive Care Medicine (DICM), and by the year 2049, its incidence is expected to increase in Spain as a result of progressive aging of the population, exceeding 175,000 cases/year.2,3
In recent decades, one of the main aims of experts in intensive care has been the development and subsequent validation of predictive models, with a view to adapting treatment to individual risk status, avoiding needless costs, and planning secondary prevention strategies.1
Unfortunately, the existing coronary patient stratification scales are far from perfect.1 They all have considerable limitations that evidence the need to establish an indicator or algorithm capable of adapting to the contemporaneous population in an individualized and effective manner.
Traditionally, the reference scores in ACS have been the GRACE and TIMI, which are very useful and afford good mortality discriminating capacity, with low areas under the receiver operating curve (ROC) of close to 1. Nevertheless, they have important limitations. For example, they make no reference to mortality on admission to the DICM; they have been developed from a highly selected population that is scantly representative of the current population; and they are not adjusted to the therapeutic advances to date (Table 1).1,4
Differences between the contemporaneous ARIAM population versus TIMI and GRACE.
| ARIAM population vs TIMI and GRACE | ||||
|---|---|---|---|---|
| ARIAM | TIMI | GRACE | ||
| STEACS | NSTEACS | STEACS | STEACS/NSTEACS | |
| ECG alterations locator | ||||
| Anterior | 43% | 42.7% | 33.0% | |
| Inferior | 49% | 56.9% | 27.7% | |
| Killip upon admission | ||||
| Killip class IV | 5.9% | 1.2% | 0% | 0.4%–1% |
| Strategies | ||||
| Primary PCI | 81.6% | 0% | 18% | |
| Fibrinolysis | 6.3% | 100% | 16.5% | |
| Late PCI | 5.8% | 26.6% | ||
| Antithrombotic treatments | ||||
| 2nd Antiplatelet agent: | 98.5% | 98.7% | 14% | 31.8% |
| Clopidogrel | 35.2% | 50.8% | ||
| Prasugrel | 8.0% | 2.3% | ||
| Ticagrelor | 55.3% | 45.6% | ||
| IIb/IIIa Antagonists | 5.7% | 1.3% | 3.0% | 18% |
| Clinical course | ||||
| Maximum Killip class | 12.6% | 6.5% | ||
| I | 73.9% | 75.7% | 1.3% | |
| II | 11.1% | 11.2% | ||
| III | 4.1% | 8.6% | ||
| IV | 10.9% | 4.4% | ||
| Infarction or reinfarction | 2.3% | 2.4% | 5.2% | 28.6%* |
| Heart surgery | 1.3% | 2.9% | 5.5% | 5% |
| Hospital stay and mortality | ||||
| Stay (days) | ||||
| Mean | 6.4 | 8.2 | 10.5 | |
| Median | 4.52 | 5.76 | 6−8 | |
| Hospital mortality | 8.0% | 4.0% | 6.0%** | 4.6% |
The ARIAM registry is a multicenter (national) observational registry characterized by voluntary participation (Annex 1) and with an annual cross-section (3 months), created by the Spanish Society of Intensive and Critical Care Medicine and Coronary Units (Sociedad Española de Medicina Intensiva, Crítica y Unidades Coronarias [SEMICYUC]). The registry was created in 1994, and in 2010 became known as the ARIAM-SEMICYUC registry. It is integrated within the Cardiological Intensive Care and Cardiopulmonary Resuscitation working group of the SEMICYUC, and seeks to improve patient care in the field of ischemic heart disease. At present, it is the largest Spanish registry in this field, with an average of 2335 new registries a year and a current total of 23,357 registries.5,6
The optimum method for designing adequate scores remains unclear. In their article published in Medicina Intensiva, Nuñez et al. described intensive care medicine as an ideal field for the application of big data analysis (BDA) and machine learning (ML) techniques, which in the future may improve clinical research and allow more precise patient treatment. Artificial neural networks are a clear example of this.7-12
The aim of the present study was to design a mortality indicator for all forms of ACS in the Intensive Care Unit (ICU) (ARIAM indicator [ARIAM’s]), based on the variables that may be available at the time of patient admission to the ICU, employing the data of the ARIAM registry, and using a supervised predictive model (neural network).
Material and methodsStudy settingThe ARIAM – SEMICYUC database complies with Spanish legislation on post-authorization observational studies (Order SAS/3470/2009, of 16 December) and the Data Protection Act. In May 2012 it was recognized by the Spanish Ministry of Health as a registry of interest for the National Health System; accordingly, no express patient authorization or informed consent was required for the present study.
In all cases, data input guarantees patient anonymity, ensuring that the patients cannot be identified, and is carried out using a software application that can be accessed at: https://ariam.investigacion-intensivos.org/. The data are entered by those investigators who previously request participation in the registry and possess the corresponding login and password.
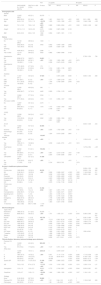
Patients and participantsAn observational study was carried out based on the ARIAM registry («ARIAM database») (Fig. 1). The study included patients admitted with a diagnosis of ACS (less than 48 h from symptoms onset) between January 2013 and April 2019 in the Spanish ICUs that collaborate in the registry.
Conventional statistical analysis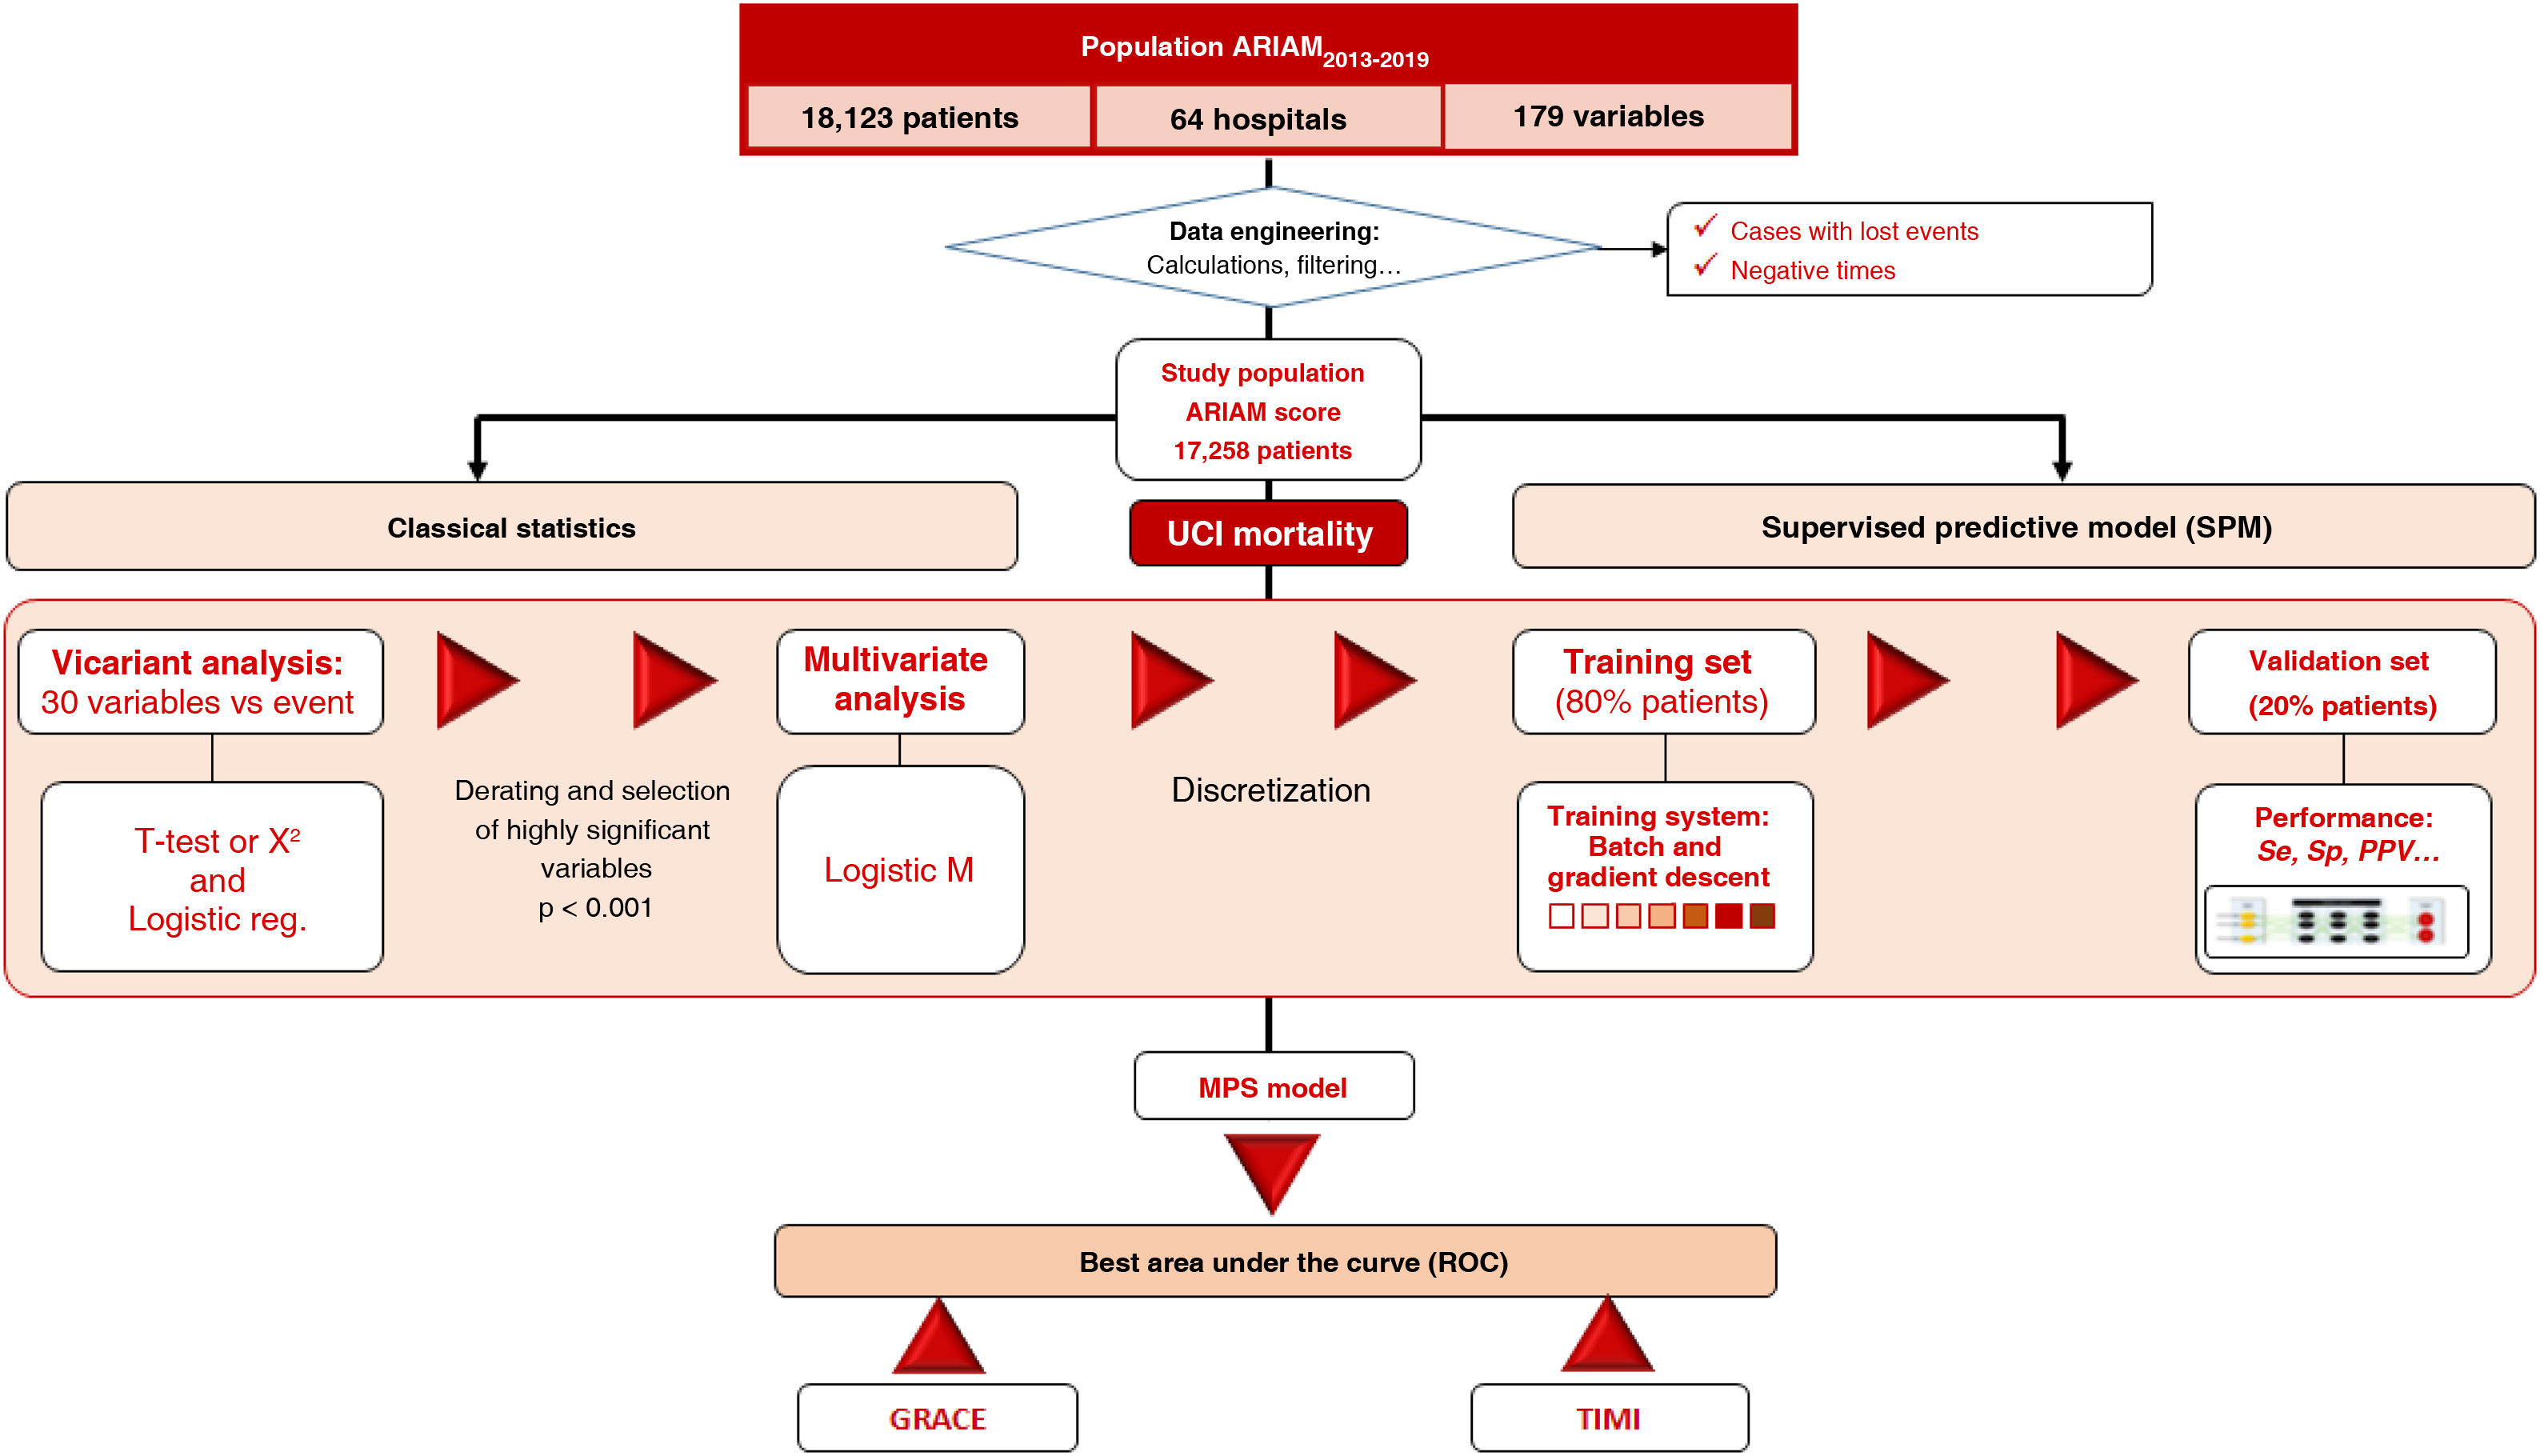
In a first step, the data of the ARIAM database were processed (Data Engineering). This procedure included case filtering, the recording of both continuous and categorical variables, and the creation of synthetic attributes (grouping, operators, combination, calculations and recording of times). Sociodemographic data, vital signs, laboratory test results, the treatments and techniques used, and the place of medical care were recorded. In addition, data referred to the diagnosis upon admission and mortality were collected. Times were calculated according to the registered hours and dates. All patients with any missing information were excluded.
The study endpoint was defined as all-cause mortality in the DICM. A conventional descriptive and inferential (uni- and multivariate) statistical analysis of the data was performed, both globally and with respect to the study endpoint. Continuous variables were reported as the mean and standard deviation (SD), and were compared using the Student t-test or nonparametric Mann-Whitney U test Categorical variables in turn were reported as absolute values and percentages, and were compared using the chi-square test. Posteriorly, those variables found to be significant in the univariate analysis were entered in a multivariate Cox logistic regression analysis. The variables found to be significant in the multivariate analysis were used to design an artificial neural network (ANN) (Annexes 2 and 3).
Neural network and ARIAM’sThe Supervised Predictive Model (SPM) used was the back-propagation Multilayer Perceptron (MLP). In the model, the data were randomly divided into a training set (80%) and a validation set (20%). The hyperbolic tangent transfer functions were used in the hidden layers, and softmax in the output layer. The gradient descents were used to estimate the synaptic weights and biases. The initial learning rate was 0.4, and the momentum was 0.9. The ARIAM indicator or score (ARIAM’s) was taken to be the value of the neuron of the output layer determining death.
Sensitivity analysis of the variables included in the network was used to determine the importance value (IV) in relation to prediction of the study endpoint or event and its normalized value (IVn).
Performance measuresThe power of the SPM in predicting patient survival was estimated using performance measures (sensitivity, specificity, precision, predictive values, likelihood ratios), with calculation of the area under the ROC curve. The new indicator obtained (ARIAM’s) was compared against the GRACE and TIMI based on the area under the ROC curve. The clinical usefulness or relevance of the indicator in turn was assessed from a Fagan plot, which estimates the post-test probability of the target condition in an individual patient based on a previously selected test probability.
The IBM® SPSS® version 22.0 statistical package (©Copyright IBM Corp. 1989–2013, Chicago, IL, USA) was used for data processing, and IBM® Neural Network version 25.0 was used to design and validate the artificial neural network. Statistical significance was considered for p < 0.05.
ResultsThe study included a total of 18,123 patients with ACS admitted to the DICM. Of these, 865 were excluded due to missing information or data compilation error. The patients corresponded to 64 Spanish hospitals of all levels and distributed throughout the country. The global mortality rate of the included patients was 3.5% (n = 603).
Thirty variables were analyzed (Table 2), including sociodemographic data, vital signs upon admission, laboratory test parameters, treatments and techniques used, and place of care, etc. In the group of patients that died, 4.6% were females, and the mean age was 73.5 ± 11 years versus 64.8 years among the patients that were discharged. In turn, 4.1% of the patients presented arterial hypertension, 3.6% dyslipidemia, 4.3% had electrocardiographic (ECG) alterations consistent with ST-elevation ACS (STEACS), and 36% presented Killip class IV. The mean systolic blood pressure was 110.9 ± 35 mmHg, with a heart rate of 87 ± 27 bpm, creatinine 1.62 ± 1.3 mg/dl and hemoglobin 12.6 ± 2.3 g/dl. The management strategy consisted of primary percutaneous coronary intervention (PCI) (3.5%) or fibrinolysis (6.1%).
Variables included in the study.
| Variable | Definition and clarifying notes | Categories (limits) |
|---|---|---|
| Sociodemographic data | ||
| Age | Variable calculated from admission and birth dates | Between 18–110 years |
| Gender | Patient gender at birth | Male/female |
| Weight | Estimated weight (kg) | Between 25−250 kg |
| Height | Estimated height (cm) | Between 60−230 cm |
| History and coronary risk factors | ||
| Family history | History of early coronary disease in first-degree relatives or siblings (<55 years in males or <65 years in females): angina, myocardial infarction, sudden death of unknown cause, aortocoronary bypass surgery or PCI | • Unknown/doubtful |
| • Yes | ||
| • No | ||
| Smoking | Non-smoker (never smoked or ex-smoker for over 20 years) Current smoker (smoker of some cigarettes in the last 30 days) | • Unknown |
| • Non-smoker | ||
| • Current smoker (last month) | ||
| • Ex-smoker (<1 year) | ||
| • Ex-smoker (>1 year) | ||
| Arterial hypertension | Any of the following: | • Unknown/doubtful |
| 1. History of arterial hypertension in medical records, or treatment with drugs, diet and/or exercise to control blood pressure | • Yes | |
| 2. Previously documented systolic blood pressure ≥140 mmHg and/or diastolic blood pressure ≥90 mmHg in patients without diabetes or chronic renal failure, or systolic blood pressure ≥130 mmHg and/or diastolic blood pressure ≥80 mmHg on at least 2 occasions in patients with diabetes or chronic renal failure | • No | |
| 3. Current treatment for arterial hypertension | ||
| Dyslipidemia | History of dyslipidemia in medical records, previous or current treatment with cholesterol-lowering drugs or documented cholesterol >200 mg/dl or LDL-cholesterol ≥ 130 mg/dl or HDL-cholesterol <40 mg/dl in males and <50 mg/dl in females | • Unknown/doubtful |
| • Yes | ||
| • No | ||
| Diabetes | History of diagnosed and/or treated diabetes Criteria of the American Diabetes Association: | • Unknown/doubtful |
| 1. Glycosylated hemoglobin ≥6.5%; or 2. Fasting glucose ≥126 mg/dl; or 3. Glucose 2-h ≥200 mg/dl in glucose tolerance test; or 4. In patients with classical hyperglycemia symptoms, hyperglycemic crisis, a random glucose value ≥200 mg/dl | ||
| Type I diabetes: History of type I diabetes in the medical records and/or the patient meets the WHO criteria | • Type I diabetes | |
| Type II diabetes: History of type II diabetes in the medical records and/or the patient meets the WHO criteria | • Type II diabetes | |
| Cocaine | Recent (7 days) use of cocaine and/or positive urine test | • Unknown/doubtful |
| • Yes | ||
| • No | ||
| Chronic obstructive pulmonary disease | Diagnosis (confirmed or suspected) of asthma or COPD reflected in the medical records | • Unknown/doubtful |
| • Yes | ||
| • No | ||
| ACVA | History of stroke reflected in the medical records | • Yes, ischemic |
| • Yes, hemorrhagic | ||
| • Yes, non-specified | ||
| • No | ||
| • Unknown/doubtful | ||
| Peripheral arterial disease | History of obstructive aortofemoral arterial disease and/or clinical manifestations of intermittent claudication (not studied) | • Unknown/doubtful |
| • Yes | ||
| • No | ||
| Previous ischemic heart disease | Evidence or knowledge of symptoms, acute myocardial infarction or other equivalents suggestive of cardiac ischemia before the acute event | • Unknown/doubtful |
| • Yes | ||
| • No | ||
| Heart failure | Clinical diagnosis reflected in the medical records, or suggestive symptoms such as dyspnea in response to minor exertion, recurrent orthopnea, fluid retention or description or crepitants, jugular ingurgitation or radiological lung edema. Evidence of depressed ejection fraction without clinical signs of heart failure is not sufficient for diagnosing heart failure | • Unknown/doubtful |
| • Yes | ||
| • No | ||
| Chronic renal failure or dialysis | Diagnosis reflected in the medical records and/or creatinine levels prior to admission >1.4 mg/dl | • Unknown/doubtful |
| • Yes | ||
| • No | ||
| PCI or revascularization surgery | Percutaneous coronary intervention (angioplasty, stent and/or thrombus-aspiration) or previous cardiac revascularization surgery | • Unknown/doubtful |
| • Yes | ||
| • No | ||
| Access to system and times | ||
| First medical contact (FMC) | Place of first medical contact | • Physician |
| • Primary care center | ||
| • 061-112 emergency service | ||
| • Hospital emergency room | ||
| • Hospital ward | ||
| • Other | ||
| • Unknown/doubtful | ||
| Origin | Location immediately prior to admission to ICU | • Other hospital |
| • Direct admission | ||
| • Hemodynamics | ||
| • Emergency service | ||
| • Outpatient clinic | ||
| • Ward | ||
| • Operating room | ||
| • Others | ||
| T. Pain/ICU | Time from symptoms onset to ICU admission. Variable calculated from times of symptoms onset and admission to ICU | • Minutes |
| Electrocardiogram | ||
| Type of ACS | NSTEACS: Non-ST elevation acute coronary syndrome | • NSTEACS |
| STEACS: ST elevation acute coronary syndrome or | • STEACS | |
| Presumably acute complete left bundle block | ||
| Type of alteration | Alterations observed in ECG tracing | • ST elevated >2 mm or on >2 leads |
| • ST elevated <2 mm or on <2 leads | ||
| • Trunk/multivessel pattern | ||
| • ST descent ≥0.5 mm | ||
| • ST descent <0.5 mm | ||
| • Transient ST elevation (<20 min) | ||
| Clinical situation, laboratory tests and strategy upon admission | ||
| Cardiac arrest (CA) | • Yes | |
| • No | ||
| Initial Killip class | Specify first determination in ICU | • I |
| • II | ||
| • III | ||
| • IV | ||
| Initial systolic/diastolic blood pressure (mmHg) | Specify first determination in ICU | Systolic 20−250 mmHg and diastolic 20−150 mmHg |
| Initial heart rate | Specify first determination in ICU | Between 0–350 bpm |
| Hemoglobin upon admission | g/l | Between 1–20 |
| Creatinine upon admission | mg/dl | Between 0.1–20 |
| Reperfusion strategy | Reperfusion/treatment strategy | • Primary PCI |
| • Fibrinolysis | ||
| • None | ||
In relation to the study endpoint or event, 19 variables showed very significant differences (P < .001) (Table 3). The type of treatment (primary PCI or fibrinolysis) also proved significant (P < .001).
Conventional statistics: bivariate and multivariate analysis.
| Test | S Logistic | M logistic | |||||||
|---|---|---|---|---|---|---|---|---|---|
| DISCHARGE N = 16,655 (96.5%) | DEATH N = 603 (3.5%) | P-value | RR | 95%CI | P | RR | 95%CI | P | |
| Demographic data | |||||||||
| Gender | |||||||||
| Male | 12,452 (96.9) | 402 (3.1) | 20,076 | 1 | 1 | ||||
| female | 4203 (95.4) | 201 (4.6) | <.001 | 1.481 | 1246−1761 | <.001 | 1022 | 0.81−1.289 | .858 |
| Age | 64.8 ± 13.0 | 73.5 ± 11.0 | −16.070 | 1.005 | 1.003−1.006 | <.001 | 1.058 | 1.048−1.069 | <.001 |
| <.001 | |||||||||
| Weight | 79.1 ± 15.9 | 76.6 ± 14.3 | 3.874 | 0.989 | 0.983−0.994 | <.001 | 1.002 | 0.995−1.009 | .542 |
| <.001 | |||||||||
| Height | 167.2 ± 11.5 | 165.9 ± 9.3 | 2.476 | 0.992 | 0.987−0.998 | .0133 | |||
| .00133 | |||||||||
| BMI | 29.8 ± 23.6 | 28.2 ± 10.5 | 1.692 | 0.994 | 0.987−1.001 | .1110 | |||
| .0906 | |||||||||
| History | |||||||||
| Family history | |||||||||
| No | 13,132 (96.6) | 486 (3.4) | 1.643 | 1 | |||||
| Yes | 2002 (96.4) | 32 (3.6) | .4400 | 0.842 | 0.645–1.099 | .2050 | |||
| D/D | 1521 (96.0) | 85 (4.0) | 0.878 | 0.625–1.236 | .4570 | ||||
| Smoking | |||||||||
| No | 4539 (95.7) | 204 (4.3) | 2.386 | 1 | |||||
| Yes or other | 12,116 (96.8) | 399 (3.2) | .0523 | 0.982 | 0.980−0.998 | .0133 | |||
| Hypertension | 0.769−1.224 | .799 | |||||||
| No | 6598 (97.3) | 182(2.7) | 24.851 | 1 | 1 | ||||
| Yes | 9949 (95.9) | 420 (4.1) | <.001 | 1.530 | 1.283–1.826 | <.001 | 0.970 | ||
| D/D | 108 (99.1) | 1 (0.9) | 0.336 | 0.047–2.418 | .3360 | 1 | |||
| Hyperlipemia | |||||||||
| No | 7721 (96.5) | 277 (3.5) | .170 | 1 | |||||
| Yes | 8741 (96.4) | 318 (3.6) | .9184 | 1.014 | 0.861–1.195 | .8675 | |||
| D/D | 193 (96.1) | 8 (3.9) | 1.155 | 0.564– 2.367 | .6931 | ||||
| Diabetes | |||||||||
| No | 11,547 (97.1) | 340 (2.9) | 47.504 | 1 | 0.597–2.296 | .6460 | 1 | 0.850−1.304 | .638 |
| DM1 | 261 (96.7) | 9 (3.3) | <.001 | 1.171 | 1.509–2.109 | <.001 | 1 | ||
| DM2 | 4711 (94.9) | 248 (5.1) | 1.784 | 0.708–3.694 | .2540 | 1.053 | |||
| D/D | 136 (95.8) | 6 (4.2) | 1.617 | 1 | |||||
| Cocaine | |||||||||
| No | 12,365 (96.4) | 456 (3.6) | .580 | 1 | |||||
| Yes | 4290 (96.7) | 147 (3.3) | .4462 | 0.929 | 0.769−1.123 | .4463 | |||
| IHD | |||||||||
| No | 10,884 (96.7) | 377 (3.3) | 2.054 | 1 | |||||
| Yes | 5771 (96.2) | 226 (3.8) | .1518 | 1.131 | 0.956−1.337 | .1520 | |||
| PCI and/or CABG | |||||||||
| No | 13,687 (96.6) | 481 (3.4) | 4.470 | 1 | |||||
| Yes | 2903 (96.1) | 117 (3.9) | .1070 | 1.147 | 0.933–1.409 | .1923 | |||
| D/D | 65 (92.9) | 5 (7.1) | 2.189 | 0.877– 5.461 | .0930 | ||||
| COPD | |||||||||
| No | 15,298 (96.6) | 540 (3.4) | 6.637 | 1 | |||||
| Yes | 1318 (95.6) | 60 (4.4) | .0362 | 1.290 | 0.982–1.694 | .0674 | |||
| D/D | 29 (90.6) | 3 (9.4) | 2.931 | 0.890– 9.651 | .0770 | ||||
| ACVA | 0.803−1.649 | .444 | |||||||
| No | 15,662 (95.7) | 537 (3.3) | 38.495 | 1 | 1 | ||||
| Ischemic | 715 (92.6) | 57 (7.4) | <.001 | 2.325 | 1.752–3.086 | <.001 | 1.151 | ||
| Hemorrhagic | 60 (100) | 0 (0.0) | |||||||
| D/D | 218 (96.1) | 9 (3.9) | 1.204 | 0.615–2.358 | .5881 | 1 | |||
| Vascular disease | 110.847 | ||||||||
| No | 15,530 (96.9) | 497 (3.1) | <.001 | 1 | 1 | 1.359−2.410 | <.001 | ||
| Yes | 1090 (91.1) | 106 (8.9) | 3.039 | 2.442−3.781 | <.001 | 1.810 | |||
| D/D | 35 (100) | 0 (0) | |||||||
| Heart failure | 1.278−2.364 | <.001 | |||||||
| No | 15,962 (96.9) | 514 (3.1) | 154.002 | 1 | 1 | ||||
| Yes | 665 (88.4) | 87 (11.6) | <.001 | 4.081 | 3.210–5.189 | <.001 | 1.738 | ||
| D/D | 31 (93.9) | 2 (6.1) | 2.004 | 0.478–8.395 | .3487 | 1 | |||
| CRF/ERRT | 15,505 (96.7) | 521 (3.3) | 41.599 | 1.119−2.214 | .009 | ||||
| No | 1133 (93.3) | 82 (6.7) | <.001 | 1 | <.001 | 1 | |||
| Yes | 17 (100) | 0 (0) | 2.154 | 1693−2.740 | 1.574 | ||||
| D/D | 1 | ||||||||
| Access to healthcare system and times | |||||||||
| FMC | 0.958–1.553 | .108 | |||||||
| Primary care | 1992 (98.0) | 102 (2.0) | 20.076 | 1 | 1 | 0.628–1.104 | .202 | ||
| 061 | 3146 (94.1) | 199 (5.9) | <.001 | 3.096 | 2.428–3.947 | <0.001 | 1.220 | 1.146–2.842 | .011 |
| Others | 290 (94.2) | 18 (5.8) | 3.038 | 1.815–5.084 | <0.001 | 0.832 | 0.853–1.861 | .245 | |
| Physician | 516 (94.0) | 33 (6.0) | 3.130 | 2.092–4.683 | <0.001 | 1.804 | |||
| Hospitalization | 600 (91.9) | 53 (8.1) | 4.323 | 3.069–6.089 | <0.001 | 1.260 | |||
| Emergency | 7061 (97.3) | 197 (2.7) | 1.365 | 1.072–1.739 | 0.0116 | 1 | |||
| D/D | 50 (98.0) | 1 (2.0) | 0.979 | 0.134–7.156 | 0.9832 | 1 | |||
| Primary care | |||||||||
| Origin | |||||||||
| OC | 77 (97.5) | 2 (2.5) | 61.256 | 1 | |||||
| Others | 231 (95.9) | 10 (4.1) | .0542 | 1.667 | 0.357–7.775 | 0.5156 | |||
| Hemodynamics | 4252 (96.7) | 147 (3.3) | 1.331 | 0.324–5.471 | 0.6917 | ||||
| Operating room | 32 (97.0) | 1 (3.0) | 1.203 | 0.105–13.74 | 0.8817 | ||||
| Ward | 592 (92.2) | 50 (7.8) | 3.252 | 0.776–13.63 | 0.1068 | ||||
| Emergency | 9022 (97.0) | 280 (3.0) | 1.195 | 0.292–4.889 | 0.8044 | ||||
| OMS | 896 (93.9) | 58 (6.1) | 2.492 | 10.59–10.40 | 0.2103 | ||||
| D/D | 1503 (96.5) | 24 (3.5) | 1.383 | 0.331–5.780 | 0.6565 | ||||
| T. Pain/ICU | 842 ± 1362 | 900.7 ± 1695 | −1.016 | ||||||
| .3098 | |||||||||
| Electrocardiogram | |||||||||
| Type of ACS | |||||||||
| NSTEACS | 7960 (97.4) | 211 (2.6) | 38,256 | 1 | 1 | ||||
| STEACS | 8695 (95.7) | 392 (4.3) | <.001 | 1.701 | 1.435−2.01 | <0.001 | 0.554 | 0.086−3.560 | .534 |
| Alteration | .057 | ||||||||
| Normal | 1178 (99.1) | 11 (0.9) | 165.756 | 1 | 1 | 0.981–3.484 | <.001 | ||
| LBB | 168 (86.2) | 27 (13.8) | <.001 | 17.211 | 8.381–35.34 | <0.001 | 1.849 | 1.757–3.134 | <.001 |
| EST max | 6839 (95.7) | 306 (4.3) | 4.792 | 2.617–8.772 | <0.001 | 2.347 | 1.696–3.774 | <.001 | |
| EST min | 1562 (96.5) | 56 (3.5) | 3.839 | 2.003–7.361 | <0.001 | 2.530 | 1.466–2.843 | ||
| DEST max | 1696 (95.4) | 94 (4.6) | 5.113 | 2.726–9.588 | <0.001 | 2.042 | |||
| DEST min | 1188 (98.0) | 24 (2.0) | 2.163 | 1.055–4.437 | 0.035 | 1 | |||
| D/D | 316 (97.8) | 7 (2.2) | 2.372 | 0.912–6.170 | 0.076 | 1 | |||
| EST transi | 590 (99.0) | 6 (1.0 ) | 1.089 | 0.401–2.960 | 0.867 | 1 | 1308–4.294 | ||
| T negative | 1476 (99.0) | 15 (1.0) | 1.088 | 0.498–2.379 | 0.832 | 1 | |||
| Others | 1134 (96.8) | 38 (3.2) | 3.589 | 0.985–7.056 | 0.539 | 1 | |||
| Trunk | 235 (92.5) | 19 (7.5) | 8.658 | 4.07–18.43 | <0.001 | 2.370 | |||
| Clinical situation, laboratory tests and strategy upon admission | |||||||||
| Previous CA | |||||||||
| No | 16,083 (97.4) | 424 (2.6) | 963.429 | 1 | 1 | ||||
| Yes | 572 (76.2) | 179 (23.8) | <.001 | 11.87 | 9.781−14.40 | <0.001 | 5.735 | 4.370−7.526 | <.001 |
| Killip class | |||||||||
| I | 13,480 (98.9) | 150 (1.1) | 2333.35 | 1 | 3.879–6.447 | 1 | |||
| II | 1887 (97.4) | 105 (5.3) | <.001 | 5.001 | 11.14–17.91 | <0.001 | 2.282 | 1.714–3.038 | <.001 |
| III | 929 (86.4) | 146 (13.6) | 14.123 | 39.94–64.01 | <0.001 | 5.555 | 4.168–7.405 | <.001 | |
| IV | 359 (64.0) | 202 (36) | 50.566 | <0.001 | 9.343 | 6.863–12.72 | <.001 | ||
| Systolic BP | 135.9 ± 28.1 | 110.9 ± 35.5 | 21.240 | 0.969 | 0.966−0.972 | <0.001 | 0.986 | 0.982−0.989 | <.01 |
| <.001 | |||||||||
| HR | 78.2 ± 19.5 | 87.4 ± 27.0 | −11.273 | 1.019 | 1.016−1.022 | <0.001 | 1.010 | 1.006−1.014 | <.01 |
| <.001 | |||||||||
| Hemoglobin | 13.9 ± 1.9 | 12.6 ± 2.3 | 14.111 | 0.772 | 0.744−0.801 | <0.001 | 0.944 | 0.900−0.991 | .021 |
| <.001 | |||||||||
| Creatinine | 1.05 ± 0.7 | 1.62 ± 1.3 | −18.034 | 1.444 | 1.369−1.522 | <0.001 | 1.307 | 1.194−1.431 | <.01 |
| <.001 | |||||||||
| Strategy | |||||||||
| None | 8148 (96.8) | 267 (3.2) | 22.892 | 1 | 1 | ||||
| Previous PCI | 7531 (96.5) | 275 (3.5) | <.001 | 1.12 | 0.94–1.33 | 0.1973 | 1 | 1.136−2.345 | .008 |
| Fibrinolysis | 940 (93.9) | 61 (6.1) | 1.99 | 1.49–2.65 | <0.001 | 1.632 | |||
Test: Chi-square (qualitative) or t-test (quantitative). S Logistic: Simple logistic regression analysis. M Logistic: Multilogistic regression analysis. BMI: Body mass index. IHD: Ischemic heart disease. PCI and/or CABG: Percutaneous coronary intervention and/or coronary artery bypass grafting. COPD: Chronic obstructive pulmonary disease. ACVA: Acute cerebrovascular accident. CRF/ERRT: Chronic renal failure/extrarenal replacement therapy. FMC: First medical contact. OC: Outpatient clinic. OMS: Out-hospital medical service. LBB: Left bundle block. EST max: ST elevation > 2 mm. EST min: ST elevation < 2 mm. DEST max: ST descent > 2 mm. DEST min: ST descent < 2 mm. EST transi: Transient ST elevation. Previous CA: Cardiac arrest.
The new indicator (ARIAM’s) yielded a mean score of 0.0257 (95%CI: 0.0245−0.0267) in the patients discharged from the ICU and of 0.27085 (95%CI: 0.2533−0.2886) among those who died (P < .001). This indicator derived from the softmax function of the output layer can be easily interpreted as a mortality predictor, with a score of 0.0835 indicating a mortality probability of 8.35%.
In the model obtained, all the entered variables showed a certain predictive value, which proved very high (IVn ≥ 20%) for creatinine, Killip class, age, cardiac arrest, systolic blood pressure, vascular disease, heart rate, first medical contact, body weight, hemoglobin, heart failure, ECG and initial management strategy (Fig. 2).
Performance measures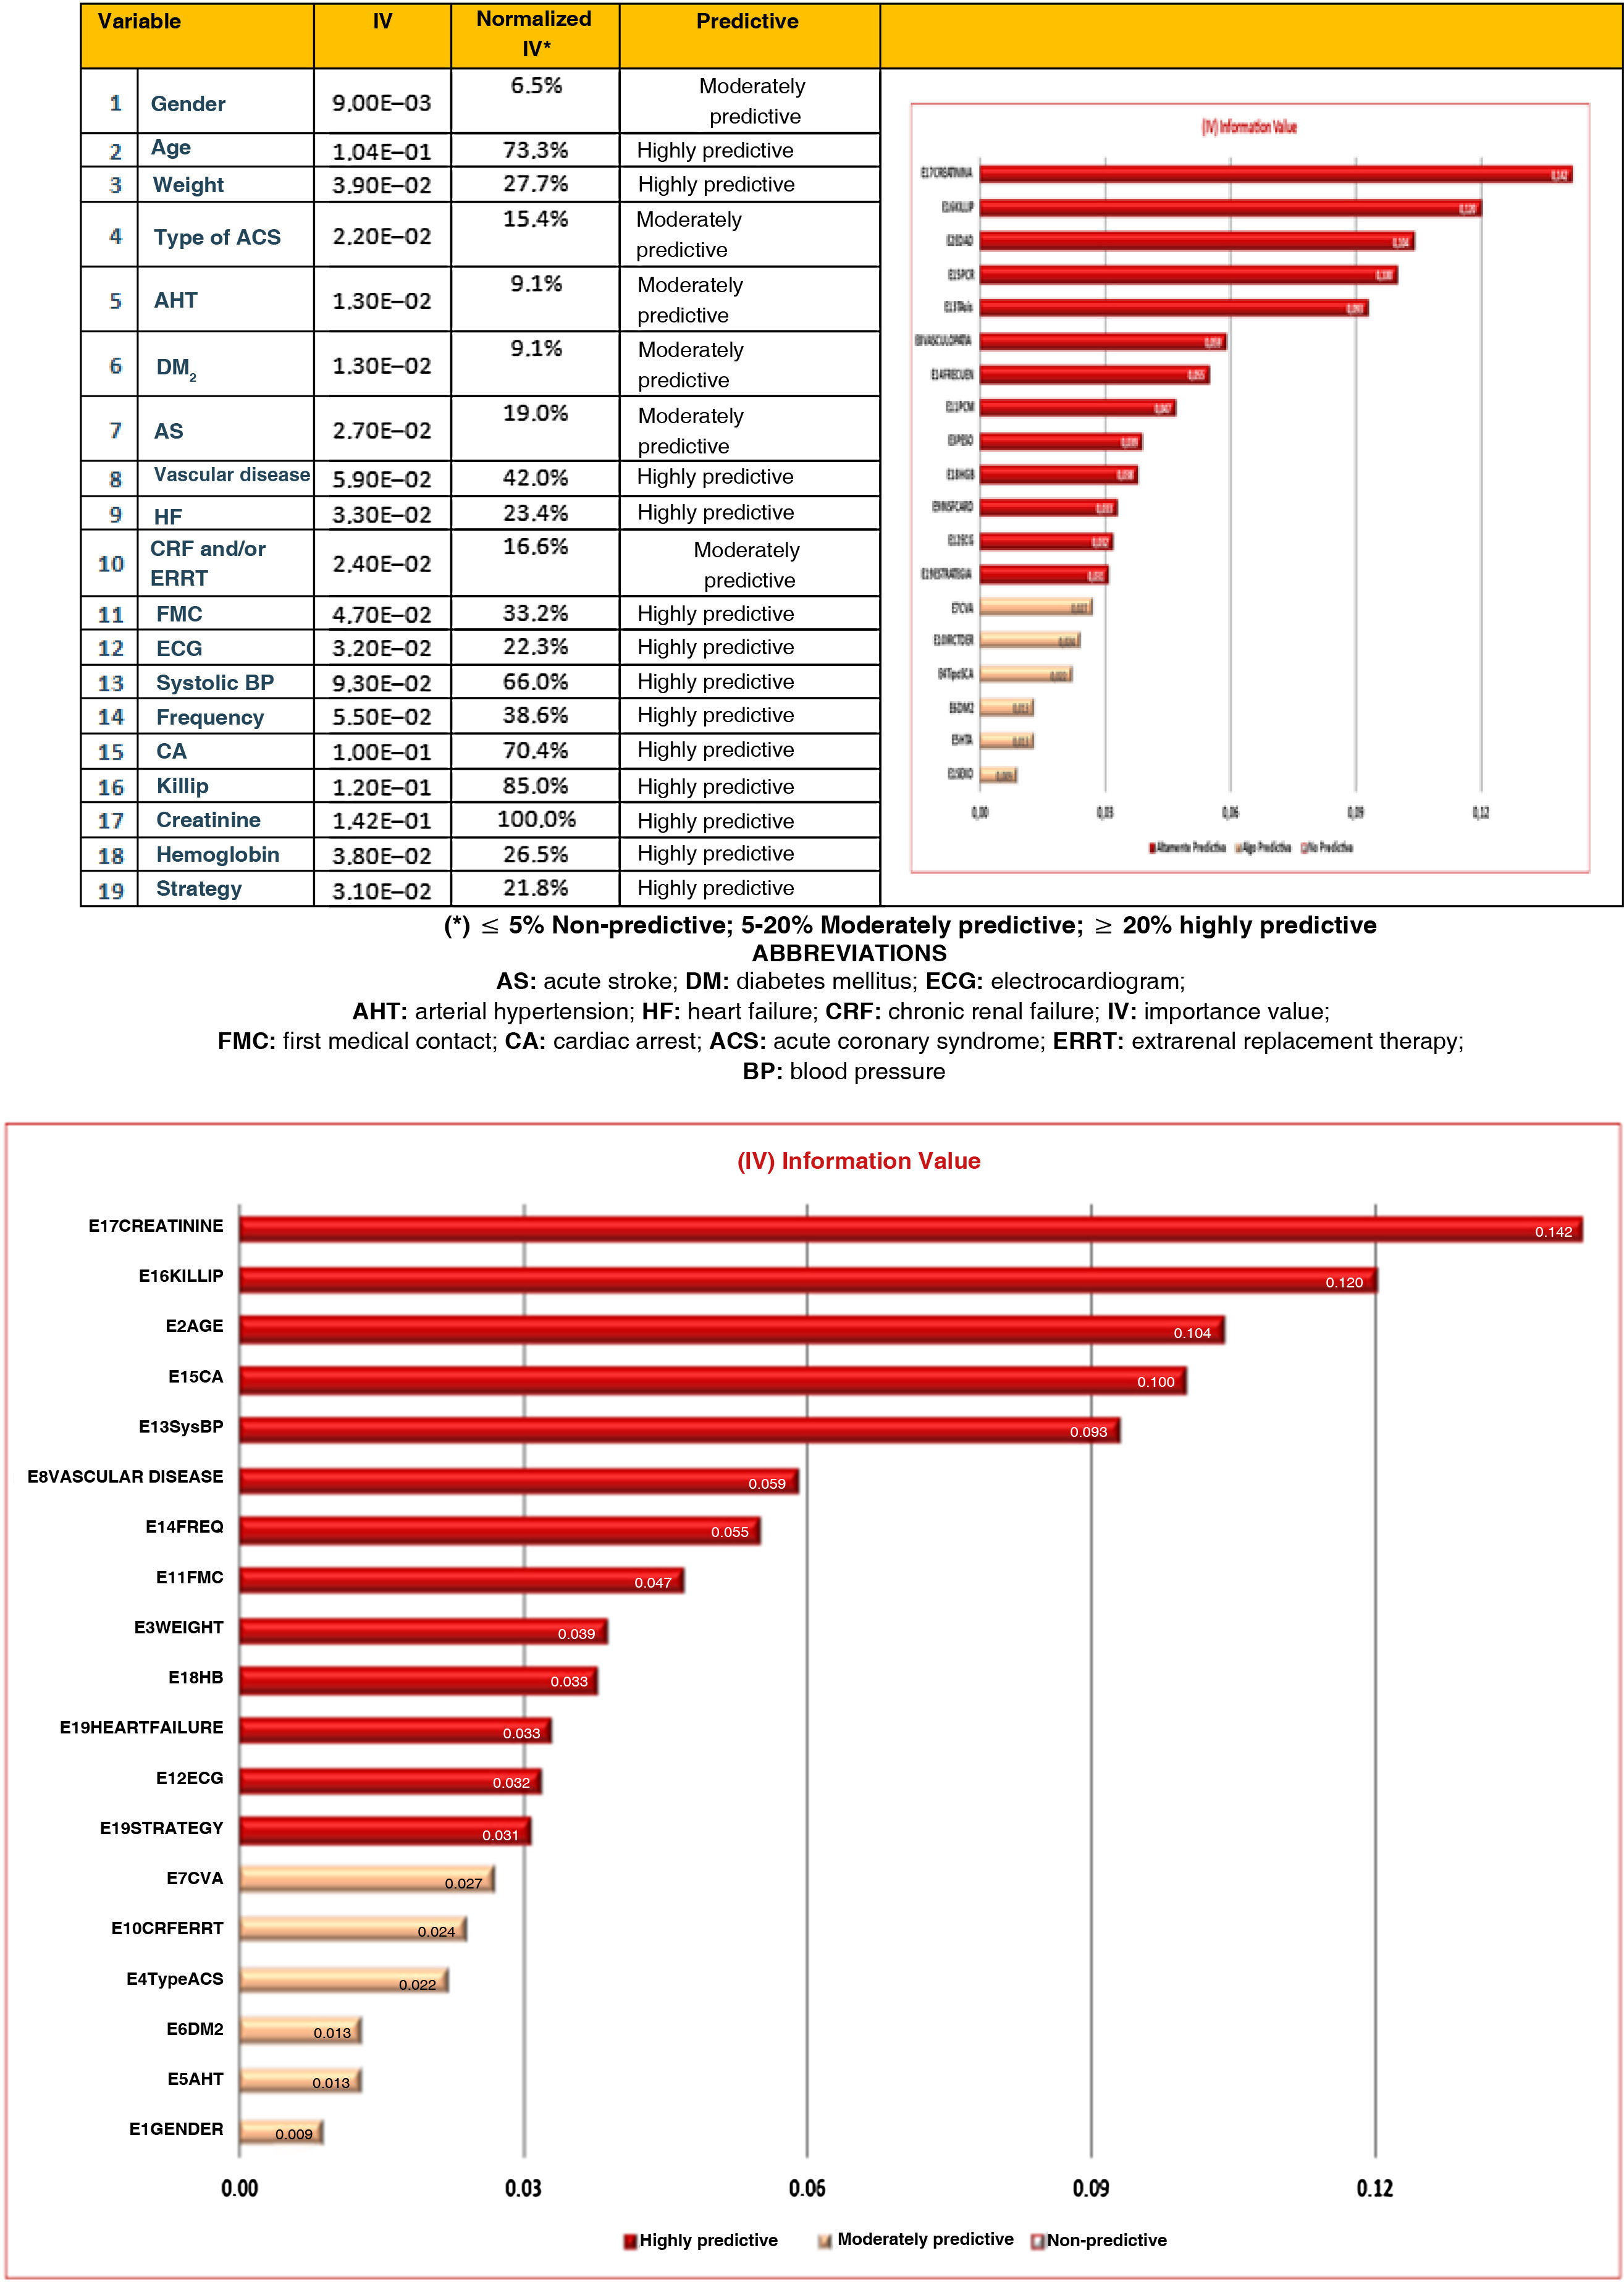
Regarding the performance measures for the entire series (with an indicator cut-off point of > 0.04), specificity was 88.19%, with a negative predictive value of 99.19% (Annex 5).
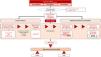
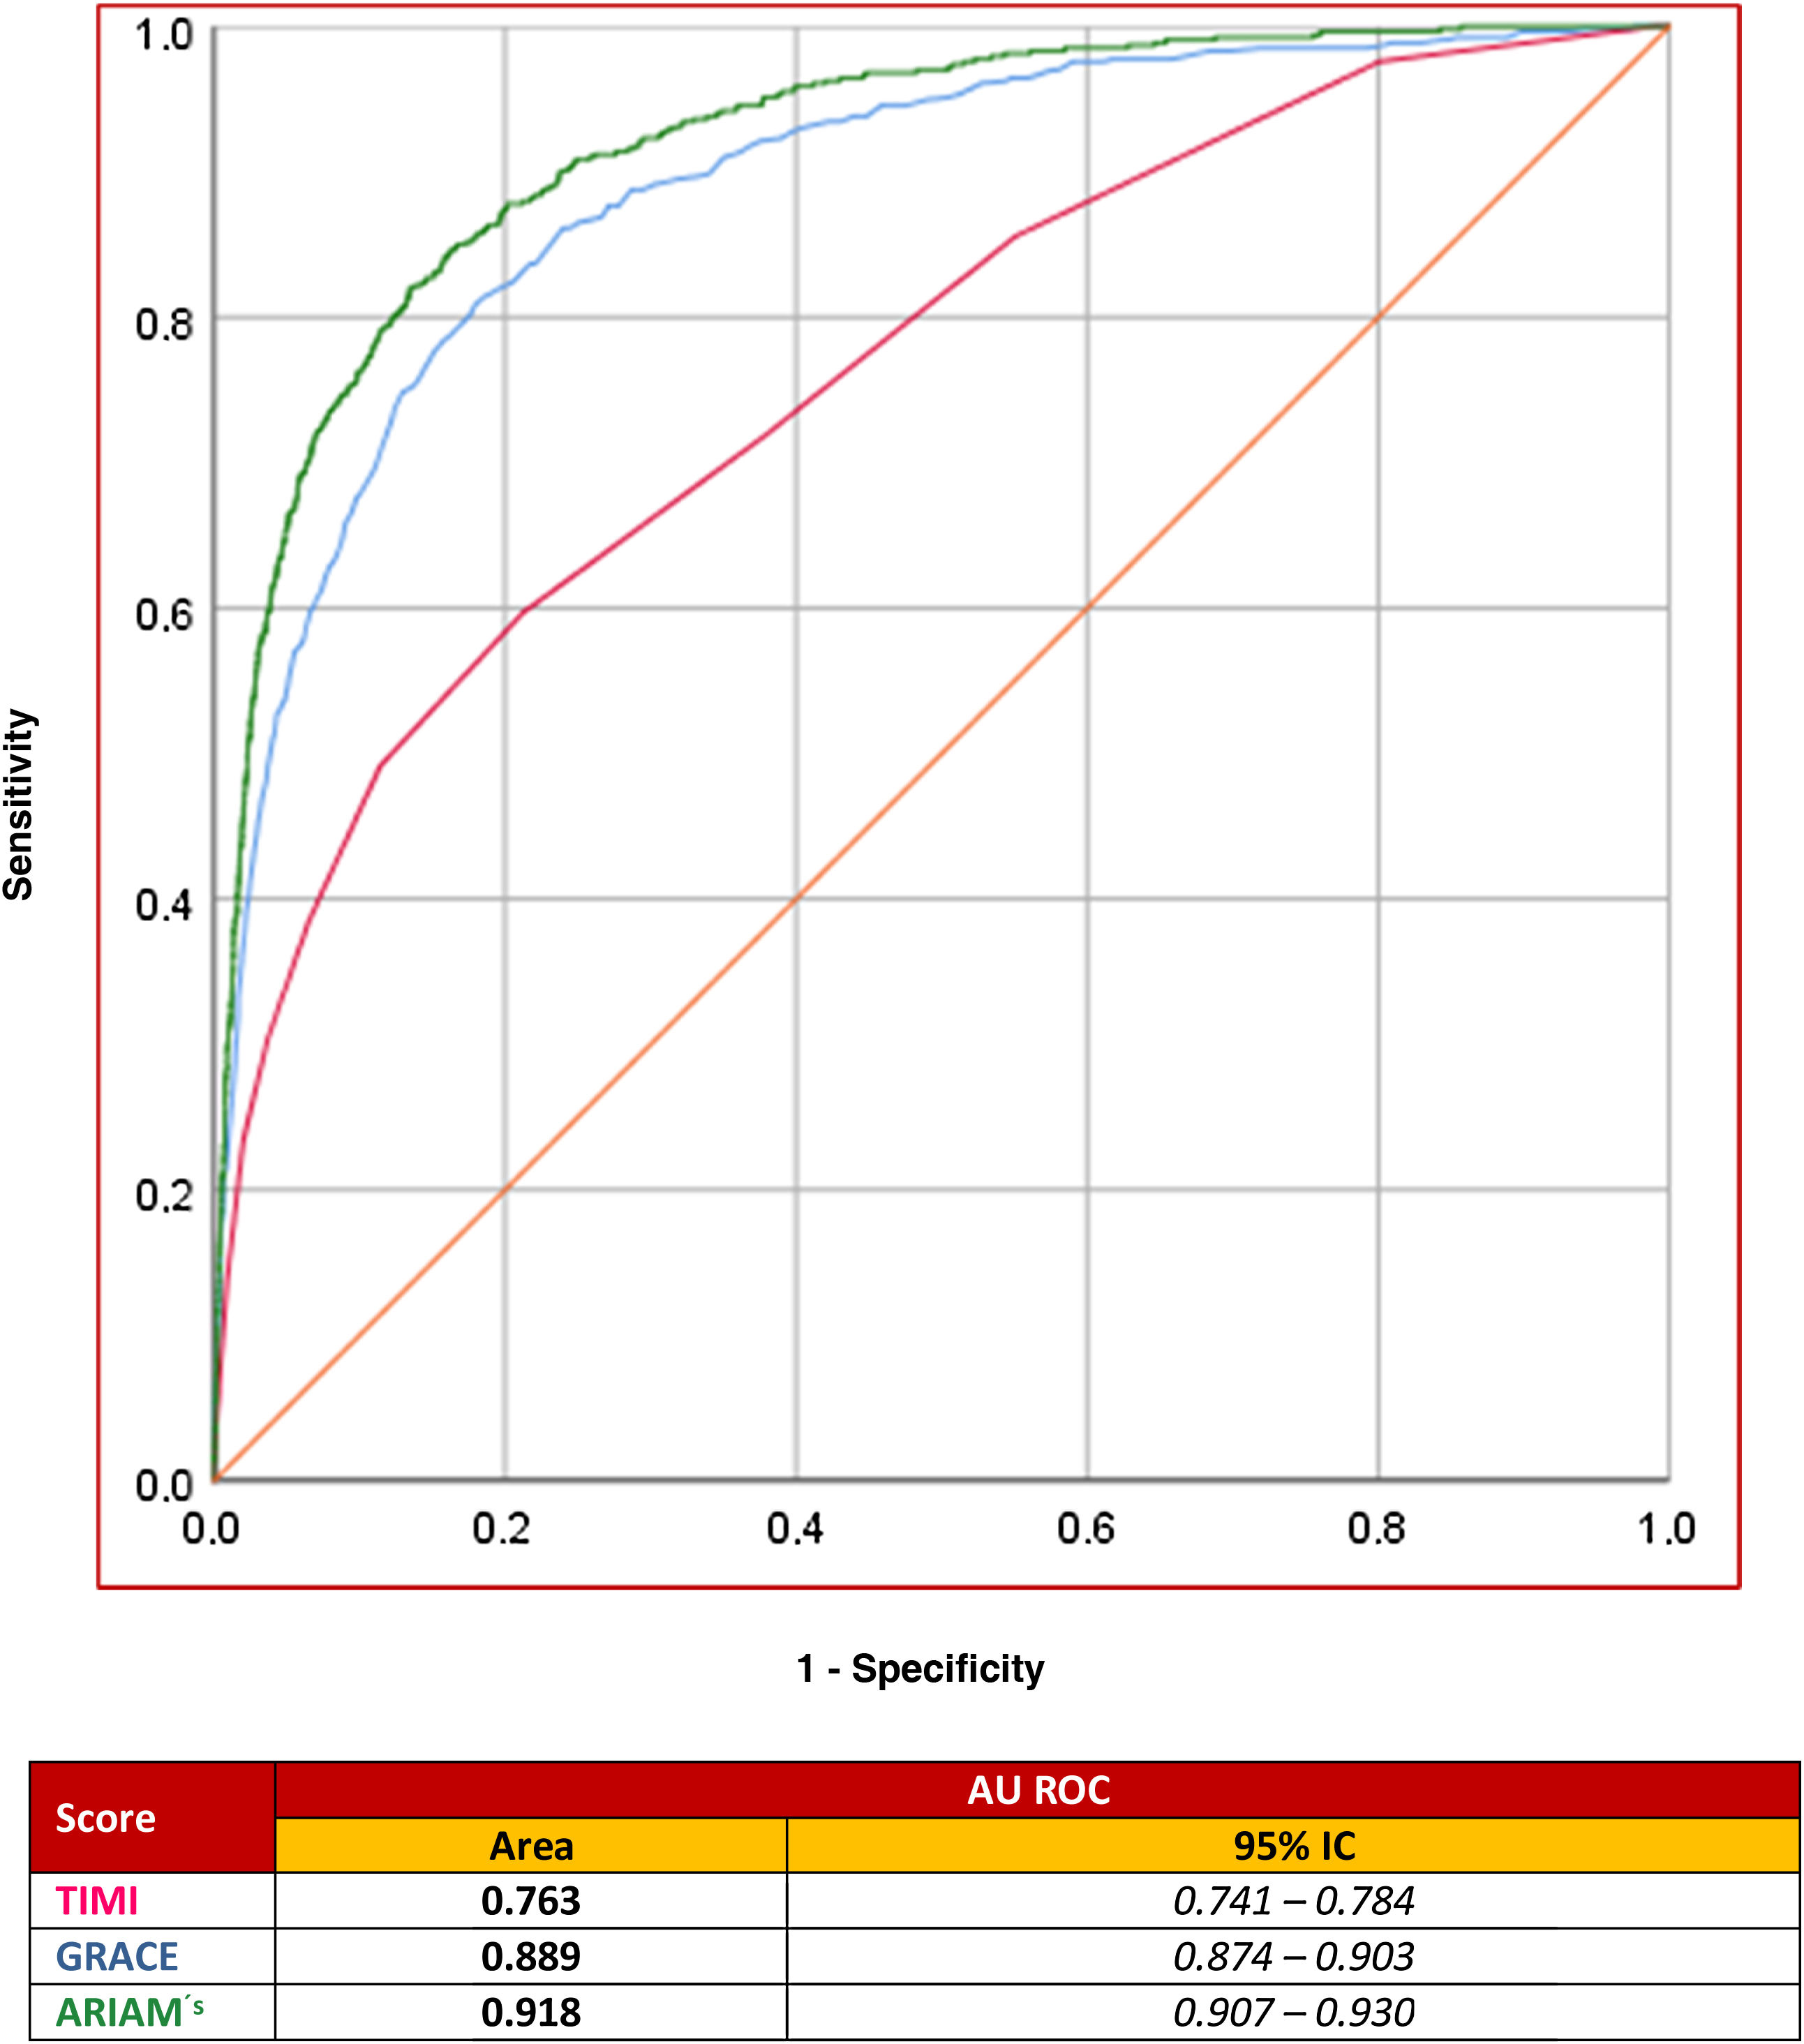
The area under the ROC curve of the model obtained was 0.918 (95%CI: 0.907−0.930). This “c” statistic compared with two other indicators (GRACE and TIMI scores) as predictors of ACS mortality in the DICM showed: ARIAM’s 0.918 (95%CI: 0.907−0.930) versus GRACE 0.889 (95%CI: 0.874−0.903; P < .05) and versus TIMI 0.763 (95%CI: 0.741−0.784; P < .01)(Fig. 3).
Fagan plots were used to determine the clinical relevance of the score. A positive ARIAM’s score indicated an increase in mortality risk to 19% (95%CI: 18%–20%), while a negative score indicated a decrease in mortality risk to 0.9% (95%CI: 0.8%–1.01%) (Annex 6).
DiscussionCardiovascular disease is the leading cause of death, morbidity and healthcare costs worldwide, and its frequency is increasing as a result of aging of the population. At present, cardiovascular disease causes 1.8 million deaths each year in Europe (20% of total mortality), with important variations among countries.1,13,14 In Spain, the management of ACS implies a great consumption of resources; correct risk stratification can therefore be regarded as crucial.3
In addition to establishing diagnostic, management and predictive criteria, a prognostic scale should be easy to use and should measure a clinically relevant outcome.15 Both the current clinical practice guides and the quality indicators of the SEMICYUC recommend early risk assessment of all ACS patients, based on the GRACE scale.13,16
Prognostic scales should be applied to the population for which they were designed. Thus, an indicator developed for the general population will not be valid in the DICM setting, and vice versa.15 In this regard, the tools used to date (GRACE and TIMI) have important limitations, since they are not specifically related to mortality on admission to the DICM but to mortality at 6 months and 14 days, respectively.17–21 In addition, the TIMI score exhibits differences concerning the clinical characteristics of the included patients: it does not include individuals with cardiogenic shock (Killip class IV), and furthermore, since it was designed based on a study of fibrinolytic treatments, it does not include patients subjected to primary percutaneous revascularization – which nowadays is the most frequent treatment prescribed in patients of this kind.17–22
In order for a scale to be practical in the clinical setting, it must include those variables which have been shown to be most relevant in predicting the established endpoint or event. In addition, the instrument should be novel, reproducible and easy to upgrade. The ARIAM’s uses 19 variables upon admission, including sociodemographic, laboratory test and clinical parameters.14,16 This new scale has shown good mortality discriminating capacity at patient admission, surpassing the performance of other previously used scales.
Patients with a positive ARIAM’s score have a 19% probability of dying from ACS. The diagnostic accuracy of the model was 96.81% in the training set and 96.79% in the validation set. The mortality risk increases to over 19% when the score is positive, and drops to under 1% when negative. The scale therefore shows good study event discriminating capacity and prioritizes the treatment strategy. In contrast, a negative ARIAM’s score identifies low-risk individuals and can guide patient triage and prevention strategies.
The area under the ROC curve of our indicator is even better than that of GRACE; it is therefore able to discriminate mortality more precisely.18
The design of new synthetic variables created from the times recorded in the ARIAM could improve the performance of the model. An example of this is an analysis of the time interval chest pain onset – arrival in the ICU; although not identified as an independent predictor of mortality in the ICU (since there is great data dispersion in the sample), it does exhibit interesting differences that should be analyzed more in detail in future studies.16
This new model offers improvement with regard to the potential limitations of the existing scales, since it allows for early risk stratification. In recent years, new scores such as the M-CARS have been developed in view of the need to upgrade the existing tools. Nevertheless, these new scales have important drawbacks with respect to the model we propose: they are not specific of patients with ACS, and have been designed based on single-center studies. Thus, the generalization of the M-CARS to other populations may constitute an important limitation.23
The present study has two limitations that should be mentioned. The first limitation, common to all risk scores, is that although the model is good at discriminating risk groups, it does not necessarily correctly predict individual risk. The second limitation is inherent to machine learning methods, which can work very well in our training and validation sets (internal validity), but the model must be extended to new series of data or web registries (external or prospective validity), to thus validate the new scale in future populations.
ConclusionsThe ARIAM’s, created from an artificial neural network (ANN), is a clinical management scale better suited to the current population, more accurate and reproducible, and which can be upgraded periodically. In the ICU it is very useful for clinical assessments and may serve as a reference in quality studies. This new scale may be of use in establishing comparisons with other previous predictive scales, to promote the conduction of new investigations.
Author contributionsThe authors of this study are the principal investigators of their respective hospitals, and have contributed the largest number of cases to the ARIAM registry data included in the study.
The study design and drafting of the manuscript were carried out by JJAB, ARG and HLG, with due correction by the rest of the authors, who agree with the contents.
Conflicts of interestThe authors declare that they have no conflicts of interest.
The following are Supplementary data to this article: