


Mechanical ventilation (MV) is a therapeutic intervention involving the temporary replacement of ventilatory function with the purpose of improving symptoms in patients with acute respiratory failure. Technological advances have facilitated the development of sophisticated ventilators for viewing and recording the respiratory waveforms, which are a valuable source of information for the clinician. The correct interpretation of these curves is crucial for the correct diagnosis and early detection of anomalies, and for understanding physiological aspects related to MV and patient–ventilator interaction. The present study offers a guide for the interpretation of the airway pressure and flow and volume curves of the ventilator, through the analysis of different clinical scenarios.
La ventilación mecánica es una intervención terapéutica de sustitución temporal de la función ventilatoria enfocada a mejorar los síntomas en los pacientes que sufren insuficiencia respiratoria aguda. Los avances tecnológicos han facilitado el desarrollo de ventiladores sofisticados que permiten visualizar y registrar las ondas respiratorias, lo que constituye una fuente de información muy valiosa para el clínico. La correcta interpretación de los trazados es de vital importancia tanto para el correcto diagnóstico como para la detección precoz de anomalías y para comprender aspectos de la fisiología relacionados con la ventilación mecánica y con la interacción paciente-ventilador. El presente trabajo da una orientación de cómo interpretar las curvas del ventilador mediante el análisis de trazados de presión en la vía aérea, flujo aéreo y volumen en distintas situaciones clínicas.
Positive pressure MV constitutes life support management for patients with ARF. The devices used for positive pressure ventilation evolved enormously between the mid-1970s and the late 1990s. The first-generation ventilators (between the early XIX century and the mid-1970s) were little more than mechanical anesthesia bags, unable to respond to patient demand and with very rudimentary monitorization systems (if any). The latest (fourth) generation ventilators were introduced two decades later. The new devices are efficient in responding to patient demand, offer new ventilation modes, allow noninvasive ventilation, have started to incorporate automatic control systems (open lung tools, weaning tools, dual modes),1 and have enormous monitorization capacities–including onscreen visualization of pressure, flow and volume curves.2 In addition, the need has recently arisen to introduce telemedicine-based systems as online monitoring tools at the patient bedside.3–5
The real-time examination of these waves allows us to analyze and understand elements of respiratory system mechanics and of patient–ventilator interaction. Wave interpretation requires training, however. The present review offers a graphic description of some of the main phenomena which careful inspection of the curves can reveal, based on representative examples of each of them. The descriptions are limited to the three modes which presently may be regarded as standard in MV: volume-controlled ventilation (VCV), pressure-controlled ventilation (PCV), and pressure support ventilation (PSV). Examples of curves will be used to explore concepts in respiratory system mechanics and how to interpret patient–ventilator interaction from such curves.
Concepts in respiratory system mechanicsAuto-positive end-expiratory pressureExpiration occurs because alveolar pressure (Palv) is greater than airway pressure (Paw), thereby generating a flow (Q) against the expiratory resistance (R). The following equation shows the relationship among the determinants of Q:
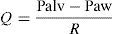
Normally, at the end of calm expiration, the respiratory system has reached its functional residual capacity (FRC). However, if the expiratory time (Te) is not long enough to allow full exhalation, then the respiratory system does not reach FRC, and the trapped volume (Vtrap) determines the appearance of auto-positive end-expiratory pressure (PEEP).6–8
where E is the elastance of the respiratory system.
Fig. 1 shows that the persistence of end-expiratory flow at the end of the respiratory cycle on the flow–time curve indicates that the Palv–Paw gradient is >0, which determines the existence of auto-PEEP.9 Likewise, on examining the Paw–time curve, we observe the existence of pressure above the PEEP, indicating the trapping of air.
 in a patient with auto-PEEP. The behavior of Palv (dotted line) has been overlaid upon the Paw tracing. Note that at the end of expiration, Q does not return to 0 (hollow arrow). This persistent flow is explained by the persistent pressure gradient between Palv and Paw (solid arrow).")
Schematic representation showing Q and Paw tracings during volume-controlled ventilation (VCV) in a patient with auto-PEEP. The behavior of Palv (dotted line) has been overlaid upon the Paw tracing. Note that at the end of expiration, Q does not return to 0 (hollow arrow). This persistent flow is explained by the persistent pressure gradient between Palv and Paw (solid arrow).
Fig. 2 shows that the pressure–volume ratio (PVR) tracing of the respiratory system is not linear; rather, in general it is sigmoid in shape with two extremities where E is greater, and a relatively linear intermediate zone in which E is smaller.10 The three segments of the inspiratory arm of the curve are separated by lower inflexion point (LIP) and upper inflexion point (UIP)11 (Fig. 2) that allow us to identify the pressures at which recruitment and derecruitment begin and end. Accordingly, it has been postulated that tidal ventilation (TV) should occur in the central zone of the PVR tracing, between the two inflexion points.12,13
 separated by upper inflexion point (UIP) and lower inflexion point (LIP).")
Pressure–volume ratio of the respiratory system. As can be seen, the tracing is sigmoid in shape with a relatively linear intermediate zone and two clearly differentiated extremities of lesser gradient (increase elastance) separated by upper inflexion point (UIP) and lower inflexion point (LIP).
The determination of PVR is instrumentally complex,14 and evaluation based on the classical super-syringe method (static PVR) requires disconnection of the patient from the ventilator and generates hypoventilation while the maneuver is carried out.15 For this reason surrogates have been sought, based on the use of low flows during the tracing, among others, as an approximation to the static conditions, controlled by the software supplied with the latest-generation ventilators-thereby greatly simplifying the process.16,17
In this context, Ranieri et al. have postulated that in conventional mechanical ventilation (CMV) with square flow waves (where volume gain as a function of time remains constant), linearity of the pressure curve during insufflation indicates that TV occurs between the two inflexion points of the RPV.18 In order to analyze the phenomenon, the authors defined the stress index (SI), adjusting the points of the pressure–time curve to the following equation:
where a and b are constants related to [Q×E] and [Q×R], respectively, while T is the time elapsed from the start of inspiration.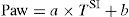
Although calculation of the SI requires computer processing of the Paw data, simple visual inspection of the tracings can demonstrate the phenomenon.19,20Fig. 3 provides examples of different SI values. When SI=1, the tracing is a straight line (Fig. 3a), indicating that TV occurs in a low-risk ventilatory zone. Values of SI<1 correspond to a convex PVR curve (Fig. 3b), and thus reflect probable derecruitment. In contrast, SI>1 corresponds to probable overdistension (Fig. 3c).
Resistance SI≈1; (b) SI≈1.3; (c) SI≈0.6. The lower portion shows the region of the pressure–volume ratio in which ventilation is taking place.")
Changes in resistance (R) have a very different expression in the pressure curves depending on the ventilation mode involved, i.e., VCV or pressure-controlled modes (PCV and PSV).
In the VCV mode, the pressure gradient between peak pressure and plateau pressure increases parallel to R.21 During expiration, the increase in resistance gives rise to a drop in peak expiratory flow and in the gradient of the expiratory tracing.22,23 Consequently, exhalation is prolonged, increasing Te and the time needed for Palv to equal the Paw levels. If this rise in R increases further, Te no longer suffices for the respiratory system to return to FRC, and air trapping occurs9 (Fig. 1: auto-PEEP). When lung deflation is incomplete, the plateau pressure begins to rise, because the end-inspiration volume increases in the next cycle (Fig. 4).
 and Paw (solid black arrows). In the expiratory phase, the increase in R reduces the peak expiratory flow (solid gray arrows) and increases the time needed for the respiratory system to reach functional residual capacity (hollow arrows). Note that the point where Q reaches 0 coincides with extinction of the Palv–Paw difference.")
Schematic representation of the effect of increased resistance during volume-controlled ventilation. During the inspiratory phase in which Q is being controlled by the ventilator, the increase in R gives rise to an increase in the difference between Palv (tracing overlaid upon Paw, in red) and Paw (solid black arrows). In the expiratory phase, the increase in R reduces the peak expiratory flow (solid gray arrows) and increases the time needed for the respiratory system to reach functional residual capacity (hollow arrows). Note that the point where Q reaches 0 coincides with extinction of the Palv–Paw difference.
In the PCV mode, the effects of changes in R are very different. During inspiration, as R increases, a reduction is observed in peak inspiratory flow, the inspiratory time (Ti) is prolonged, and the plateau pressure decreases. If R is very high, the plateau disappears entirely, Palv does not reach the Paw levels, and TV decreases.24 The changes induced by the rise in R in the expiratory phase of the cycle are identical to those observed in CMV. The only difference is that if the R increment is sufficiently large to induce auto-PEEP, instead of pressure increments, we observe a reduction in TV in the following cycle25 (Fig. 5).
 and expiratory flow (solid light arrows), while the time required for flow to reach 0 during inspiration (solid dark arrows) and during expiration (hollow arrows) increases. It can be seen that the same phenomenon determining the appearance of auto-PEEP during expiration induces a decrease in tidal ventilation (TV) during inspiration.")
Effect of the increase in resistance during pressure-controlled ventilation. The increase in R leads to a reduction in peak inspiratory (solid black arrows) and expiratory flow (solid light arrows), while the time required for flow to reach 0 during inspiration (solid dark arrows) and during expiration (hollow arrows) increases. It can be seen that the same phenomenon determining the appearance of auto-PEEP during expiration induces a decrease in tidal ventilation (TV) during inspiration.
In the PSV mode, the changes observed following a rise in R are similar, with the exception that possible Ti modification adds greater complexity: if Ti is prolonged, the risk of TV reduction decreases while at the same time an increase in observed in the probability of auto-PEEP due to a greater TV and a Te that shortens secondary to the changes in Ti.26
ElastanceAgain, the effects of changes in elastance (E) upon the tracings depend on the ventilation mode used. In VCV mode, an increase in E gives rise to an increase in plateau pressure. During expiration, the increase in pressure gradient between Palv and Paw generates a flow increment, and in turn shortens the time needed for exhalation (Fig. 6).
. During expiration, the rise in E increases the peak expiratory flow (hollow arrows).")
Effect of the increase in elastance during volume-controlled ventilation. During inspiration, the increase in E results in an increase in airway pressure, though in contrast to the situation observed with increases in R, there is no rise in the pressure gradient between Paw and Palv (solid arrows). During expiration, the rise in E increases the peak expiratory flow (hollow arrows).
In PCV mode, an increase in E causes the ventilator to reach Palv more quickly, the flow decelerates faster, the inspiratory pause is prolonged, and TV is lowered. During expiration, and in the same way as in VCV mode, the increase in driving pressure produces faster exhalation. The phenomenon is more accentuated than in VCV mode, because TV progressively decreases (Fig. 7). In PSV mode, if the E increment cannot be compensated by an increase in patient effort, TV inevitably will decrease, since the changes in Ti will be unable to sustain the flow, with extinction of the pressure gradient.
 and the time needed for Palv to reach Paw (with the cessation of inspiratory flow, solid black arrows) decrease as E increases. In contrast to the situation observed in volume-controlled ventilation, the peak expiratory flow is not modified, because the pressure gradient between Palv and Paw does not change; expiration, however, ends previously due to the progressive reduction in tidal ventilation (solid gray arrows).")
Effect of the increase in elastance during pressure-controlled ventilation. The peak inspiratory flow (hollow arrows) and the time needed for Palv to reach Paw (with the cessation of inspiratory flow, solid black arrows) decrease as E increases. In contrast to the situation observed in volume-controlled ventilation, the peak expiratory flow is not modified, because the pressure gradient between Palv and Paw does not change; expiration, however, ends previously due to the progressive reduction in tidal ventilation (solid gray arrows).
The terminal airway courses within the lung parenchyma, and as a result of the structural links between the two elements, when Palv increases (and lung volume is greater), the diameter of the terminal airway increases and R is reduced. As the lung volume decreases, we observe a gradual and discrete rise in R.27,28 In patients with chronic obstructive pulmonary disease (COPD), destruction of the parenchyma causes the airway–surrounded by pressurized alveoli–to undergo dynamic collapse during exhalation.29,30 This can be easily seen from the expiratory flow curve as a sudden change in the slope or gradient of the tracing. The curve, which is normally a monoexponential-like tracing, becomes biexponential (Fig. 8). In some patients, the imposition of PEEP acts as a stent, and the point of closure progressively transfers toward smaller lung volumes (in some cases again acquiring a monoexponential profile).31
, a sudden change in resistance is observed, and the expiratory flow decreases and deviates from the expected tracing (dotted line).")
Schematic representation of the flow tracing in a patient with dynamic collapse of the airway. Exhalation begins normally, though beyond a certain point (arrow), a sudden change in resistance is observed, and the expiratory flow decreases and deviates from the expected tracing (dotted line).
Activation of the inspiratory muscles immediately reduces Palv. If at the time of muscle activation there is no auto-PEEP (Palv equals Paw), a pressure gradient is produced that facilitates the start of gas entry to the lungs, a drop in Paw (if the system is closed, or flow derivation if the system is open), and triggering of the ventilator. However, if at the start of the inspiratory effort Palv is greater than Paw, ventilator triggering first requires the compensation of auto-PEEP.32 If the magnitude of the effort is not enough to compensate auto-PEEP (and the established triggering threshold), then inspiration does not take place–a condition known as ineffective inspiratory effort (IIE).33–35
Assuming that there are no changes in R (or that such changes are relatively linear), and that Paw is being controlled by the system in order to maintain the selected PEEP levels, then any change in the expiratory flow curve will be the result of a change in Palv (see Eq. (1)). In this way, IIE produces a characteristic indentation in the tracing (Fig. 9).
 and flow tracings in the context of patient inspiratory effort. In the Peso tracing, note that in addition to the effort which starts an inspiratory cycle, there is a second effort that proves ineffective (hollow arrow). The observed drop in Palv (tracing overlaid upon the Paw tracing; solid black arrow) is unable to invert the Palv–Paw gradient and thus invert the flow. However, the gradient reduction results in a lowering of the flow that reveals the presence of the phenomenon (solid gray arrow).")
Ineffective inspiratory efforts. Schematic representation of the esophageal pressure (Peso) and flow tracings in the context of patient inspiratory effort. In the Peso tracing, note that in addition to the effort which starts an inspiratory cycle, there is a second effort that proves ineffective (hollow arrow). The observed drop in Palv (tracing overlaid upon the Paw tracing; solid black arrow) is unable to invert the Palv–Paw gradient and thus invert the flow. However, the gradient reduction results in a lowering of the flow that reveals the presence of the phenomenon (solid gray arrow).
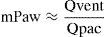
By definition, the pressure within an elastic container depends on its volume and elastance. In the case of the airway, the equation is:
Assuming that elastance of the airway (Eaw) remains relatively constant, then changes in Paw are secondary to changes in airway volume (Vaw). During inspiration, Vaw is a function of the relationship between the flow supplied by the ventilator (Qvent) and the flow toward the lung parenchyma generated by the action of the respiratory muscles of the patient (Qpac) (Fig. 10). When Qvent exceeds Qpac, Vaw (and Paw) increase, and vice versa. The gradient corresponding to Paw (mPaw) reflects the relationship between these flows:In VCV mode, where Qvent has been established by the user, there is a risk of flow dyssynchrony, i.e., a Qvent inadequate for Qpac can give rise to an increase in respiratory effort (Fig. 11).36–38
 determine the gas volume in the airway, and consequently also Paw. The ventilator contributes gases to the airway from the exterior (Qvent; hollow arrow), while the patient extracts gases toward the lung parenchyma (Qpac; solid arrow) (see text).")
Determinants of Paw during inspiration. During inspiratory effort, two pumps in series (the ventilator and the respiratory muscles of the patient) determine the gas volume in the airway, and consequently also Paw. The ventilator contributes gases to the airway from the exterior (Qvent; hollow arrow), while the patient extracts gases toward the lung parenchyma (Qpac; solid arrow) (see text).
, with moderate effort (center), and with important effort (right). In the patient-triggered cycles, the passive Paw tracing has been left as reference to illustrate the impact of progressive inspiratory effort upon Paw. The medium gray-colored zone represents respiratory effort supported by the ventilator, the light gray zone shows the part of respiratory effort supported by the patient, and the dark gray zone shows the respiratory effort generated by the ventilator (and also supported by the patient).")
Flow dyssynchrony. The figure shows the tracings corresponding to Q, Paw and Peso of respiration under volume-controlled ventilation with no inspiratory muscle activity (left), with moderate effort (center), and with important effort (right). In the patient-triggered cycles, the passive Paw tracing has been left as reference to illustrate the impact of progressive inspiratory effort upon Paw. The medium gray-colored zone represents respiratory effort supported by the ventilator, the light gray zone shows the part of respiratory effort supported by the patient, and the dark gray zone shows the respiratory effort generated by the ventilator (and also supported by the patient).
The ventilatory pattern of patients varies in terms of TV, respiratory frequency (RF) and Ti (Tipac). Variations in Tipac pose a clear problem in those ventilatory modes in which the Ti of the ventilator (Tivent) is fixed (VCV and PCV).
When inspiration of the patient ends before that of the ventilator (Tipac<Tivent), the patient begins to exhale against an airway that remains pressurized. If this situation persists (even for very short periods of time), then the patient activates the expiratory muscles, producing an increase in Paw (Fig. 12). Although Tivent is not pre-fixed in PSV mode, in patients with COPD in which R is high and E is low, this phenomenon is often observed and leads to the development of auto-PEEP.39
 and expiratory muscles (EMe). Note that Tipac is smaller than Tivent (double hollow arrow). After relaxation of the inspiratory muscles, exhalation does not take place because the airway is still pressurized. A few instants later, the patient activates the expiratory muscles, producing an end-inspiratory increase in Paw (solid arrow).")
The upper zone shows tracings of Q and Paw corresponding to respiration under conventional mechanical ventilation with square flow wave and inspiratory pause. The lower zone offers a schematic representation of the electromyographic recordings of the inspiratory (EMi) and expiratory muscles (EMe). Note that Tipac is smaller than Tivent (double hollow arrow). After relaxation of the inspiratory muscles, exhalation does not take place because the airway is still pressurized. A few instants later, the patient activates the expiratory muscles, producing an end-inspiratory increase in Paw (solid arrow).
If patient effort persists beyond the programmed Ti (Tipac>Tivent), the outcome will depend on the magnitude of the phenomenon. When effort ceases shortly after closure of the expiratory valve, the most evident consequence is amputation of the peak expiratory flow (Fig. 13). If this phenomenon is further intensified, double triggering may occur.
 and Peso (bottom) with respiration under conventional mechanical ventilation without inspiratory pause. Tivent is seen to end before Tipac (double hollow arrow), causing amputation of the peak expiratory flow (solid arrow). The broken tracing, placed as reference, represents the behavior which Q would have had in the absence of overlaid patient inspiratory effort.")
Tracing corresponding to Q (top) and Peso (bottom) with respiration under conventional mechanical ventilation without inspiratory pause. Tivent is seen to end before Tipac (double hollow arrow), causing amputation of the peak expiratory flow (solid arrow). The broken tracing, placed as reference, represents the behavior which Q would have had in the absence of overlaid patient inspiratory effort.
As has been commented on mentioning flow dyssynchrony, Paw depends on the relationship between Qvent and Qpac. If at inspiratory valve closure (end of Ti) the patient continues inspiratory effort (Tipac>Tivent), a decrease is observed in Paw that can again trigger an inspiratory cycle, i.e., two inspirations not separated by an expiration.40 This phenomenon is known as double triggering, and its effects differ according to whether the patient is on VCV or PCV mode.
In VCV mode, the second inspiratory cycle adds a TV to the previous TV. Paw increases significantly and, if the pressure alert does not abort the second cycle, the resulting TV will be twice the expected TV. The Ti also will be double than that expected, and so neural Ti will be shorter than the Ti of the machine (the patient will attempt to start exhalation while the ventilator is pressurizing the airway) (Fig. 14).
 is greater than the Ti of the ventilator or respirator (Tiresp), the patient continues inspiration against the already closed inspiratory valve, causing the drop of Paw and, if the triggering threshold is exceeded, a new inspiratory cycle is started in which the second tidal ventilation (TV) adds to the first.")
Double cycling in volume-controlled ventilation. When the Ti of the patient (Tipac) is greater than the Ti of the ventilator or respirator (Tiresp), the patient continues inspiration against the already closed inspiratory valve, causing the drop of Paw and, if the triggering threshold is exceeded, a new inspiratory cycle is started in which the second tidal ventilation (TV) adds to the first.
In PCV mode, the second cycle will not double the TV, for although Palv at the start of the second cycle will be low (and consequently the driving pressure will be high), this is simply a result of the inspiratory effort of the patient, and relaxation of the inspiratory muscles at the end of neural Ti rapidly raises Palv, causing air inflow to cease.35,41 In any case, Ti is doubled, and in this sense gives rise to the same effects as described in the VCV mode (Fig. 15).
.")
Double cycling in pressure-controlled ventilation. In the same way as in volume-controlled ventilation, the prolongation of Tipac beyond the limits of Tiresp can cause a drop in Paw, starting a new inspiratory cycle. However, in contrast to the situation in volume-controlled ventilation, tidal ventilation is not doubled (see text).
During exhalation, the presence of secretions in the airway can generate cyclic increments and decrements in flow secondary to transient obstruction of the airway lumen or fluctuating movements of its contents.27,42 This in turn can alter the flow wave profile (Fig. 16).
.")
Figs. 17–24 correspond to actual patient tracings showing the phenomena analyzed above.
.")
 evidences a PEEP level insufficient to avoid the collapse at the end of expiration and the consequent inspiratory recruitment in the next cycle.")
.")
. The second shorter Ti is observed because the pressure alert interrupts the cycle and opens the expiratory valve. In the following cycles, effort also starts in the presence of auto-PEEP, but fails to trigger the ventilator (ineffective inspiratory effort).")
Tracing corresponding to a patient with conventional mechanical ventilation. The solid arrow shows inspiratory effort starting before Q reaches 0 (auto-PEEP). The second shorter Ti is observed because the pressure alert interrupts the cycle and opens the expiratory valve. In the following cycles, effort also starts in the presence of auto-PEEP, but fails to trigger the ventilator (ineffective inspiratory effort).
. The Paw tracing shows insufficient inspiratory flow to cover the patient needs (hollow arrows).")
. This phenomenon is related to dynamic collapse of the airway and, in some cases, can be normalized with the use of extrinsic PEEP (which behaves as an airway stent). Note also the presence of auto-PEEP (hollow arrows).")
Tracing corresponding to a patient with conventional mechanical ventilation. Note that the expiratory flow shows a biexponential drop (black arrows). This phenomenon is related to dynamic collapse of the airway and, in some cases, can be normalized with the use of extrinsic PEEP (which behaves as an airway stent). Note also the presence of auto-PEEP (hollow arrows).
, the patient effort proves unable to again trigger the ventilator. The Paw tracing shows marked differences in the first and second inspirations in the cycles where double cycling is observed: while the first shows amputation of the inspiratory plateau (effort persists with the inspiratory valve closed, gray arrows), the second shows a clear plateau and much higher Paw values (the inspiratory effort of the patient has ended, and tidal ventilation has doubled). The doubling of tidal ventilation is not seen in the Vol tracing because the system software adjusts zero at the start of the second inspiration (hollow arrows).")
Tracing corresponding to a patient with conventional mechanical ventilation exhibiting a neural Ti greater than the mechanical Ti. In cycle A and in cycle C, the phenomenon is of sufficient magnitude to produce double cycling, while in cycle B, although there is amputation of peak expiratory flow (black arrow), the patient effort proves unable to again trigger the ventilator. The Paw tracing shows marked differences in the first and second inspirations in the cycles where double cycling is observed: while the first shows amputation of the inspiratory plateau (effort persists with the inspiratory valve closed, gray arrows), the second shows a clear plateau and much higher Paw values (the inspiratory effort of the patient has ended, and tidal ventilation has doubled). The doubling of tidal ventilation is not seen in the Vol tracing because the system software adjusts zero at the start of the second inspiration (hollow arrows).

Careful inspection of the flow, pressure and volume curves offered by the new-generation ventilator systems can yield a large amount of information. Such data are valuable, because they help to correct phenomena that can prove life-threatening for the patient, worsen the prognosis, or simply cause discomfort (and probably an ulterior increase in sedation levels). Recent studies have shown that the parameters related to ventilation and the mechanical characteristics of the respiratory system can interfere with interactions among organs. Their correct monitorization is therefore essential for maintaining correct homeostasis.43–45 However, in order to obtain the maximum possible amount of information, we must carefully examine the tracings, and due training is required in order to make this possible. The implementation of real-time online monitorization systems equipped with intelligent alerts or alarms would facilitate the interpretation of these tracings on the part of the clinical personnel, and would contribute to ensure quality care.
Financial supportThis study was partially funded by Fundació Parc Taulí, Caixa Sabadell, ISCIII PI09/91074, CIBER, Plan Avanza IST-020302-2008-38, and MCYIN MITYC (Spain).
Conflicts of interestThe authors declare no conflicts of interest.
Please cite this article as: Correger E, et al. Interpretación de las curvas del respirador en pacientes con insuficiencia respiratoria aguda. Med Intensiva. 2012;36:294–306.

