
An evaluation is made of lung function and quality of life 6 months after discharge from the Intensive Care Unit (ICU) among survivors of acute respiratory distress syndrome (ARDS) due to pandemic 2009 influenza A H1N1, based on studies of lung function and the EQ-5D health questionnaire.
DesignCase series.
SettingThe ICU of Dr. Leónidas Lucero Acute Cases Municipal Hospital, Bahía Blanca, Argentina.
PatientsPatients discharged from the ICU who had been admitted with ARDS in 2009 due to influenza A H1N1.
ResultsEleven patients were studied. Seven were positive for influenza H1N1 and four were negative. The mean age was 37±9.5 years, and 73% were males. Quality of life, as measured by the EQ-5D, showed changes in the 5 components in all patients, particularly in the pain/discomfort dimension 1.55±0.52; health status (EQ%health) was 70%±24. The indices adjusted for Argentina were Time Trade Off (TTO) 0.903±0.085 and visual analog scale (VAS) 0.827±0.153. In all patients, spirometry and the study of pulmonary diffusion (DLCO) showed values of >80%. There was no correlation between lung diffusion and quality of life (%DLCO and EQ%health). A correlation was observed between quality of life and TTO (EQ%health and TTO), and between quality of life and the VAS score (EQ%health and VAS).
ConclusionAlthough the sample is small, our results suggest that patients with ARDS due to influenza A H1N1 evaluated 6 months after discharge from the ICU show no deterioration of lung function, and the impact on quality of life is moderate-in contrast to the situation found in patients with ARDS of other etiologies.
Evaluar la función pulmonar y la calidad de vida a los 6 meses del alta de la unidad de cuidados intensivos (UCI), a pacientes que tuvieron síndrome de distrés respiratorio agudo (SDRA) por influenza A H1N1 pandémica 2009, mediante estudios de función pulmonar y cuestionario de salud EQ-5D.
DiseñoSerie de casos.
ÁmbitoLa UCI del Hospital Municipal de Agudos Dr. Leónidas Lucero, Bahía Blanca, Argentina.
PacientesPacientes de alta de UCI, ingresados en 2009 con SDRA por influenza A H1N1.
ResultadosSe estudiaron 11 pacientes, 7 de ellos fueron positivos para influenza A H1N1 y 4 fueron negativos. La edad media fue de 37±9,5 años, (73%) varones. La calidad de vida de todos los pacientes evaluado por EQ-5D mostró cambios en los 5 componentes, siendo mayor en la dimensión dolor/malestar 1,55±0,52, y el estado de salud (EQ%health) fue de 70%±24. Los índices ajustados para Argentina fueron Time Trade Off (TTO) 0,903±0,085 y Visual Analog Scale (VAS) 0,827±0,153. En todos los pacientes, la espirometría y el estudio de difusión pulmonar (DLCO) mostraron valores >80%. No hubo correlación entre difusión pulmonar-calidad de vida (%DLCO-EQ%health), y si hubo correlación entre calidad de vida-índice TTO (EQ%health-TTO) y entre calidad de vida-índice VAS (EQ%health-VAS).
ConclusiónAunque la muestra es pequeña, nuestros resultados sugieren que los pacientes con SDRA por influenza A H1N1 evaluados a los 6 meses del alta de UCI no presentaron deterioro en la función pulmonar y la repercusión en la calidad de vida fue moderada, a diferencia de lo que ocurre en los pacientes con SDRA de otras etiologías.
During the influenza virus H1N1 pandemic of 2009, a small proportion of patients developed severe pneumonia leading to acute respiratory distress syndrome (ARDS) and multiorgan dysfunction syndrome (MODS), associated to a prolonged stay in the Intensive Care Unit (ICU) and important mortality (15–54%).1–3 In Argentina, according to the epidemiological report of the Ministry of Health, up until 6 February 2010, a total of 1,479,998 cases of influenza-type disease had been reported, and of the 28,627 samples analyzed in the laboratory, 12,010 were confirmed as corresponding to influenza (H1N1) 2009. The hospital admission rate due to severe respiratory disease was 34.89 cases per 100,000 inhabitants, and the number of confirmed deaths reached 626.4
In influenza, including H1N1, experimental and clinical studies have identified deregulated systemic inflammation as an important pathogenic mechanism correlated to the severity and progression of the disease.5
In response to the influenza epidemic, and based on the clinical trials of the treatment of ARDS with corticosteroids,6 in Bahía Blanca (Argentina) we developed an integral protocol for treating patients with suspected pneumonia due to influenza virus H1N1 and ARDS admitted to the ICU. This protocol was applied to 13 patients, comprising a series that was published in 2010.7
Among survivors of ARDS due to causes other than H1N1 infection, a series of functional alterations are observed that mostly disappear over time. The initial phases of patient recovery are characterized by restrictive-type ventilatory disorders.8 Approximately one third of the patients show diminished total lung capacity, and almost one half suffer a decrease in pulmonary carbon monoxide diffusing capacity (DLCO).9 The most important late functional alterations are gas exchange anomalies. All these functional alterations may be attributable to the presence of lung fibrosis, as has been shown in the few cases where histopathological studies are available.10 Long-term quality of life is largely dependent upon the diagnostic category involved; in this context, patients with ARDS, prolonged mechanical ventilation, severe trauma and severe sepsis are those who suffer important worsening in quality of life—fundamentally as refers to mental and emotional aspects.11
Taking into account the impact of ARDS, we decided to follow-up on 11 survivors of the above mentioned series published in 2010, evaluating their lung function and quality of life after 6 months.
Materials and methodsThe study was approved by the Institutional Review Board, and informed consent was obtained from all patients.
The 11 patients were evaluated 6 months after discharge from the ICU. At the time of the control visit they received an explanation of the study and were given the self-administered EuroQoL-5D (EQ-5D) health questionnaire.
We used the validated Spanish version of the EQ-5D, a simple generic instrument is divided into three parts. The first part comprises a descriptive system defining health condition in terms of 5 dimensions: mobility, personal care, daily life activities, pain/discomfort and anxiety/depression. Each dimension in turn is divided into three levels: level 1=no problems, level 2=some/moderate problems, and level 3=many problems. A given health condition is a combination of one level for each dimension. The second part of the EQ-5D consists of a visual analog scale (VAS) measuring 20cm in length and scored from 0 to 100, where 0 and 100, respectively represent the worst and best health condition imaginable, expressed as EQ%health. The third part of the questionnaire involves the obtainment of preference indices based on 243 possible health conditions generated by the EQ-5D using a scoring technique such as the Time Trade Off (TTO) method,12 where the index ranges from 1 (best health condition) to 0 (death)—though there are also negative index values, corresponding to those health conditions that are rated as worse than death. The use of these techniques helps take into account that improvement in one dimension may not have the same value for those interviewed as an improvement of the same magnitude in some other dimension. As reference values for these indices, we used those described by Augustovski et al.,13 who developed reference values based on the EQ-5D, using the VAS and TTO with logistic regression models, to assess the health conditions in the Argentinean population. The proposed values were VAS: 0.858 and TTO: 0.908.
The respiratory function studies were made after completing the EQ-5D questionnaire, and consisted of force spirometry before and after bronchodilator administration, and the pulmonary carbon monoxide diffusing capacity (DLCO) test. The latter was carried out using the single respiration method with the determination of pulmonary capillary blood volume (Vc) and the membrane diffusion factor (Dm). DLCO was interpreted from its components: alveolar volume (AV) and the permeability coefficient (Kco). The Ultima™ Series Med Graphics® computerized system was used.
The 11 patients were diagnosed in 2009 from the analysis of nasopharyngeal swab samples using a real-time polymerase chain reaction (RT-PCR) technique, in compliance with the guidelines published by the United States Centers for Disease Control (CDC).14
Statistical analysisThe statistical analysis was carried out with the SPSS version 15.0 package. Discrete variables were recorded as percentages, while continuous variables were reported as means±one standard deviation (SD), the median and range (minimum–maximum). Nonparametric univariate tests and a general linear model were used. In relation to the clinical and functional characteristics of the patients, the differences between the groups were evaluated using the chi-squared test and the Kolmogorov–Smirnov Z-test for one sample. Correlations were established between variables using the rho coefficient of Spearman and Pearson—statistical significance being accepted for p≤0.05.
ResultsThe study included 11 patients who suffered ARDS during the 2009 pandemic. The mean age was 37±9 years, and most were males (8/11). The mean stay in the ICU was 14±7 days, with a hospital stay of 20±10 days, and 11±6 days of mechanical ventilation. Seven patients proved positive and four negative for influenza A H1N1 infection, as diagnosed by RT-PCR. Eighty-five percent of the patients had stopped smoking (6/7), and only one remained an active smoker. Obesity was frequent: 73% of the patients had a body mass index (BMI) of >25kg/m2 (8/11), and two showed BMI>40kg/m2 (Table 1).
General characteristics 6 months after discharge from the Intensive Care Unit.
| Gender | Age | Days ICU | Days MV | Days hospital | Height (cm) | Weight (kg) | BMI | History | |
| H1N1 | |||||||||
| Negative | |||||||||
| 1 | Male | 32 | 8 | 7 | 12 | 164 | 84 | 31.34 | Ex-smoker |
| 2 | Male | 27 | 8 | 7 | 14 | 171 | 91 | 31.16 | Obese |
| 3 | Male | 45 | 6 | 5 | 11 | 166 | 62 | 22.54 | Arterial hypertension |
| 4 | Male | 44 | 17 | 14 | 23 | 170 | 75 | 25.95 | Ex-smoker |
| Mean | 37.00 | 9.75 | 8.25 | 15.00 | 167.75 | 78.00 | |||
| Median | 38.00 | 8.00 | 7.00 | 13.00 | 168.00 | 79.50 | |||
| SD | 8.907 | 4.924 | 3.948 | 5.477 | 3.304 | 12.517 | |||
| Positive | |||||||||
| 1 | Female | 16 | 30 | 26 | 47 | 144 | 90 | 43.47 | Tracheal stenosis, severe obesity, diabetes. |
| 2 | Male | 39 | 14 | 12 | 20 | 156 | 56 | 23.04 | Ex-smoker |
| 3 | Female | 44 | 16 | 14 | 22 | 165 | 96 | 35.29 | Obese |
| 4 | Female | 34 | 10 | 9 | 13 | 150 | 47 | 23.5 | Ex-smoker |
| 5 | Male | 40 | 20 | 13 | 26 | 168 | 98 | 34.75 | Ex-smoker, obese |
| 6 | Male | 49 | 8 | 6 | 12 | 165 | 110 | 40.44 | Smoker, severe obesity |
| 7 | Male | 40 | 14 | 12 | 17 | 169 | 82 | 28.77 | Ex-smoker, overweight |
| Mean | 37.43 | 16.00 | 13.14 | 22.43 | 159.57 | 84.14 | |||
| Median | 40.00 | 14.00 | 12.00 | 20.00 | 165.00 | 95.00 | |||
| SD | 10.518 | 7.303 | 6.283 | 11.900 | 9.710 | 24.423 | |||
| Total 11 | |||||||||
| Mean | 37.27 | 13.73 | 11.36 | 19.73 | 162.55 | 81.91 | |||
| Median | 40.00 | 14.00 | 12.00 | 17.00 | 165.00 | 84.00 | |||
| SD | 9.498 | 7.016 | 5.870 | 10.393 | 8.768 | 20.359 | |||
The data are reported as the mean, median and standard deviation (SD).
MV: mechanical ventilation; BMI: body mass index; ICU: Intensive Care Unit.
Perceived quality of life in the 11 patients evaluated with the EQ-5D six months after discharge from the ICU showed changes in the 5 components—particularly in the dimension pain/discomfort (P/D), with a mean score of 1.55±0.52, and to a lesser extent in the dimension personal care (PC), with a mean of 1.09±0.30. Regarding health condition reported by the VAS expressed as EQ%health, the mean score was 70%±24, with a range of 30–100%. The mean preference indices adjusted to the values validated for Argentina were 0.903±0.085 for TTO and 0.827±0.153 for the VAS (Table 2).
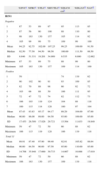
Quality of life perception scored with the EQ-5D questionnaire 6 months after discharge from the Intensive Care Unit.
| EQ MO | EQ PC | EQ DLA | EQ P/D | EQ A/D | EQ %health* | TTOa | VASb | |
| H1N1 | ||||||||
| Negative | ||||||||
| 1 | 1 | 1 | 1 | 1 | 1 | 100 | 1.000 | 1.000 |
| 2 | 1 | 1 | 1 | 2 | 1 | 50 | 0.887 | 0.792 |
| 3 | 1 | 1 | 1 | 1 | 1 | 90 | 1.000 | 1.000 |
| 4 | 1 | 1 | 1 | 2 | 2 | 85 | 0.887 | 0.737 |
| Mean | 1.00 | 1.00 | 1.00 | 1.50 | 1.25 | 81.25 | 0.94350 | 0.88225 |
| Median | 1.00 | 1.00 | 1.00 | 1.50 | 1.00 | 87.50 | 0.94350 | 0.89600 |
| SD | 0.000 | 0.000 | 0.000 | 0.577 | 0.500 | 21.747 | 0.065241 | 0.137808 |
| Minimum | 1 | 1 | 1 | 1 | 1 | 50 | 0.887 | 0.737 |
| Maximum | 1 | 1 | 1 | 2 | 2 | 100 | 1.000 | 1.000 |
| Positive | ||||||||
| 1 | 2 | 2 | 2 | 1 | 2 | 30 | 0.813 | 0.508 |
| 2 | 2 | 1 | 2 | 2 | 1 | 40 | 0.788 | 0.770 |
| 3 | 1 | 1 | 1 | 1 | 1 | 90 | 1.000 | 1.000 |
| 4 | 2 | 1 | 1 | 2 | 1 | 80 | 0.788 | 0.852 |
| 5 | 1 | 1 | 2 | 2 | 2 | 50 | 0.887 | 0.649 |
| 6 | 1 | 1 | 1 | 2 | 1 | 60 | 0.887 | 0.792 |
| 7 | 1 | 1 | 1 | 1 | 1 | 95 | 1.000 | 1.000 |
| Mean | 1.43 | 1.14 | 1.43 | 1.57 | 1.29 | 63.57 | 0.88043 | 0.79586 |
| Median | 1.00 | 1.00 | 1.00 | 2.00 | 1.00 | 60.00 | 0.88700 | 0.79200 |
| SD | 0.535 | 0.378 | 0.535 | 0.535 | 0.488 | 25.284 | 0.091573 | 0.178705 |
| Minimum | 1 | 1 | 1 | 1 | 1 | 30 | 0.788 | 0.508 |
| Maximum | 2 | 2 | 2 | 2 | 2 | 95 | 1.000 | 1.000 |
| Total 11 | ||||||||
| Mean | 1.27 | 1.09 | 1.27 | 1.55 | 1.27 | 70.00 | 0.90336 | 0.82727 |
| Median | 1.00 | 1.00 | 1.00 | 2.00 | 1.00 | 80.00 | 0.88700 | 0.79200 |
| SD | 0.467 | 0.302 | 0.467 | 0.522 | 0.467 | 24.597 | 0.085562 | 0.163580 |
| Minimum | 1 | 1 | 1 | 1 | 1 | 30 | 0.788 | 0.508 |
| Maximum | 2 | 2 | 2 | 2 | 2 | 100 | 1.000 | 1.000 |
The data are reported as the mean, median, standard deviation (SD) and minimum and maximum values.
EQ-5D dimensions: EQ A/D: anxiety/depression; EQ DLA: daily life activities; EQ PC: personal care; EQ P/D: pain/discomfort; EQ MO: mobility;
EQ%health: health condition on a visual analog scale (VAS) from 0 to 100%.
Perception or indices according to validation for Argentina; TTO: Time-Trade Off; VAS: visual analog scale.
Basal and post-bronchodilator spirometry revealed normal lung function in all patients, with mean values of over 80% (Table 3).
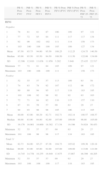
Spirometry 6 months after discharge from the Intensive Care Unit.
| PB % Pron FVC | PtB % Pron FVC | PB % Pron FEV1 | PtB % Pron FEV1 | PB % Pron FEV1/FVC | PtB % Pron FEV1/FVC | PB % Pron FEF 25–75 | PtB % Pron FEF 25–75 | |
| H1N1 | ||||||||
| Negative | ||||||||
| 1 | 78 | 81 | 81 | 87 | 106 | 109 | 97 | 121 |
| 2 | 77 | 72 | 85 | 84 | 111 | 117 | 117 | 134 |
| 3 | 92 | 90 | 102 | 102 | 111 | 114 | 158 | 173 |
| 4 | 103 | 100 | 108 | 109 | 105 | 109 | 127 | 134 |
| Mean | 87.50 | 85.75 | 94.00 | 95.50 | 108.25 | 112.25 | 124.75 | 140.50 |
| Median | 85.00 | 85.50 | 93.50 | 94.50 | 108.50 | 111.50 | 122.00 | 134.00 |
| SD | 12.396 | 12.010 | 13.038 | 11.958 | 3.202 | 3.948 | 25.435 | 22.517 |
| Minimum | 77 | 72 | 81 | 84 | 105 | 109 | 97 | 121 |
| Maximum | 103 | 100 | 108 | 109 | 111 | 117 | 158 | 173 |
| Positive | ||||||||
| 1 | 52 | 55 | 57 | 57 | 113 | 109 | 63 | 58 |
| 2 | 74 | 83 | 78 | 92 | 107 | 112 | 96 | 172 |
| 3 | 80 | 80 | 94 | 95 | 117 | 118 | 183 | 185 |
| 4 | 101 | 108 | 92 | 98 | 92 | 92 | 63 | 103 |
| 5 | 72 | 71 | 84 | 82 | 116 | 115 | 157 | 110 |
| 6 | 87 | 91 | 59 | 57 | 69 | 63 | 29 | 27 |
| 7 | 94 | 93 | 98 | 98 | 105 | 106 | 113 | 105 |
| Mean | 80.00 | 83.00 | 80.29 | 82.71 | 102.71 | 102.14 | 100.57 | 108.57 |
| Median | 80.00 | 83.00 | 84.00 | 92.00 | 107.00 | 109.00 | 96.00 | 105.00 |
| SD | 16.176 | 16.961 | 16.600 | 18.382 | 17.134 | 19.196 | 54.924 | 56.453 |
| Minimum | 52 | 55 | 57 | 57 | 69 | 63 | 29 | 27 |
| Maximum | 101 | 108 | 98 | 98 | 117 | 118 | 183 | 185 |
| Total 11 | ||||||||
| Mean | 82.73 | 84.00 | 85.27 | 87.36 | 104.73 | 105.82 | 109.36 | 120.18 |
| Median | 80.00 | 83.00 | 85.00 | 92.00 | 107.00 | 109.00 | 113.00 | 121.00 |
| SD | 14.745 | 14.758 | 16.255 | 16.949 | 13.675 | 15.867 | 46.399 | 48.205 |
| Minimum | 52 | 55 | 57 | 57 | 69 | 63 | 29 | 27 |
| Maximum | 103 | 108 | 108 | 109 | 117 | 118 | 183 | 185 |
The data are reported as the mean, median, standard deviation (SD) and minimum and maximum values.
PB%Pron (pre-bronchodilation): FEF 25–75: forced expiratory flow 25–75; FEV1: forced expiratory volume in the first second; FVC: forced vital capacity.
PtB%Pron (post-bronchodilation): FEF 25–75: forced expiratory flow 25–75; FEV1: forced expiratory volume in the first second; FVC: forced vital capacity.
The lung volumes and DLCO also reflected normal lung function in all cases, with mean values above 87% (Table 4).
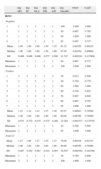
Pulmonary volumes and carbon monoxide diffusion capacity (DLCO) 6 months after discharge from the Intensive Care Unit.
| %SVCa | %FRCa | %TLCa | %RV/TLCa | %DLCO corb | %DL/AVb | %AVb | |
| H1N1 | |||||||
| Negative | |||||||
| 1 | 87 | 53 | 89 | 97 | 95 | 113 | 85 |
| 2 | 87 | 56 | 90 | 100 | 88 | 110 | 80 |
| 3 | 98 | 163 | 130 | 157 | 105 | 114 | 92 |
| 4 | 105 | 99 | 99 | 75 | 109 | 99 | 109 |
| Mean | 94.25 | 92.75 | 102.00 | 107.25 | 99.25 | 109.00 | 91.50 |
| Median | 92.50 | 77.50 | 94.50 | 98.50 | 100.00 | 111.50 | 88.50 |
| SD | 8.846 | 51.331 | 19.201 | 34.989 | 9.535 | 6.880 | 12.662 |
| Minimum | 87 | 53 | 89 | 75 | 88 | 99 | 80 |
| Maximum | 105 | 163 | 130 | 157 | 109 | 114 | 109 |
| Positive | |||||||
| 1 | 59 | 74 | 119 | 62 | |||
| 2 | 90 | 102 | 90 | 91 | 93 | 109 | 85 |
| 3 | 82 | 70 | 88 | 98 | 66 | 92 | 72 |
| 4 | 103 | 66 | 88 | 50 | 106 | 111 | 95 |
| 5 | 72 | 47 | 72 | 74 | 82 | 112 | 73 |
| 6 | 106 | 103 | 119 | 124 | 104 | 88 | 118 |
| 7 | 100 | 115 | 114 | 128 | 100 | 97 | 104 |
| Mean | 87.43 | 83.83 | 95.17 | 94.17 | 89.29 | 104.00 | 87.00 |
| Median | 90.00 | 86.00 | 89.00 | 94.50 | 93.00 | 109.00 | 85.00 |
| SD | 17.453 | 26.589 | 17.826 | 29.721 | 15.564 | 11.633 | 19.849 |
| Minimum | 59 | 47 | 72 | 50 | 66 | 88 | 62 |
| Maximum | 106 | 115 | 119 | 128 | 106 | 119 | 118 |
| Total 11 | |||||||
| Mean | 89.91 | 87.40 | 97.90 | 99.40 | 92.91 | 105.82 | 88.64 |
| Median | 90.00 | 84.50 | 90.00 | 97.50 | 95.00 | 110.00 | 85.00 |
| SD | 14.768 | 35.948 | 17.660 | 30.733 | 14.067 | 10.088 | 17.019 |
| Minimum | 59 | 47 | 72 | 50 | 66 | 88 | 62 |
| Maximum | 106 | 163 | 130 | 157 | 109 | 119 | 118 |
The data are reported as the mean, median, standard deviation (SD) and minimum and maximum values.
Patient H1N1+ 1 had no registries for %FRC, %TLC and %RV/TLC.
Pulmonary volumes (L): FRC: functional residual capacity; RV/TLC: residual volume adjusted to total lung capacity; SVC: vital capacity; TLC: total lung capacity.
Diffusion (ml/min/mmHg): DL/AV: lung diffusion adjusted to alveolar volume; DLCO: carbon dioxide diffusion capacity; AV: alveolar volume.
There were no statistically significant differences among the variables subjected to analysis of variance (ANOVA): DLCO p=0.95; EQ5health p=0.52; TTO p=0.52 and VAS p=0.82. Likewise, no significant differences were recorded on applying the chi-squared test: DLCO p=1.0; EQ%health p=0.99; TTO p=0.48 and VAS p=0.55.
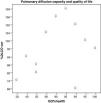
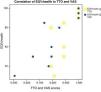
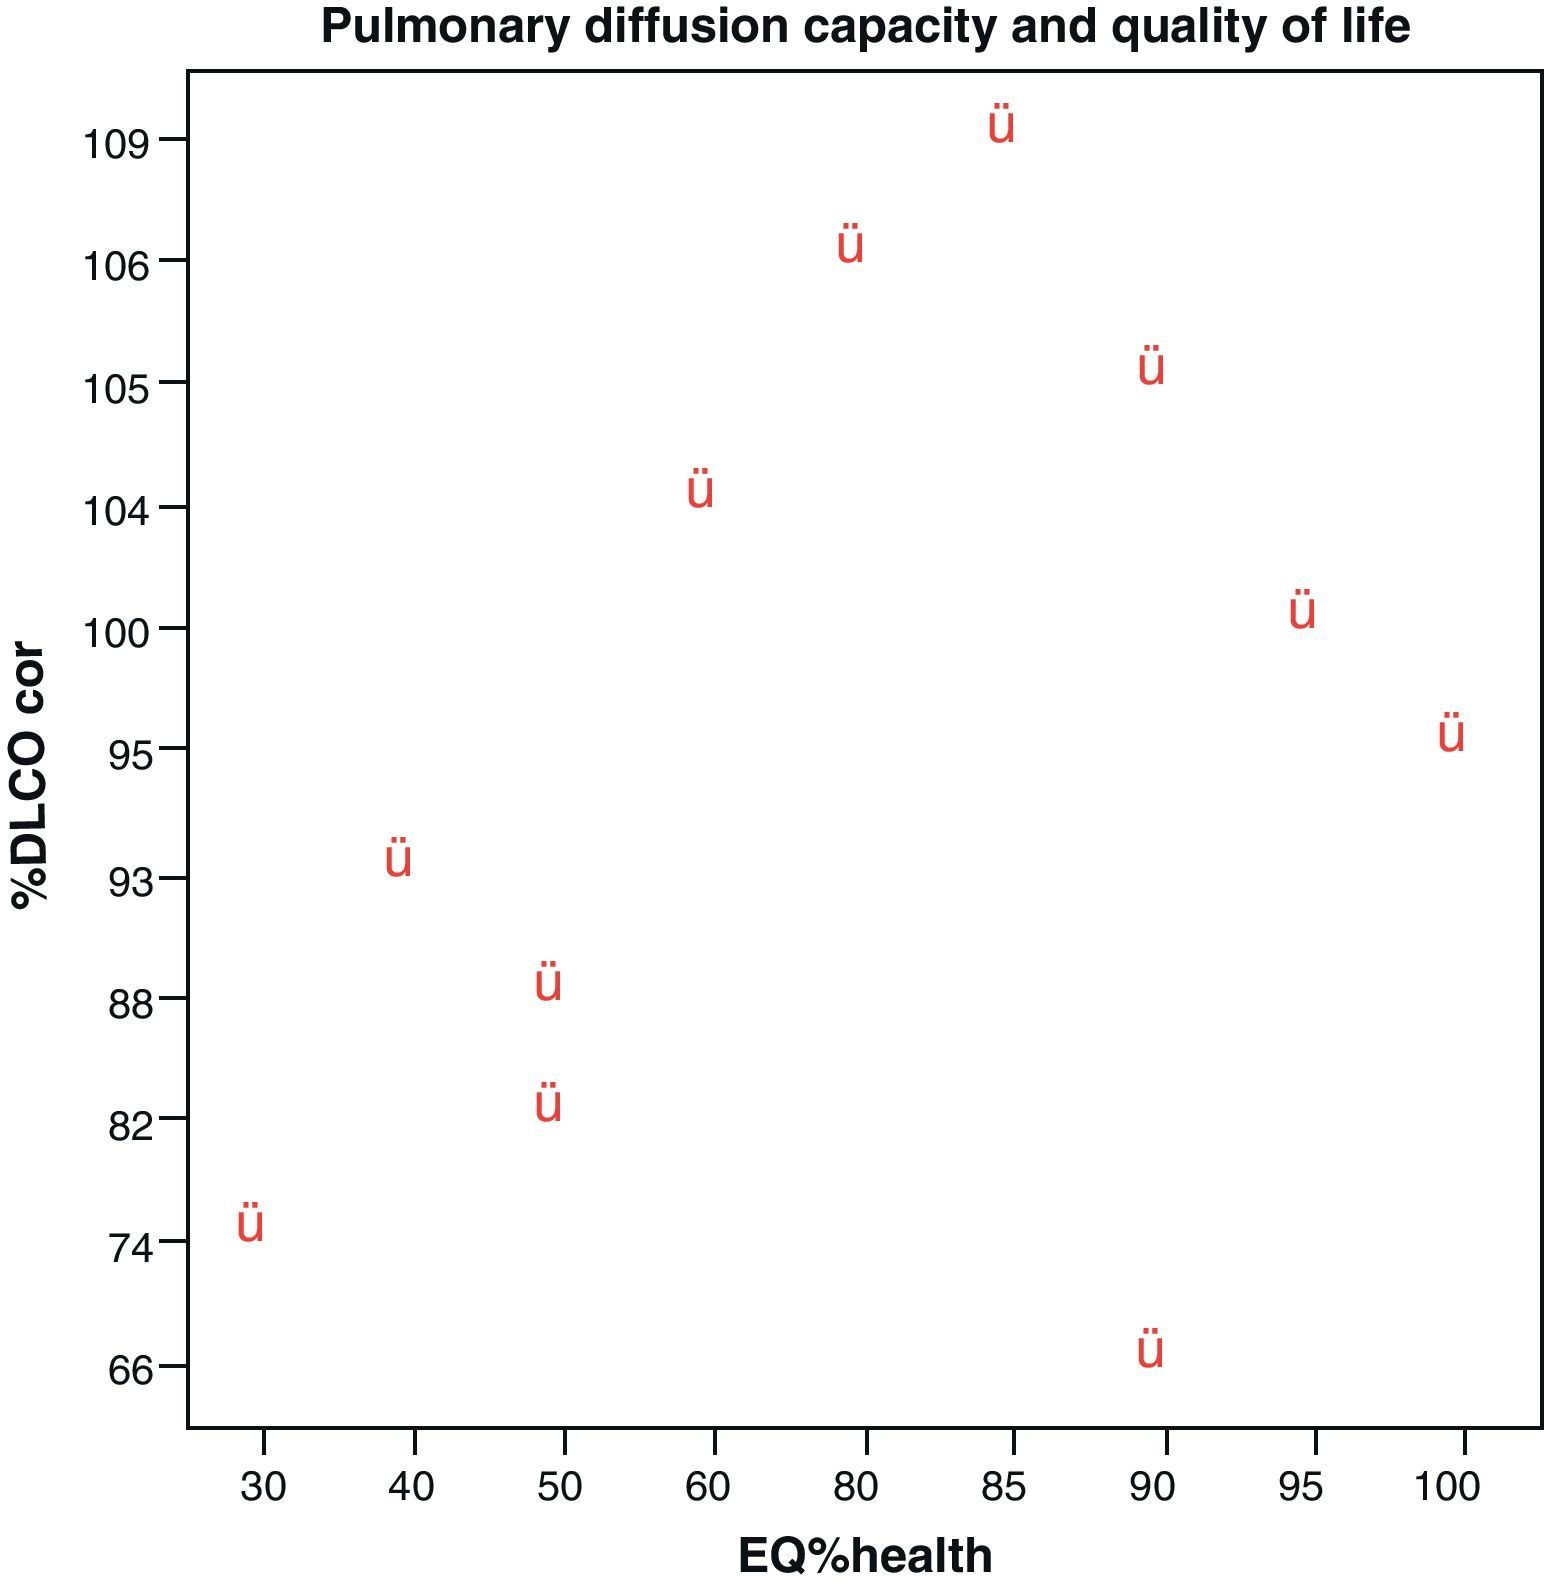
No correlations were found among the variables, lung diffusion capacity as expressed by %DLCO, and perceived quality of life as evaluated by EQ%health (p=0.265) (Fig. 1). Paired correlation of the variables EQ%health–TTO and EQ%health–VAS showed good correlation between these variables, with p=0.009 and p=0.001, respectively (Fig. 2).

Correlation between EQ%health versus TTO (p=0.009) and EQ%health versus VAS (p=0.001). Yellow points: EQ%health-TTO relationship (only 9 points are observed because two patients have the same EQ%health 90% and TTO 1.0, and two patients have the same EQ%health 50% and TTO 0.887). Blue points: EQ%health-VAS relationship (only 10 points are observed because two patients have the same EQ%health 90% and VAS 1.0).
Although our study sample is small, the results obtained suggest that patients with ARDS secondary to influenza A H1N1 evaluated 6 months after discharge from the ICU show no worsening of lung function, as reflected by both the spirometric findings and the carbon monoxide diffusion test. We consider that the observed functional behavior is attributable to the triggering cause, and since this is a viral infection in which the underlying pathogenic mechanism involves an important deregulated inflammatory response, the severity and course of the disease during the active viral replication phase would largely explain the situation and would also explain why the process is more self-limiting and involves fewer sequelae after the acute phase in those patients who survive. Regarding quality of life, and although moderate worsening was observed in all the EQ-5D dimensions (particularly pain/discomfort, motor function, and daily life activities), none proved statistically significant. A recent multicenter prospective study found ARDS survivors evaluated after 6 months to have poor quality of life15; however, in contrast to the descriptions in the literature, the impact in our series of patients was moderate. The above observations suggest that the behavior of ARDS secondary to viral infection is different from that of ARDS due to other causes.
Over 60 causes of ARDS have been identified, though epidemiological studies show most ARDS episodes to be associated to predisposing factors. Among the possible causes, mention must be made of sepsis as the most common factor, followed by others including bronchial aspiration, infectious pneumonia, severe trauma or burns, massive blood transfusion, plasma transfusion, airway obstruction, organ transplantation, etc.16
The patients who survive ARDS present sequelae affecting respiratory function, health-related quality of life, physical activity, and cognitive and emotional function.17
The appearance of the influenza A virus (H1N1) 91 years ago gave rise to a global pandemic with catastrophic consequences. In 2009, the influenza A virus (H1N1) was an emergent respiratory agent in Mexico, followed by further cases in other countries, and reaching level 6 (pandemic status) according to the World Health Organization (WHO).16 At present, the literature offers many reports of ARDS secondary to the influenza A H1N1 pandemic of 2009,17,18 though little is known about the long-term pulmonary function and quality of life of these patients. As a result, the data obtained in our study would indicate important and relatively rapid recovery on the part of patients with this particular type of viral infection, in contrast to situations involving other causes of ARDS.
In order to determine whether the loss of health-related quality of life in ARDS patients is secondary to the actual syndrome or to other aspects related to the disease process causing ARDS, Davidson et al. conducted a paired case study of 73 patients with ARDS and 73 patients with risk factors for ARDS. The health condition of the patients was assessed using generic health (Medical Outcomes Study 36-Item Short Form Health Survey, Standard Form [SF-36]) and specific lung function scales (St George's Respiratory Questionnaire [SGRQ]). The patients with ARDS showed significant reductions on both scales, and the greatest limitations corresponded to the dimensions referred to physical and pulmonary capacity.14,19
Other authors using these scales or other instruments such as the Quality of Well-Being Scale (QWB) have also reported worsened quality of life among survivors 6 and 12 months after hospital discharge. In our series the EQ-5D showed increased worsening referred to mobility and anxiety/depression, with a 30% decrease in perceived health, 6 months after discharge from the ICU.
There have been descriptions of alterations in the lung function tests, including a decrease in forced expiratory volume in the first second (FEV1) that can persist during the first year after patient discharge, as well as decreases in forced vital capacity (FVC) and carbon monoxide diffusion capacity (DLCO).20–22 In contrast to these reports, we observed no such alterations in our series, where most of the functional tests proved normal. Although the series is small, the 11 patients with H1N1 infection (confirmed or otherwise) showed disease of similar severity according to the ARDS diagnostic criteria of the European-American consensus,23 and our observations could indicate a possible behavior or tendency in this type of viral infection.
Physical activity estimated with the SF-36 in 109 survivors has been reported to increase to 25 points after 12 months—the score in the normal population being 84 points. Such physical impairment was confirmed in the mentioned study and in the work published by Schelling et al., based on the 6-min walking test.
Regarding the neuropsychological sequelae, the studies that have examined this aspect have found a significant percentage of survivors to suffer worsened cognitive function at discharge from hospital and at long term.24–26 Hopkins et al. found 46% of the survivors to suffer at least one of the following alterations one year after hospital discharge: memory problems, concentration and/or attention difficulties, and slowed mental processing. These same authors evaluated the neuropsychological sequelae after two years and found that these problems persisted in 47% of the patients—fundamentally in the form of anxiety and depression.27 Such mental problems have been related to the development of posttraumatic stress syndrome. These data are similar to those obtained in our own series, where anxiety and depression were seen to persist after 6 months in 27% of the patients, and perceived quality of life moreover decreased 30%.
Augustovski et al., developed reference values based on the EuroQol-5D, using the VAS and TTO with logistic regression models to assess the health conditions of the Argentinean population—the proposed values being VAS: 0.858 and TTO: 0.908.13 The weighting of quality of life using the indices with the validated and recommended values reveals a discrete reduction for the global series.
Patients with ARDS usually show significant worsening of the quality of life scores—the greatest limitations corresponding to physical and lung capacity.28,29 Our case series is too small to draw firm conclusions referred to patients with ARDS due to influenza A H1N1, though it is nevertheless very interesting to know the behavior of respiratory function and wellbeing in this group of patients, since the literature offers no studies on this subject. We observed no correlation between patient lung function and wellbeing. A notorious finding was the fact that 6 months after discharge, lung functional recovery was almost complete; it is therefore interesting to determine whether this is due to the viral cause underlying ARDS or to other factors.
ConclusionAlthough our study series is small, the results suggest that patients with ARDS secondary to influenza A H1N1 evaluated 6 months after discharge from the ICU do not show worsened lung function, and the impact upon quality of life is moderate—in contrast to the situation seen in patients with ARDS due to other causes.
Conflicts of interestThe authors declare no conflicts of interests.
Please cite this article as: Quispe-Laime AM, et al. Capacidad de difusión pulmonar y calidad de vida a los 6 meses del alta de la unidad de cuidados intensivos en sobrevivientes a síndrome de distrés respiratorio agudo por influenza A H1N1. Med Intensiva. 2012;36:15–23.