
To establish a new machine learning-based method to adjust positive end-expiratory pressure (PEEP) using only already routinely measured data.
DesignRetrospective observational study.
SettingIntensive care unit (ICU).
Patients or participants51811 mechanically ventilated patients in multiple ICUs in the USA (data from MIMIC-III and eICU databases).
InterventionsNo interventions.
Main variables of interestSuccess parameters of ventilation (arterial partial pressures of oxygen and carbon dioxide and respiratory system compliance)
ResultsThe multi-tasking neural network model performed significantly best for all target tasks in the primary test set. The model predicts arterial partial pressures of oxygen and carbon dioxide and respiratory system compliance about 45 min into the future with mean absolute percentage errors of about 21.7%, 10.0% and 15.8%, respectively. The proposed use of the model was demonstrated in case scenarios, where we simulated possible effects of PEEP adjustments for individual cases.
ConclusionsOur study implies that machine learning approach to PEEP titration is a promising new method which comes with no extra cost once the infrastructure is in place. Availability of databases with most recent ICU patient data is crucial for the refinement of prediction performance.
Establecer un nuevo método basado en el aprendizaje automático para ajustar la presión positiva al final de la espiración (PEEP según sus siglas en inglés) utilizando únicamente datos ya obtenidos de forma rutinaria.
DiseñoEstudio retrospectivo de observación.
ÁmbitoUnidad de cuidados intesivos (UCI)
Pacientes o participantes51811 pacientes ventilados mecánicamente en múltiples UCIs de EE.UU. (tomados de las bases de datos MIMIC-III y eICU).
IntervencionesSin intervenciones.
Variables de interés principalesParametros de éxito de la ventilación (presiones parciales arteriales de oxígeno y dióxido de carbono y distensibilidad del sistema respiratorio).
ResultadosEl modelo de red neuronal multitarea obtuvo los mejores resultados en todos los objetivos del conjunto de pruebas primario. El modelo predice las presiones parciales arteriales de oxígeno y dióxido de carbono así como la distensibilidad del sistema respiratorio con aproximadamente 45 minutos de anticipación, mostrando errores porcentuales absolutos medios de aproximadamente 21.7%, 10.0% y 15.8%, respectivamente. El uso propuesto del modelo se demostró en situaciones hipotéticas en las que se simularon los posibles efectos de los ajustes de PEEP para casos individuales.
ConclusionesNuestro estudio implica que el enfoque de aprendizaje automático para el ajuste de la PEEP es un método nuevo y prometedor que no supone ningún coste adicional una vez que se dispone de la infraestructura necesaria.La disponibilidad de bases de datos con información de pacientes de UCI más recientes es crucial para perfeccionar el rendimiento de la predicción.
Mechanical ventilation is one of the principal therapeutic methods applied in critically ill patients treated in intensive care units (ICU). Selection of ventilator parameters is being performed countless times every day worldwide. One of the most controversial settings is the positive end-expiratory pressure (PEEP). Large clinical studies showed the importance of PEEP selection for patient mortality, although not in a consistent way.1–3 The least one can conclude from these studies is that setting an individually adequate PEEP is an important and difficult task.
The aim of mechanical ventilation is to secure sufficient respiratory gas exchange while, at the same time, causing as little harm to the patient as possible. The importance of PEEP lies in its ability to counteract the collapse of alveoli at the end of expiration, which occurs especially in various pathological conditions. By providing a positive pressure, PEEP helps to stabilize the distal airways, maintain lung volume, and improve oxygenation. However, the selection of PEEP is not a one-size-fits-all approach, as different patients may require individualized PEEP settings based on their underlying pathology, lung mechanics, and hemodynamic status. Inadequate or excessive PEEP levels can lead to adverse effects and exacerbate lung injury. Insufficient PEEP may result in atelectasis, atelectrauma, that is inflammation caused by cyclic alveolar reopening, and impaired oxygenation. On the other hand, excessive PEEP can cause overdistension of alveoli, hemodynamic compromise, and barotrauma.4
There is a range of established methods for PEEP optimisation. PEEP can be set as a function of the required fraction of inspired oxygen (FiO2)5 or chosen to optimise respiratory system compliance (Crs) following a PEEP trial.6 More sophisticated methods make use of additional medical equipment such as an eosophageal pressure probe7 or electrical impedance tomography.8,9 While these are very promising approaches which offer new insight into the topic, their use is associated with extra material cost and it requires additional effort of trained personnel. Probably the most common method to optimise PEEP relies on personal clinical experience of the attending medical personnel as well as trial and error, which is hard to evaluate objectively. All in all, there is no consensus about the best approach to optimise PEEP.
In the last years, there have been huge advances in machine learning, in particular concerning neural networks. At the same time, there is a trend to record and save more and more data in the ICU setting. In combination, these facts lead to an increase of machine learning-based clinical decision support systems in the ICU, see Ref.10 for a recent review, or Ref.11 for a review more centered on mechanical ventilation. The task we present here is a regression problem with tabular data. Classic machine learning algorithms like tree-based methods have traditionally been, and still are, considered to be state-of-the-art for these problems.12 With respect to regression problems in the ICU setting, some publications are especially important: Similar to our study, Ghazal et al. tried to predict oxygen saturation in infants after a change in ventilator settings.13 The authors ultimately did not reach satisfactory accuracy, supposedly because of insufficient data. Relying on classical machine learning techniques, Luo et al. predicted laboratory results from previously known other laboratory results,14 however, without incorporating other measurement data. With VentAI, Peine et al. aimed to find the best ventilator settings (PEEP, FiO2 and tidal volume) with reinforcement learning,15 also using the MIMIC-III and eICU databases. The reinforcement learning approach is considerably more complex than the supervised learning approach used in this work but offers the possibility to consider the treatments’ long-term effects like mortality more easily. Very similarly, Komorowski et al. tried to find the best treatment regime for the circulatory system (catecholamines versus intravenous fluids) in sepsis16 with a reinforcement learning approach.
In this work, we aim to establish a new machine learning-based method to adjust PEEP using only already routinely measured data. The model is supposed to offer the clinician predictions for the possible effects of a PEEP change on important success parameters of ventilation.
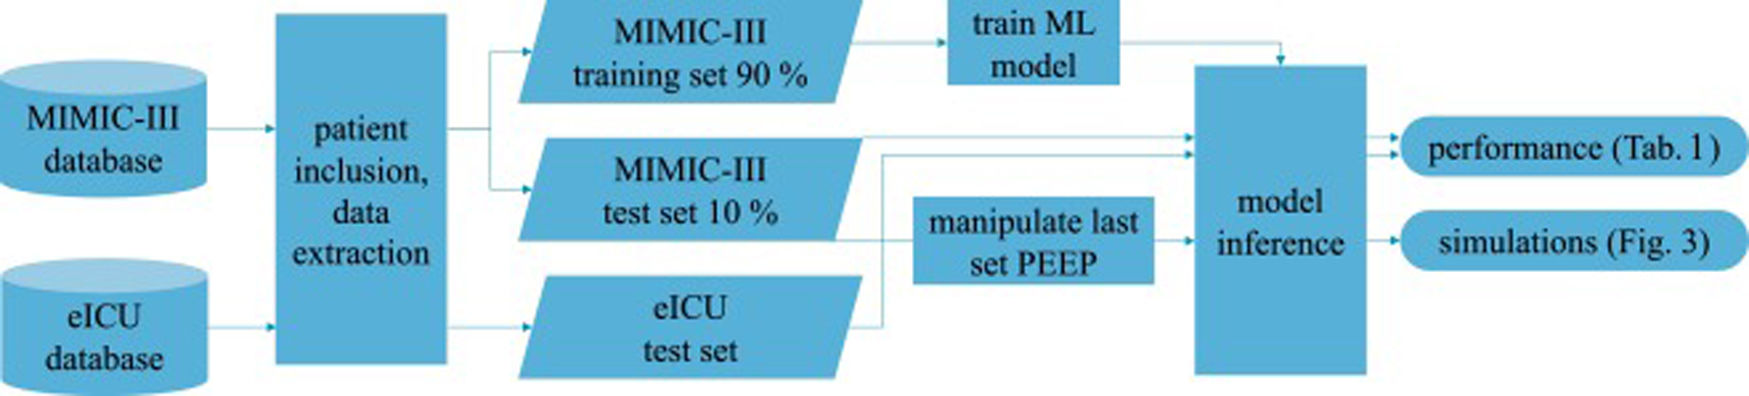
Patients and methodsFig. 1 shows an overview of the workflow that we applied in this study.
Data sources
This is a retrospective observational study which makes use of two large intensive care databases:
MIMIC-III databaseIn the field of intensive care databases for machine learning there is one database that stands out in its size, quality and frequency of use in machine learning publications. Medical Information Mart for Intensive Care III (MIMIC-III) is an openly accessible database of over 40000 patients that were treated in the ICU of the Beth Israel Deaconess Medical Center in Boston between 2001 and 2012.17 The database includes demographic data, vital signs, laboratory results, interventions, medication, notes of the medical personnel, radiologic findings and mortality data of over 60000 ICU stays. We used this database as a training (90%) and test (10%) set.
eICU databaseThe eICU Collaborative Research Database holds data associated with over 200000 patient stays recorded in numerous ICUs in the United States between 2014 and 2015, made available by Philips Healthcare in partnership with the MIT Laboratory for Computational Physiology.18 As far as the contents are concerned, this database is similar to the MIMIC-III database with the advantage of being more diverse because of its multiple origins. In this work we used this second database as an additional independent test set the model never was confronted with during training.
From these databases we included all mechanically ventilated patients over the age of 16 years. In the MIMIC-III database, patients were included if they had a running ventilation event according to mimic-code ventilation durations, which is supplied with the database. In the eICU database, patients were included if they had a documented PEEP setting or a documented set tidal volume setting within 1 h of the measurement of a target variable.
Data preprocessingWe started with all time points where the desired target variable has been measured (ground truth). For each of these events, we collected the desired input variables according to a predefined template from the minutes and hours before (see Online Supplement Table 1).
The used items have different characteristics: items can either be set (FiO2, PEEP, norepinephrine rate) or measured (peripheral oxygen saturation (SpO2), body temperature, mean arterial pressure); they can be timed (SpO2, FiO2) or constant over one ICU stay (age, height); they can be continuous (SpO2, temperature) or categorial (ventilator mode, sex). From these items we always took the latest measurement that was available before the time of measurement of the target variable. In order to include older measurements for some items, we discarded the latest n minutes before selecting a measurement (denoted as “item name [n]”). This approach helped to mitigate the effects of the varying frequency of available measurements for some items. Whenever columns contained missing values, an extra boolean column indicating the presence/absence of values was added and the missing values were imputed as the median (or as an extra category for categorial variables). We performed only minimal data curation: removal of impossible values and conversion of units or representations to be identical for one variable in case they varied considerably between but also within one database(s) (temperature, height, weight, fractions vs. percentages, ventilator mode names). All values were normalized to mean 0 and standard deviation 1 before being entered into the neural network models.
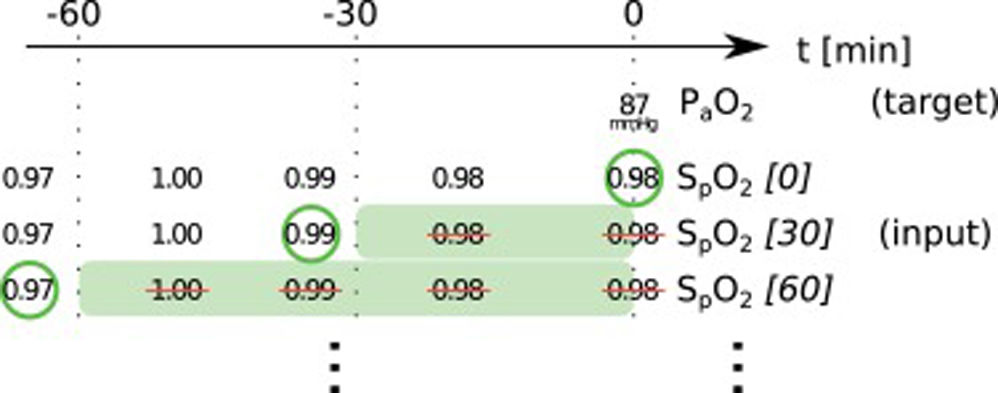
In this paper, we present two similar setups, representing two clinical use cases. In the all data setup, the model predicts one or more target variables at a certain point in time, using all data that is available up to that time. This aims to help clinicians with real-time information instead of them having to wait for the results of a blood gas analysis or other measurement. Fig. 2 illustrates how we selected and preprocessed measurements for the all data setup. The 30 min blinded setup is identical to all data except that all measured variables (i.e., variables that are not set) in the last 30 min are removed. This corresponds to a prediction 30−60 min into the future. This model is used in the simulation setting which is explained below.
. Every row represents one item in the template, numbers in square brackets indicate the time t in minutes up to which the variable was blinded, also represented by the shaded green blocks indicating intervals that were discarded before selecting measurements; green circles indicate selected measurements for every item.")
Preprocessing scheme for one example observation of the target variable arterial partial pressure of oxygen (PaO2). Every row represents one item in the template, numbers in square brackets indicate the time t in minutes up to which the variable was blinded, also represented by the shaded green blocks indicating intervals that were discarded before selecting measurements; green circles indicate selected measurements for every item.
We included every available event (i.e., measurement of the target variables) either in the training or test sets to get the maximum amount of data. The training-test-split of the MIMIC-III dataset was performed on the patient level with 10% of the patients being assigned to the test set. The whole eICU dataset was used as an additional independent test set.
Model selection, training, and testingThe neural network models use a fully connected artificial neural network with only 1 layer with 256 nodes with a rectified linear (ReLU) activation function. Categorial variables were represented using embeddings of sizes 3–7. Settings for the training were as follows: Learning rate 2 · 10−3 with Adam optimiser, 20 epochs. For regularisation we used a weight decay of 0.1 and a dropout of 0.04 for the embeddings and 0.5 for the fully connected layer. A batch normalization layer is applied to continuous inputs. Comparable simple model architectures and choices of hyperparameters have proven effective in kaggle machine learning competitions about similarly set problems. We did not perform any hyperparameter tuning on test data.
We also trained a random forest model with the same data as a reference (50 trees, no maximum depth, loss function MSLE). Again, we did not perform any hyperparameter tuning on test data.
With the used target variables, we care for relative rather than absolute errors. Therefore, we opted for mean squared logarithmic error (MSLE) as our loss function. We trained the model for every target variable individually as well as together in the sense of multi-task learning.19 In the latter case, the mean of the individual loss functions for each task was used as loss function. Implementation of the neural network models was done with pytorch and the fast.ai framework.20
As metrics we report the mean absolute error (MAE) and the mean absolute percentage error (MAPE) of predictions for all target variables in the test set. To gauge performance transfer, we report performance on the held-back MIMIC-III test set along with the eICU test set.
As a subgroup analysis, we tested the regression performance of the neural network model on a subgroup of patients. For this analysis, we included only patients where chronic obstructive pulmonary disease (COPD) was documented in the diagnosis list.
To statistically compare model performances, we applied a Wilcoxon signed-rank test (as implemented in the SciPy Python package) on the models’ errors (MAPE) of individual samples. The significance level was 5%. To correct for multiple testing, we applied Bonferroni correction for the 12 statistical comparisons, resulting in a Bonferroni threshold of 0.42%.
InterpretabilityWe estimated the feature importance of the input variables with a permutation approach21 To do this, the values for all single input variables were permuted across every observation in the batch in turn. The resulting difference in loss compared to the unpermuted data reflects the importance of any single input variable. For example, to estimate the importance of the “age” variable, its values were shuffled across all events, leaving the rest of the dataset untouched. The resulting decrease in prediction performance compared to the performance on the original dataset is an indicator for the importance of the “age” variable.
SimulationBased on the 30 min blinded setup, it is possible to make predictions about the expected effects of PEEP changes by presenting the model input data where the latest set PEEP value has been manipulated. As stated above, we carefully removed all measured variables for the time frame in question in order to blind the model from the real effects of the set PEEP that might have been altered by the manipulation. For example, to simulate the effect of a PEEP increase of 5 cmH20 30−60 min into the future, we increase the last set PEEP (from 30 to 60 min in the past) by 5 cmH2O.
ResultsPrimary resultsFrom the MIMIC-III/eICU dataset, we included a total of 205734/133232, 205736/131796 and 207377/168961 individual observations for arterial partial pressure of oxygen PaO2, arterial partial pressure of carbon dioxide PaCO2 and Crs, respectively. These observations originated from 16189/35622 patients. They represent all available observations for the included patients; none were excluded. Information about missing values, descriptive statistics and correlations of the input variables can be found in the Online Supplements.
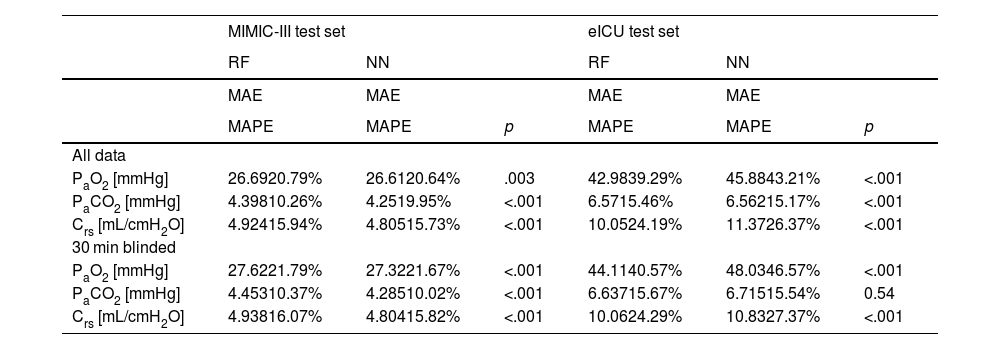
We compared three computational settings: random forest, individual neural network models for all target variables and one multi-tasking neural network model for all target variables. The results from the individual neural network models were consistently worse than those of the multi-tasking neural network (Online Supplement Table 2), thus they were discarded from further analyses and are not shown in the main text. Consequently, Table 1 presents the results obtained with the other two models: the random forest and the multi-tasking neural network. Their performance was statistically compared using the MAPE metric. In the MIMIC-III test set, the neural network model performed significantly better for all tasks (PaO2, PaCO2, Crs) and both settings (all data, 30 min blinded) except PaO2 in the all data setting. The error rates for all models and tasks were considerably higher when moving from the MIMIC-III test set to the eICU test set. Here, the random forest produced significantly better results for PaO2 and Crs for both settings. The neural network only had significantly lower error rates than the random forest when comparing PaCO2 in the all data setting.
Performance of models for both setups. Significantly better (lower) metrics highlighted.
| MIMIC-III test set | eICU test set | |||||
|---|---|---|---|---|---|---|
| RF | NN | RF | NN | |||
| MAE | MAE | MAE | MAE | |||
| MAPE | MAPE | p | MAPE | MAPE | p | |
| All data | ||||||
| PaO2 [mmHg] | 26.6920.79% | 26.6120.64% | .003 | 42.9839.29% | 45.8843.21% | <.001 |
| PaCO2 [mmHg] | 4.39810.26% | 4.2519.95% | <.001 | 6.5715.46% | 6.56215.17% | <.001 |
| Crs [mL/cmH2O] | 4.92415.94% | 4.80515.73% | <.001 | 10.0524.19% | 11.3726.37% | <.001 |
| 30 min blinded | ||||||
| PaO2 [mmHg] | 27.6221.79% | 27.3221.67% | <.001 | 44.1140.57% | 48.0346.57% | <.001 |
| PaCO2 [mmHg] | 4.45310.37% | 4.28510.02% | <.001 | 6.63715.67% | 6.71515.54% | 0.54 |
| Crs [mL/cmH2O] | 4.93816.07% | 4.80415.82% | <.001 | 10.0624.29% | 10.8327.37% | <.001 |
NN: neural network, RF: random forest, PaO2: arterial partial pressure or oxygen, PaCO2: arterial partial pressure of carbon dioxide, Crs: respiratory system compliance, MAE: mean absolute error, MAPE: mean absolute percentage error.
The error rates (MAPE) of the neural network in the all data setting on the MIMIC-III test set were 20.6% (PaO2), 10.0% (PaCO2) and 15.7% (Crs), respectively. On the eICU test set they were 43.2% (PaO2), 15.2% (PaCO2) and 26.4% (Crs). In the 30 min blinded setting on the MIMIC-III test set the neural network achieved 21.7% (PaO2), 10.0% (PaCO2) and 15.8% (Crs) mean absolute percentage error. On the eICU test set the error rates were 46.6% (PaO2), 15.5% (PaCO2) and 27.4% (Crs).
For the COPD subgroup analysis, 1608/3081 patients with 57326/26847 events from the MIMIC-III/eICU dataset met the inclusion criteria. The results in the all data setting were 19.6% (PaO2), 10.0% (PaCO2) and 15.1% (Crs) for in the MIMIC-III test set and 42.4% (PaO2), 17.6% (PaCO2), 27.9% (Crs) for the eICU test set.
InterpretabilityUsing the permutation approach, we calculated feature importance information for the neural network model resulting in Online Supplement Table 3.
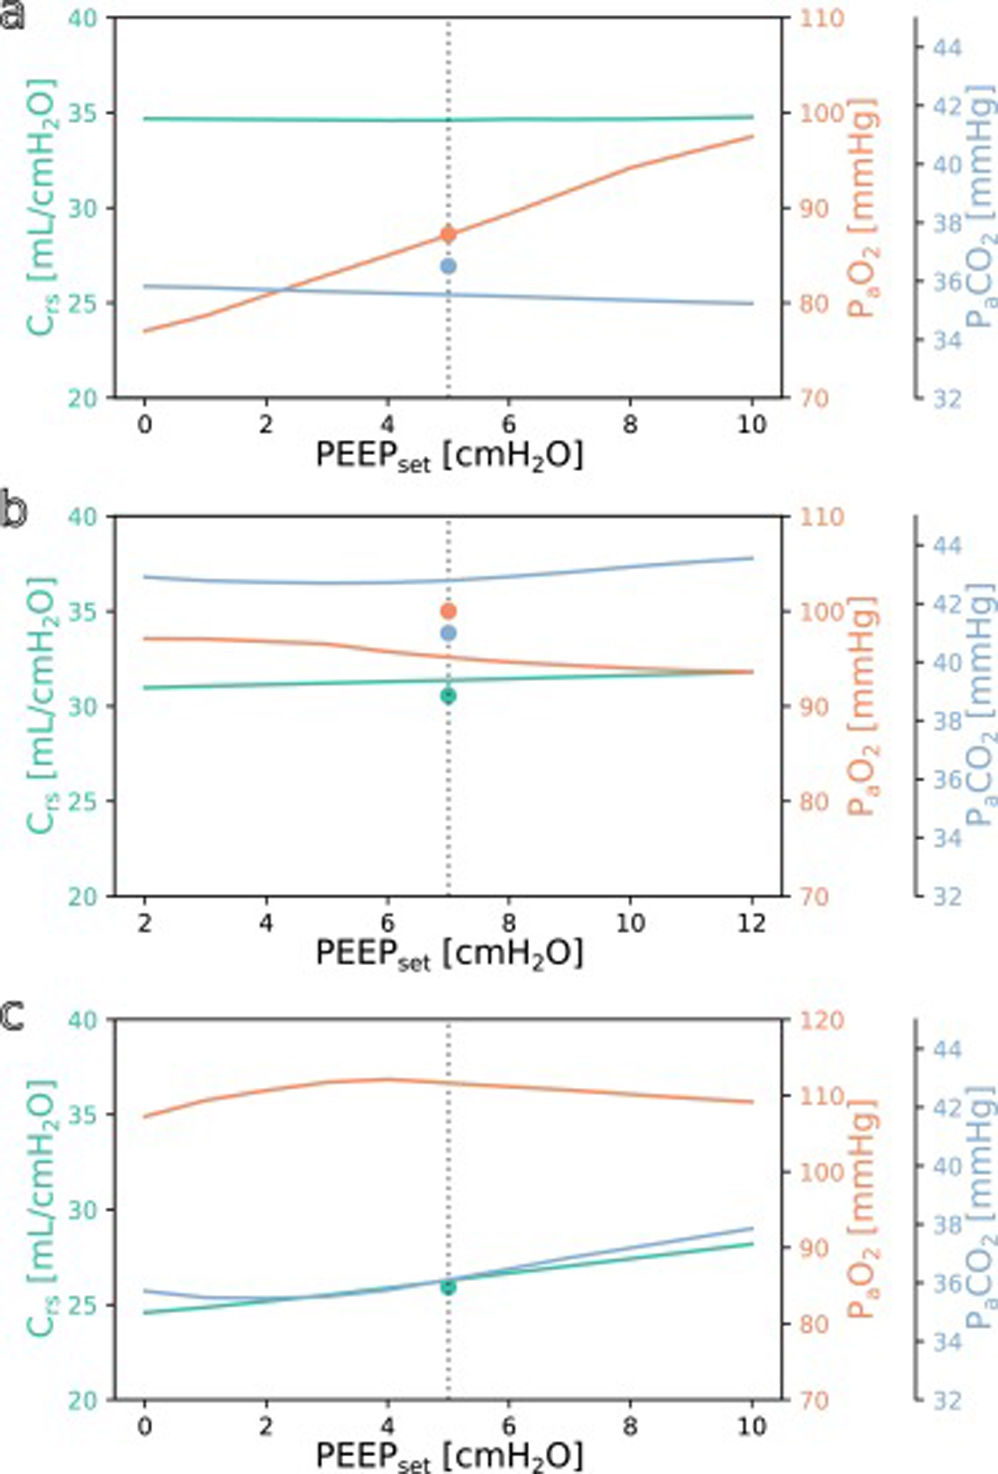
SimulationFig. 3 shows simulations for a range of possible PEEP changes and their effect on the three target variables for three example inputs. Predictions for the three target variables are displayed in different colours over a shared X-axis, indicating the simulated PEEP. The range of simulated PEEP values was arbitrarily chosen to be +/− 5 cmH2O around the actually set PEEP. The dotted vertical line in the center indicates the current PEEP. From there the expected effects on the target parameters can be observed by stepping to the left (decrease of PEEP) or right (increase of PEEP). Circles show measurements of the ground truth for comparison.
 Simulation for the above example with the values from Online Supplement Table 1 as the only inputs: improved oxygenation is expected with increasing PEEP. (b and c) Same but for different patients: oxygenation is not expected to improve with increasing PEEP. Please note the altered scale for PaO2 in c. The vertical dotted lines indicate the last set PEEP value. Circles denote the respective ground truth.")
Simulation results for different PEEP values. (a) Simulation for the above example with the values from Online Supplement Table 1 as the only inputs: improved oxygenation is expected with increasing PEEP. (b and c) Same but for different patients: oxygenation is not expected to improve with increasing PEEP. Please note the altered scale for PaO2 in c. The vertical dotted lines indicate the last set PEEP value. Circles denote the respective ground truth.
The three presented example cases illustrate that the predictions and target values are in good accordance (ground truth circles are near their prediction lines). In example a (event/patient from Online Supplement Table 1) the expected PaO2 increased considerably with increasing PEEP while the expected Crs and PaCO2 remained mostly unchanged. In example b, increasing the PEEP was not expected to improve oxygenation. In the third example c, the predicted PaO2 forms an inverted U-shape, indicating that the chosen PEEP was near the optimum with respect to oxygenation. Crs and PaCO2 were expected to increase with higher PEEP settings. Note that there were no ground truth measurements for some of the target values in examples a and c.
DiscussionIn this work, we presented a machine learning-based method to adjust PEEP using only already routinely measured data. Using simulations, the model offers the clinician predictions for the possible effects of a PEEP change on success parameters of ventilation.
Justification of choicesThe input variables used in our models were chosen with two aspects in mind: on the one side, we included those measurements that provide information about the general state of health of the patient (mostly demographics and variables also used in the SOFA score), on the other side, we included common ventilator settings and measurements as well as measurements included in routine patient monitoring in the ICU. With these, we were in parts limited by what values were available in both the MIMIC-III and the eICU databases. The selection of input variables was based solely on the expected medical importance of the features.
For our target variables we chose PaO2 and PaCO2, as these are the main indicators of successful gas exchange. Aside from the use as target variables, the oxygenation response to a PEEP change might also predict mortality,22 in this setting possibly even without actually changing the PEEP. We also included Crs as one of the oldest indicators of “best PEEP”.23 This parameter also helps to find ventilator settings with a low driving pressure and possibly a low transpulmonary pressure which might mitigate ventilator associated lung injury.24 The time it takes for different variables to reach steady states after a PEEP change ranges from 5 to over 60 min and depends on the variables in question and on the direction of the PEEP step.25 We chose 30−60 min as our prediction horizon as a compromise between the quantity of expected changes and the uncertainty and, thus, difficulty of the prediction task. A longer prediction horizon would not offer more information about the effect of a PEEP change because all target values would already have reached a steady state. Because of the binning of the variables, the choice of blinding 30 min is equivalent to a prediction 30−60 min into the future.
With a random forest and fully connected neural networks, we deliberately chose established, relatively simple models. The focus of this work lies not on testing or benchmarking different architectures, which is why we also refrained from employing complex data imputation techniques, explicit feature selection methods and extensive hyperparameter tuning (for a recent detailed comparison of algorithms see Ref.12). Instead we want to present an approach to a previously unaddressed but practically relevant problem, and want to show that even simple, unoptimized models can yield useful results.
Advantages of this approachMethods for clinical decision support become more and more common. The strength of this tool is that it offers a very high degree of individualisation while at the same time being relatively easy to apply. Once the digital infrastructure is set up, the model takes a small number of routine measurements and outputs results. No additional materials, measurements, interventions, or maneuvers are necessary. This simplicity extends to the model itself, making it easily comprehensible and explainable to clinical users Moreover, the model can be trained in less than five minutes using a single consumer graphics processing unit, allowing for regular training or fine-tuning, even in changing circumstances such as the onset of a pandemic. Another advantage that comes with the simplicity of the approach is its applicability to similar problems: A new model for a different task can be trained within minutes by only specifying the corresponding new input and output items. Consequently, the wealth of information contained in vast clinical databases can be harnessed to address numerous previously overlooked “smaller” problems, in contrast to the extensively studied “large” problems such as sepsis, mortality, or length of stay prediction.
Sometimes clinical decision support systems seem to take the power out of the clinician’s hand because they learn to rely on a proposed decision. The advantage of the solution presented here is that the clinicians still can and have to balance the expected effects on the different target variables and make their own decisions. We therefore refrain from offering concrete rules as to how one should react to certain model or simulation outputs.
With mean absolute percentage errors of 21.7% (PaO2), 10.0% (PaCO2) and 15.8% (Crs) for the three tasks on the MIMIC-III test set, the model appears to reach a clinically useful performance level, especially for the latter two parameters. To determine the caretaker acceptance and the perceived and actual benefit for patient care, a clinical study would be needed. Overall, the two architectures we compared (random forest and neural network) performed quite similarly. The neural network seemed to have an advantage on the MIMIC-III dataset, whereas the random forest performed better on most tasks on the eICU dataset. There is a considerable difference of the regression performance between the MIMIC-III test set and the independent eICU test set, especially with PaO2. This performance gap was probably caused by structural differences between the databases, their collection and the underlying treatments. This comprises effects like which items are included at all or at which frequency they are available in the dataset. In terms of content, it is safe to assume that recorded treatments from different hospitals followed different treatment policies, exacerbated by the fact that the recorded treatments in the eICU database are considerably more recent than those in the MIMIC-III database. Significant quantitative differences can be observed when comparing the extracted datasets from the MIMIC-III and eICU databases (Online Supplement Table 4). One notable distinction, which could potentially account for the decreased performance on the eICU database, is the presence of missing values. Specifically, the MIMIC-III dataset exhibits a 20% rate of missing values, whereas the eICU dataset experiences a higher rate of 30% missing values. Means and standard deviations also differ considerably between the datasets, e.g, with the mean compliance being 36% higher in the eICU dataset. We are confident that the real-world performance after fine-tuning with local data (of the hospital where the model will be applied) will be closer to the MIMIC-III test set performance. The subgroup analysis with patients with COPD shows that the presence of a very relevant comorbidity hardly affects the model performance.
When comparing the results of the all data and 30 min blinded setup, the differences in prediction error were surprisingly small. Discarding 30 min of measurements did not seem to increase the difficulty of the task to a relevant degree. This may be in part explained by the fact that all target variables tend to change slowly, leaving the last known value as a very good guess. Another reason might be the high variability of the measurement of the ground truth, which for PaO2 and PaCO2 is subject to numerous preanalytical and (allowable) analytical errors.26,27
Our analysis of feature importance showed that high importance was attributed to features that seem clinically reasonable for all target tasks. Specifically, most important features naturally included the last known measurement of the variable to be predicted and variables that are closely correlated. For PaO2 these included FiO2 and SpO2, for PaCO2 these were the set tidal volume and set respiratory rate as well as pH, and for Crs the set tidal volume and peak inspiratory pressure. For all target variables, the currently set ventilator mode occupied a top 10 position, showing that the model gathers valuable information from this categorial variable’s embeddings. The last known set PEEP occurred at positions 7, 26 and 7, respectively. Only the reason for the occurrence of the set respiratory rate for PaO2 and Crs and inspired oxygen fraction for PaCO2 are unclear. It is important to note that the presented permutation-based approach to determine feature importance should only be seen as a very rough peek under the model’s hood as it is ignorant of the complex interactions of multiple input variables because it considers every variable independently.28 All in all, these results can be seen as a reason to have confidence in the decision process of the proposed model. This kind of interpretability is of major importance for the acceptance of machine learning solutions by clinicians and the population in general. Similar to the simulation approach used in this work, it would also be possible to better understand the model’s decision for a single case by manipulating or obscuring individual input variables.
The understanding how this machine learning based tool could be used practically in clinical care can be derived from the simulation examples shown in Fig. 3. In the presented cases, one has an expected increase in PaO2 in response to an increased PEEP while the others do not. This kind of graphic representation might be useful for a clinician who is trying to optimise oxygenation or carbon dioxide elimination, especially in the short term. To our knowledge, this simple simulation procedure has not been done before in a mechanical ventilation setting.
LimitationsAs already mentioned above, the model succeeded to some degree to transfer knowledge from one US database to another. It could be even more challenging, however, to transfer to the situation in Europe, for example because pressure controlled ventilation is much more common there. Additionally, medical knowledge has a short half-time for example as patient demographics change or new treatment options arise. What has been accurate for the MIMICIII dataset recorded between 2001 and 2012 may be inaccurate today. This makes fine-tuning on recent local data even more important. One big problem we encountered, as one does in many machine learning applications, was the quality of the data. While the MIMIC-III database is often praised for its quality, these large databases still suffer from missing and corrupt data or incomplete documentation. This becomes especially evident when moving across different databases. Finally, due to the chosen approach in this work, it is not easily possible to include long-term clinical endpoints like mortality into the prediction because we used a fixed prediction horizon. For these endpoints the much more complicated reinforcement learning approach would be necessary.15,16
OutlookTo be able to use the developed model in Europe, we plan to continue training the model on data from local ICUs. A possible next step would be to include more ventilator settings into the simulation part, eventually making it possible to try out different ventilator modes, pressures and timings without subjecting the patient to unnecessary risks or discomfort. Taking this research a step further, once we have completed the clinical testing phase, we envision the potential for applying this method in closed-loop ventilation 29. This novel approach would allow the ventilator to adapt and respond to real-time predictions of blood gas analysis results, moving away from relying solely on pulse oximetry as a proxy measure for oxygenation. The relatively simple process and model design we applied to a ventilation problem here would also be suited for a wide range of applications outside of ventilation therapy, for example the prediction of drug concentrations, regulation of coagulation, fluid balance or circulation. For all these applications, clinicians currently rely mostly on experience or rules of thumb and would definitely benefit from a reliable and objective prediction.
ConclusionMachine learning for tabular data seems to be a useful approach for the clinically relevant problem of PEEP titration to individual patient needs. It delivers reliable results and comes with no extra cost once the digital infrastructure is in place. There is a large potential for this tabular approach for numerous other applications in the ICU.
Ethics approval and consent to participateNot applicable.
Consent for publicationNot applicable.
Availability of data and materialsThe datasets supporting the conclusions of this article are available in the physionet repository, (https://physionet.org/content/mimic, https://physionet.org/content/eicu-crd/).
Competing interestsThe authors declare that they have no competing interests.
FundingC.S.’s position was funded by the Medical Faculty of the Christian-Albrechts-University as part of an intramural research funding.
Authors’ contributionsAll authors participated in planning the study. C.S. wrote the used code and the main manuscript text. All authors reviewed the manuscript.
The following are Supplementary data to this article: