
To design a probability model for prolonged mechanical ventilation (PMV) using variables obtained during the first 24h of the start of MV.
DesignAn observational, prospective, multicenter cohort study.
ScopeThirteen Spanish medical-surgical intensive care units.
PatientsAdult patients requiring mechanical ventilation for more than 24h.
InterventionsNone.
Study variablesAPACHE II, SOFA, demographic data, clinical data, reason for mechanical ventilation, comorbidity, and functional condition. A multivariate risk model was constructed. The model contemplated a dependent variable with three possible conditions: 1. Early mortality; 2. Early extubation; and 3. PMV.
ResultsOf the 1661 included patients, 67.9% (n=1127) were men. Age: 62.1±16.2years. APACHE II: 20.3±7.5. Total SOFA: 8.4±3.5. The APACHE II and SOFA scores were higher in patients ventilated for 7 or more days (p=0.04 and p=0.0001, respectively). Noninvasive ventilation failure was related to PMV (p=0.005). A multivariate model for the three above exposed outcomes was generated. The overall accuracy of the model in the training and validation sample was 0.763 (95%IC: 0.729–0.804) and 0.751 (95%IC: 0.672–0.816), respectively. The likelihood ratios (LRs) for early extubation, involving a cutoff point of 0.65, in the training sample were LR (+): 2.37 (95%CI: 1.77–3.19) and LR (−): 0.47 (95%CI: 0.41–0.55). The LRs for the early mortality model, for a cutoff point of 0.73, in the training sample, were LR (+): 2.64 (95%CI: 2.01–3.4) and LR (−): 0.39 (95%CI: 0.30–0.51).
ConclusionsThe proposed model could be a helpful tool in decision making. However, because of its moderate accuracy, it should be considered as a first approach, and the results should be corroborated by further studies involving larger samples and the use of standardized criteria.
Diseñar un modelo de probabilidad de ventilación mecánica prolongada (VMP) con variables clínicas obtenidas durante las primeras 24 horas de su instauración.
DiseñoEstudio de cohorte, observacional, prospectivo, multicéntrico.
ÁmbitoTrece UCI españolas polivalentes.
PacientesAdultos ventilados durante más de 24 horas.
IntervencionesNinguna.
Variables de interésAPACHE II, SOFA, variables clínicas y demográficas, motivo de VM, comorbilidad y estado funcional. Se construyó un modelo de riesgo multivariante en el que la variable dependiente tenía tres posibles estados: 1.- Muerte precoz. 2.- Retirada precoz de la VM. 3.- VMP.
ResultadosSe incluyeron 1.661 pacientes. El 67,9% (n=1.127) fueron hombres. Edad: 62,1±16,2 años. APACHE II: 20,3±7,5. SOFA: 8,4±3,5. Las puntuaciones APACHE II y SOFA fueron mayores en pacientes ventilados ≥ 7 días (p=0,04 y p=0,0001 respectivamente). El fracaso de la ventilación no invasiva (VNI) se asoció a VMP (p=0,005). Se generó un modelo de riesgo multivariante con las siguientes variables: APACHE II, SOFA, fracaso de VNI, ubicación hospitalaria antes del ingreso en UCI y motivo de ventilación mecánica. La exactitud del modelo global fue de: 0,763 (95% IC: 0,729-0,804) para la muestra de diseño y 0,751 (95% IC: 0,672-0,816) para la muestra de validación. Las razones de verosimilitud (likelihood ratio–LR-) en el modelo de extubación precoz para un punto de corte de 0,65 en la muestra de diseño fueron LR (+): 2,37 (IC 95% 1,77-3,19); LR (−): 0,47 (IC 95%: 0,41-0,55). En el modelo exitus y para un punto de corte de 0,73 en la muestra de diseño fueron LR (+): 2,64 (IC 95%: 2,01-3,4); LR (−): 0,39 (IC 95%: 0,30-0,51).
ConclusionesEl modelo propuesto podría constituir una herramienta de ayuda para la toma de decisiones clínicas aunque debido a la moderada exactitud del mismo se debe considerar como una primera aproximación y los resultados deberán ser corroborados en estudios futuros con muestras más amplias y criterios de estandarización.
Approximately 40% of all patients admitted to the Intensive Care Unit (ICU) require mechanical ventilation. Many of them are extubated between 2 and 4days after the start of ventilation, but up to 25% require mechanical ventilation for more than 7days.1 Considerable variability is found in the international literature regarding the definition of prolonged mechanical ventilation, and the existing definitions are conditioned by the settings in which they are used. While some organizations such as Medicare or Medicaid describe prolonged mechanical ventilation as ventilation for more than 21days during at least 6h/day,2 the cutoff points in clinical studies have been shorter, comprising ventilation for more than 483 or 96h.4
The possibility of predicting the duration of mechanical ventilation could prove useful in adopting certain clinical decisions. Few analyses have examined this aspect, and the existing studies have important limitations (retrospective design, the use of small samples, or studies centered on a single type of disease process).5–12
The present study describes a probability model of prolonged mechanical ventilation using clinical variables obtained during the first 24h of invasive mechanical ventilation in a large sample of critical patients from centers with different healthcare levels.
Materials and methodsDesignA prospective, multicenter, observational cohort study with the participation of 13 polyvalent ICUs was carried out. The Clinical Research Ethics Committee (CREC) of the coordinating center (Cuenca Health Area CREC #10/09) approved the study and exempted it from the need to obtain informed consent, in view of the anonymous and observational nature of the survey. Such approval in turn was extended to the rest of the participating institutions.
SampleBetween 1 June 2006 and 31 May 2008, we included all adults admitted to any of the participating ICUs and who required invasive mechanical ventilation for more than 24h. The exclusion criteria were: patients under 18years of age; limitation of therapeutic effort considerations prior to inclusion; patients participating in some other study involving some intervention capable of influencing the results obtained; and critical burn patients.
VariablesProlonged mechanical ventilation was defined as the need for invasive mechanical ventilation for 7 or more days. A patient was considered to be free from ventilation when remaining under spontaneous ventilation for more than 48h after extubation. Those patients requiring reintubation during the first 48h were not regarded as being free of invasive ventilatory support. In turn, those requiring reintubation more than 48h after extubation were defined as “late reintubation” cases. All the patients were followed-up on until death or hospital discharge.
During the first 24h of invasive mechanical ventilation we documented the following variables: the Acute Physiology and Chronic Health Evaluation II (APACHE II) score, Sequential Organ Failure Assessment (SOFA) score, age, gender, localization prior to admission to the ICU (Emergency Department, clinical ward, surgical ward, operating room, intermediate care unit awakening/resuscitation room, other hospital), failure of noninvasive ventilation (NIV) prior to endotracheal intubation, comorbidity as established by the Charlson comorbidity index,13 functional capacity according to the Barthel index,14 duration of stay in hospital prior to admission to the ICU, the need for vasoactive drugs before admission to the ICU, and the reason for mechanical ventilation according to the International Study Group mechanical ventilation classification15,16: 1. – Acute respiratory failure: 1.a. – Postoperative: patients requiring continued mechanical ventilation after surgery due to risk derived from underlying disease, age, or high risk surgery; 1.b. – Pneumonia: defined by the development of new alveolar infiltration or worsening of previous alveolar infiltration, accompanied by fever/hypothermia and leukocytosis/leukopenia; 1.c. – Heart failure: patients with dyspnea, bilateral alveolar infiltration, hypoxemia and evidence of heart disease or patients with cardiogenic shock; 1.d. – Acute lung injury/acute respiratory distress syndrome (ALI/ARDS): according to the criteria of the American-European Consensus Conference.17 1.e. – Sepsis: according to the criteria of the consensus conference of the American College of Chest Physicians/Society of Critical Care Medicine18; 1.f. – Trauma: mechanical ventilation due to polytraumatism; 1.g. – Cardiac arrest: mechanical ventilation due to sudden and unexpected cardiopulmonary arrest. 2. – Coma: patients requiring mechanical ventilation due to worsened consciousness secondary to organic (cerebrovascular stroke, meningoencephalitis, head injuries) or toxic-metabolic causes. 3. – Exacerbated chronic respiratory failure: patients with basal chronic disease requiring mechanical ventilation (exacerbated chronic obstructive pulmonary disease (COPD), asthma, chronic respiratory disease other than COPD). 4. – Neuromuscular disease: patients with respiratory failure due to alterations of the peripheral nervous system, neuromuscular junction or myopathy. 5. – Other causes: mechanical ventilation due to other causes.
Statistical analysisDescription of resultsThe results referred to quantitative variables were reported as the mean and standard deviation (SD) in the case of variables with a normal distribution, as determined by the Kolmogorov–Smirnov test. Variables with a non-normal distribution were expressed as the median and range. In turn, qualitative data were expressed as absolute values (n) and percentages.
Univariate analysisA univariate analysis was performed to compare the variables between the patients ventilated for <7days and those ventilated for ≥7days. The Student t-test was used to explore differences between means. In turn, the Mann–Whitney U-test was applied to those variables with a non-normal distribution, while the chi-squared test was used for evaluating differences between qualitative variables.
Multivariate analysisA multivariate risk model was developed in order to identify variables capable of differentiating between patients with a high probability of requiring prolonged mechanical ventilation (≥7days) and those with a high probability of early extubation (<7days) or of death before day 7 of mechanical ventilation. As response we considered an outcome variable with three categories corresponding to the three possible conditions to be taken into account:
- 1.
Early mortality (fatal outcome before day 7 of mechanical ventilation).
- 2.
Early extubation (extubation before day 7 of mechanical ventilation).
- 3.
Prolonged mechanical ventilation (mechanical ventilation for 7 or more days).
As reference category we used prolonged mechanical ventilation, and estimated the coefficients for each of the two models obtained, as well as the predicted probabilities of each condition. The model excluded those variables which the Wald statistic did not consider to make a significant contribution to the feasibility of the multivariate model.
The global sample was divided into two sub-samples on a randomized basis: a training or design subsample and a validation subsample. The former was used to develop the model, and an evaluation was made of its discriminating capacity in the validation subsample.
The parameters of the multivariate model were estimated based on multinomial logistic regression analysis, within the context of the generalized linear models. The generalized logit function was used as the linking function.
The discriminating capacity of the model was analyzed following the methodology of Obuchowski et al.,19 for the case in which the response has multiples conditions, consisting of an extension of the Wilcoxon–Mann–Whitney estimator of the area under the receiver operating characteristic (ROC) curve. The estimators were obtained by pairs (death vs early extubation; death vs prolonged mechanical ventilation; extubation vs prolonged mechanical ventilation) among the three conditions to estimate the discriminating capacity between conditions–the global discriminating capacity being regarded as the weighted mean of the partial indices. Weighting was based on the relative prevalences of each condition in the sample, and we studied two functions referred to error penalization in distinguishing between two conditions: firstly, maximum penalization due to classification error between any of the conditions, and secondly no penalization of erroneous distinction for death versus early extubation and maximum penalization due to erroneous distinction between death versus prolonged mechanical ventilation and early extubation versus prolonged mechanical ventilation.
Calculation of the probability corresponding to each of the three conditions was based on the following equations:
- •
Prob (early mortality/X1)=exp(α1+(Σβ1×X1))/1+[exp(α1+(Σβ1×X1))+exp(α2+(Σβ2×X2))].
- •
Prob (early extubation/X1)=exp(α2+(Σβ2×X2))/1+[exp(α1+(Σβ1×X1))+exp(α2+(Σβ2×X2))]
- •
Prob (prolonged mechanical ventilation/X1)=1/1+[exp(α1+(Σβ1×X1))+exp(α2+(Σβ2×X2))]
The statistical analysis was carried out using the SAS statistical package (SAS Institute, release 9.1), with the nonbinROC application of the language program R version 2.9.1 (2009-06-26) (Copyright (C) 2009. The R Foundation for Statistical Computing, ISBN 3-900051-07-0).
ResultsDescriptionOf the 13 participating centers, four were university hospitals and 12 were qualified for postgraduate (resident) training in Intensive Care Medicine. The mean number of beds per participating hospital was 625 (range (r)=250–1450), while the mean number of beds per ICU was 15 (r=8–44). A total of 1661 patients were included. Of these, 58.3% (n=969) received prolonged mechanical ventilation during 20.5±16.8days. In turn, 31.1% (n=517) were extubated before day 7, with a mean duration of mechanical ventilation of 3.4±1.3days. A total of 10.5% (n=175) died before day 7 in the ICU, with a duration of mechanical ventilation of 3.5±1.4days. The rest of the demographic and clinical characteristics are shown in Table 1. The main indications of mechanical ventilation were acute respiratory failure (68.8%, n=1144), coma (17.6%, n=294), exacerbated chronic respiratory failure (7.7%, n=129), neuromuscular disease (1.1%, n=19), and other causes (4.8%, n=75) (Table 2).
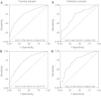
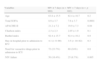
Demographic and clinical characteristics of the global study sample.
| Age | 62.1±16.2a |
| Males | 1.127 (67.9)b |
| APACHE II | 20.3±7.5a |
| Total SOFA | 8.4±3.5a |
| Stay in hospital prior to admission to ICU | 1 (0–89)c |
| Reason for admission to ICU | |
| Clinical | 1.055 (63.5)b |
| Surgical | 432 (26)b |
| Trauma | 143 (6.8)b |
| Acute coronary syndrome | 31 (1.9)b |
| Localization before admission to ICU | |
| Clinical ward | 351 (21.1)b |
| Surgical ward | 146 (8.8)b |
| Emergency area | 725 (43.6)b |
| Intermediate care unit/postanesthesia recovery room | 58 (3.5)b |
| Operating room | 245 (14.8)b |
| Other hospital | 120 (7.2)b |
| Other area | 16 (1)b |
| Barthel index | 92.6±14.7a |
| Charlson index | |
| or 0–3 | 1.359 (81.9)b |
| or 4–8 | 268 (16.1)b |
| or 9–12 | 34 (2)b |
| Vasoactive drugs before admission to ICU | 396 (23.8)b |
| NIV failure before endotracheal intubation | 202 (12.2)b |
| Duration of NIV before endotracheal intubation (h) | 12 (1–126)c |
| Early reintubation (≤48h) | 144 (8.7)b |
| Late reintubation (>48h) | 70 (4.2)b |
| Mortality in ICU | 463 (27.9)b |
| Mortality in hospital | 571 (34.4)b |
| Prolonged mechanical ventilation | 969 (58.3)b |
| Early extubation | 517 (31.1)b |
| Early mortality | 175 (10.5)b |
NIV: noninvasive ventilation.
Mean±standard deviation.
n (%).
Median and range.
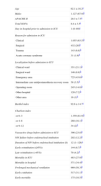
Indications of mechanical ventilation.
| Number (%) of ventilated patients | |
| Acute respiratory failure | 1.144 (68.8) |
| Cause | |
| Postoperative | 326 (19.6) |
| Pneumonia | 224 (13.4) |
| Heart failure | 118 (7.1) |
| Sepsis | 106 (6.4) |
| ALI/ARDS | 144 (8.7) |
| Trauma | 78 (4.7) |
| Cardiac arrest | 148 (8.9) |
| Coma | 294 (17.6) |
| Cause | |
| Metabolic/intoxication | 86 (5.1) |
| Cerebrovascular stroke | 122 (7.3) |
| Meningoencephalitis | 28 (1.7) |
| Head injury | 58 (3.5) |
| Exacerbated chronic respiratory failure | 129 (7.7) |
| Cause | |
| COPD | 111 (6.7) |
| Asthma | 12 (0.7) |
| Chronic respiratory failure (not COPD) | 6 (0.3) |
| Neuromuscular disease | 19 (1.1) |
| Others | 75 (4.8) |
COPD: chronic obstructive pulmonary disease; ALI/ARDS: acute lung injury/acute respiratory distress syndrome.
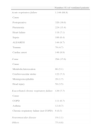
The total APACHE II and SOFA scores were higher among the patients subjected to prolonged ventilation than in those on mechanical ventilation for less than 7days (p=0.04 and p=0.0001, respectively). Noninvasive ventilation failure was associated to prolonged mechanical ventilation (p=0.005) (Table 3).
Differences between patients subjected to prolonged mechanical ventilation and patients ventilated for less than 7days.
| Variables | MV≥7days (n=969) | MV<7days (n=692) | p |
| Age | 63.8±15.5 | 62.4±16.7 | 0.2 |
| Total SOFA | 8.9±3.7 | 7.6±3.7 | 0.0001 |
| APACHE II | 21.2±7.2 | 19.9±7.3 | 0.04 |
| Charlson index | 2.3±2.3 | 2.05±1.9 | 0.1 |
| Barthel index | 92.4±15.7 | 92.4±16.2 | 0.9 |
| Stay in hospital prior to admission to ICU | 4.1 (r: 0–90) | 3.5 (r: 10–62) | 0.3 |
| Need for vasoactive drugs prior to admission to ICU | 72 (23.7%) | 69 (24%) | 0.9 |
| NIV failure | 50 (16.4%) | 25 (8.7%) | 0.005 |
NIV: noninvasive ventilation.
A total of 1289 patients (77.6%) were assigned to the training sample and 372 (22.4%) to the validation sample. A multivariate model was generated with the following variables: APACHE II, SOFA, NIV failure, hospital localization before admission to the ICU (intermediate care unit, anesthetic awakening/resuscitation room), reason for mechanical ventilation: ALI/ARDS, heart failure, pneumonia, sepsis, polytraumatism, cardiac arrest, metabolic coma, intoxication coma, cerebrovascular stroke, head injury, neuromuscular disease, and other indications of mechanical ventilation. The model with its coefficients and significance is shown in Table 4.
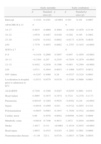
Coefficients and significance of each variable for the early mortality and early extubation models.
| Early mortality | Early extubation | |||||
| β | Standard error (β) | p | β | Standard error (β) | p | |
| Intercept | −3.2344 | 0.4381 | <0.0001 | 0.543 | 0.161 | 0.0007 |
| APACHE II≤13 | 0 | 0 | ||||
| 14–17 | 0.4835 | 0.4669 | 0.3004 | −0.1892 | 0.1878 | 0.3138 |
| 18–22 | 1.0539 | 0.4487 | 0.0188 | −0.202 | 0.195 | 0.3002 |
| 23–29 | 1.6258 | 0.4342 | 0.0002 | −0.6173 | 0.2076 | 0.0029 |
| ≥30 | 1.7379 | 0.4655 | 0.0002 | −1.2707 | 0.3103 | <0.0001 |
| SOFA≤7 | 0 | 0 | ||||
| 8–9 | −0.1438 | 0.2666 | 0.5897 | −0.697 | 0.1659 | <0.0001 |
| 10–11 | −0.3384 | 0.297 | 0.2545 | −0.7854 | 0.1879 | <0.0001 |
| 12–15 | 0.4162 | 0.2938 | 0.1566 | −0.983 | 0.2364 | <0.0001 |
| ≥16 | 1.0711 | 0.3844 | 0.0053 | −3.1008 | 0.9575 | 0.0012 |
| NIV failure | −0.3247 | 0.3069 | 0.29 | −0.5527 | 0.2124 | 0.0093 |
| Localization in hospital prior to admission to ICU | −2.0331 | 0.9579 | 0.0338 | −2.1506 | 0.5666 | 0.0001 |
| ALI/ARDS | 0.7194 | 0.3288 | 0.0287 | −0.6295 | 0.2661 | 0.018 |
| Heart failure | 0.4995 | 0.3875 | 0.1974 | 0.3724 | 0.2378 | 0.1173 |
| Pneumonia | 0.00345 | 0.3264 | 0.9916 | −0.8582 | 0.216 | <0.0001 |
| Sepsis | −0.8916 | 0.4569 | 0.051 | −0.4722 | 0.2955 | 0.1101 |
| Polytraumatism | −0.9055 | 0.6983 | 0.1947 | −1.7036 | 0.3532 | <0.0001 |
| Cardiac arrest | 0.88 | 0.3076 | 0.0042 | 0.00588 | 0.2441 | 0.9808 |
| Metabolic coma | −0.6018 | 0.7198 | 0.4031 | 1.2472 | 0.2916 | <0.0001 |
| Stroke | 1.4417 | 0.311 | <0.0001 | −1.4519 | 0.2935 | <0.0001 |
| Head injury | 1.0655 | 0.4515 | 0.0183 | −1.2882 | 0.3891 | 0.0009 |
| Neuromuscular disease | −11.49 | 323.1 | 0.9716 | −2.0033 | 0.7206 | 0.0054 |
ALI/ARDS: acute lung injury/acute respiratory distress syndrome; NIV: noninvasive ventilation.
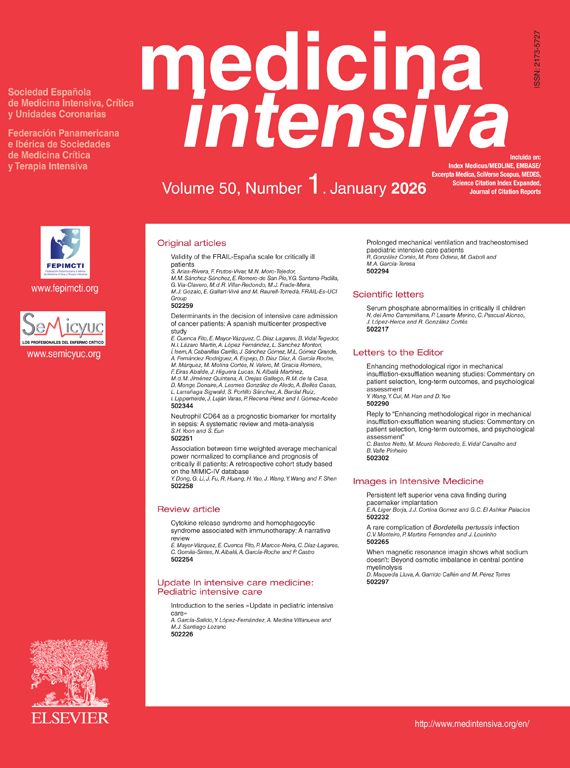
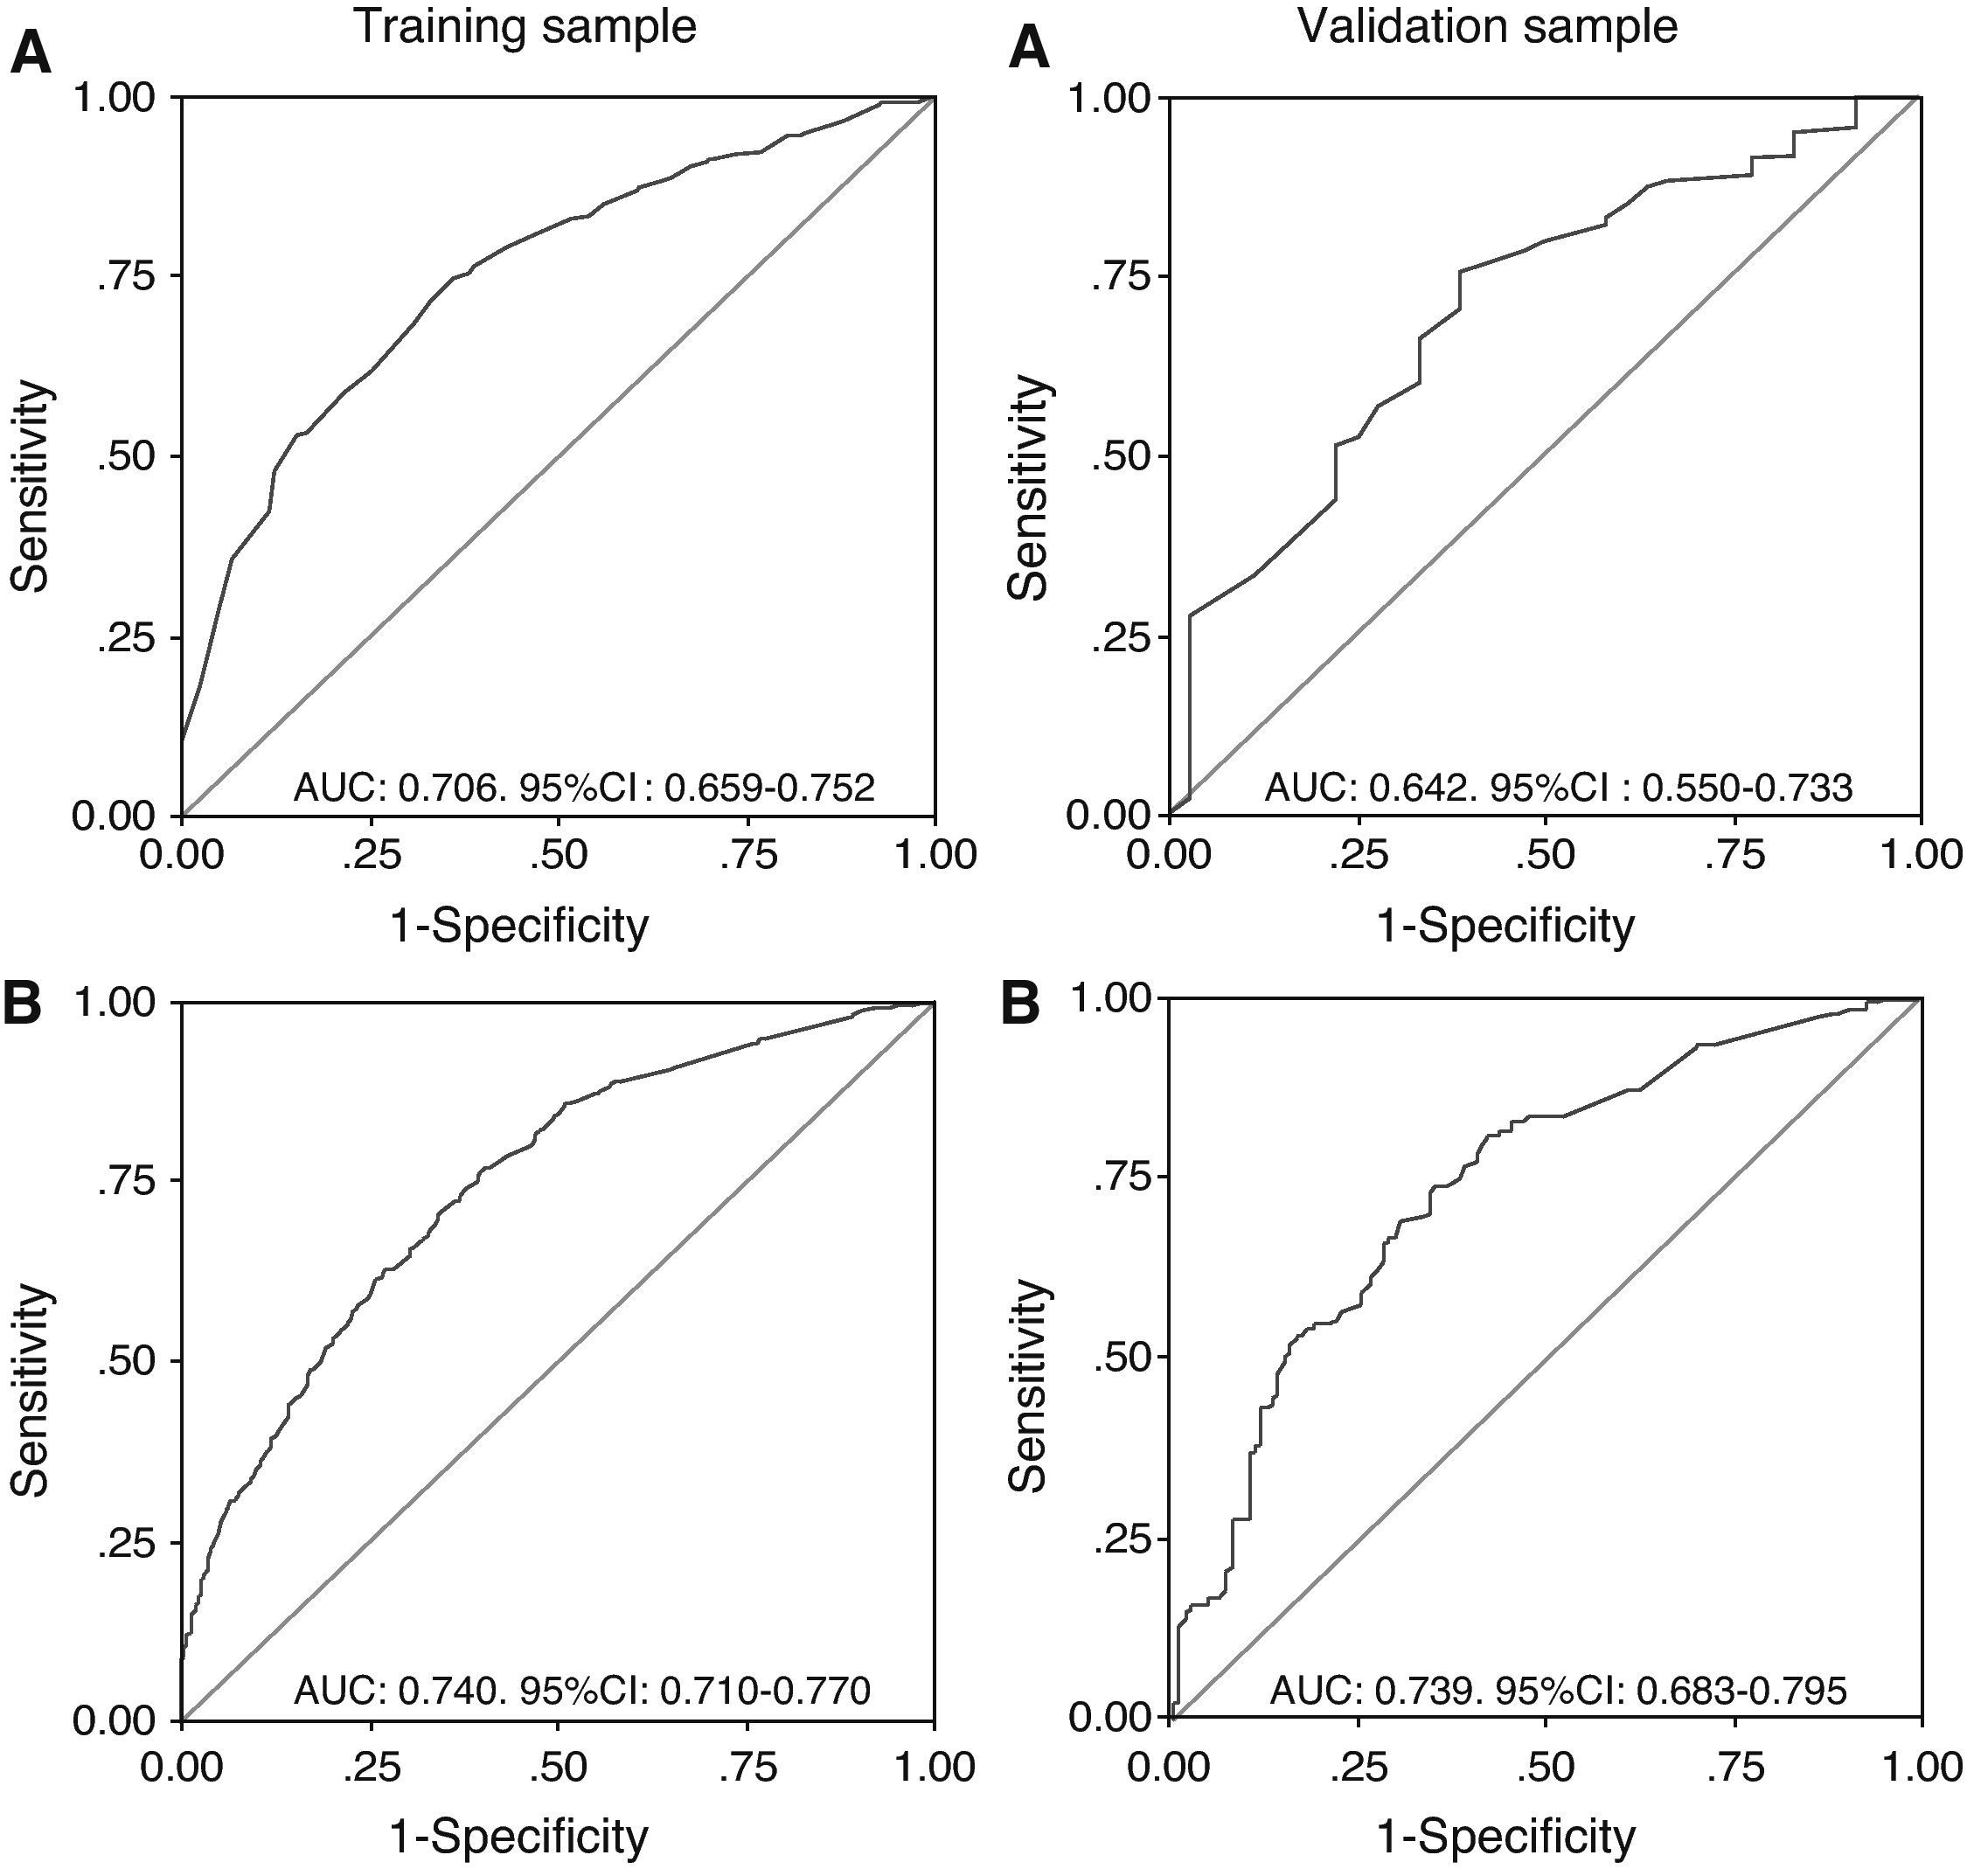
The discriminating capacity of the model is expressed in Table 5, which shows the areas under the curve of the predictive probabilities of one condition versus another, in each of the two samples (training and validation), together with the global precision. Fig. 1 in turn presents the ROC curves, showing: probability 1 (early mortality vs prolonged mechanical ventilation) and probability 2 (early withdrawal vs prolonged mechanical ventilation) of the training and validation samples.
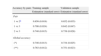
Accuracy levels by pairs and global accuracy in the training and validation samples.
| Accuracy by pairs | Training sample | Validation sample |
| Estimation (standard error) | Estimation (standard error) | |
| Pair | ||
| 1 vs 2a | 0.856 (0.018) | 0.852 (0.035) |
| 1 vs 3 | 0.706 (0.024) | 0.642 (0.047) |
| 2 vs 3 | 0.740 (0.015) | 0.739 (0.028) |
| Global accuracy | ||
| (*) | 0.746 (0.013) | 0.734 (0.025) |
| (**) | 0.763 (0.012) | 0.751 (0.023) |
Weights based on the relative prevalences of each condition in the sample. (*) Penalization function L(1,2)=1, L(1,3)=1, L(2–3)=1 or (**) penalization function according to the relative severity of distinction L(1,2)=0. L(1,3)=1, L(2–3)=1.
1: Early mortality model, 2: Early extubation model, 3: Prolonged mechanical ventilation model.
The likelihood ratios (LRs) referred to the optimum cutoff points were as follows in the early extubation model: LR (+): 2.37 (95%CI 1.77–3.19), LR (−): 0.47 (95%CI: 0.41–0.55) for a cutoff point of 0.65 in the training sample; and: LR (+): 2.2 (95%CI 1.7–2.8), LR (−): 0.41 (95%CI: 0.31–0.55) for a cutoff point of 0.71 in the validation sample.
In turn, LRs referred to the optimum cutoff points were as follows in the early mortality model: LR (+): 2.64 (95%CI: 2.01–3.4), LR (−): 0.39 (95%CI: 0.30–0.51) for a cutoff point of 0.73 in the training sample; and: LR (+): 3.02 (95%CI: 2.15–4.22); LR (−): 0.48 (95%CI: 0.32–0.73) for a cutoff point of 0.61 in the validation sample.
In order to facilitate the calculation of each probability, a spreadsheet was developed for computation of the probabilities of each condition. This tool (.xls) is shown in Appendix A.
DiscussionThe present study involved the development of a probabilistic model of prolonged mechanical ventilation in a large and heterogeneous sample of ventilated patients with clinical variables that are simple to obtain in the first 24h of mechanical ventilation, with the purpose of offering a clinical decision making tool. We excluded critical burn patients, since in such cases we would have had to include specific variables not applicable to the rest of the patients, such as burn surface area and inhalation syndrome.
Considering that the main objective of our study was to develop a model of help in clinical decision making–fundamentally the timing of tracheotomy in a ventilated patient–we established a cutoff point of 7days in defining prolonged mechanical ventilation, since this duration appears reasonable for considering performance of the technique, and because we regard it as the time limit for the appearance of possible laryngeal damage secondary to endotracheal intubation.20 We therefore considered that an early applicable model capable of predicting the probability of remaining on mechanical ventilation for 7 or more days could be useful for selecting those patients amenable to early tracheotomy–in turn reducing clinician concerns about performing the technique in patients who actually might not need a tracheostomy.
Perhaps the most important study referred to the prediction of prolonged mechanical ventilation has been that published by Seneff et al.,5 who retrospectively selected 5915 clinical-surgical patients from the APACHE III database of 40 hospitals in the United States. The authors found the variables influencing the duration of mechanical ventilation to be the reason or indication of admission to the ICU, the Acute Physiology Score (APS), the day of admission, patient age, a history of severe or moderate functional limitation due to respiratory disease, the presence of obstructive or restrictive pulmonary disease, the hospital localization of the patient, and the duration of stay in hospital before admission to the ICU. Some of the variables of our model coincide with those identified by Seneff et al.5 However, comorbidity and functional condition were not found to have predictive capacity in our analysis. In order to evaluate these variables, we used two validated scales which can be used to quantify the results. The fact that none exhibited predictive capacity could be explained by the increasingly stricter selection of patients when it comes to consideration of admission to the ICU.
While other authors11 have attempted to identify risk factors in a combined model of mortality and/or prolonged mechanical ventilation, we preferred to include a dependent variable with three possible conditions, on the grounds that the condition of interest (i.e., prolonged mechanical ventilation) is an intermediate condition between the other two. Failure to do so would have caused the patients who died before day 7 of ventilation to be included among those classified as corresponding to early extubation despite the fatal outcome–as a result of which this model may be more realistic than other models reflecting aggregated results.
In our final model, the variables “exacerbation of COPD” and “postoperative period” as reasons for mechanical ventilation had no intrinsic weight of their own. As with other variables, the coefficients for COPD and postoperative period were not significant with the Wald statistic. For these indications of ventilation, discrimination among the three possible conditions is explained by the variables APACHE, SOFA, hospital localization before admission to the ICU, and NIV failure. In other words, these two indications of mechanical ventilation do not add accuracy or goodness of fit to the model, and therefore, when included, they should be assigned to the category “others”.
It is interesting to note that the variable “noninvasive ventilation failure” reduces the probability of mortality but increases the probability of prolonged mechanical ventilation. It must be taken into account that because of the observational nature of the study, NIV was applied in non-selected patients, and with a mean duration of NIV before endotracheal intubation of 12h (r=1–216). Therefore, its application to patients with heterogeneous diseases, and prolonged application prior to endotracheal intubation, could result in high failure rates and to an excessive delay in intubation–with the consequent prolongation of invasive mechanical ventilation.
Although a limitation of the study has been the lack of standardization of certain procedures among Units (different ventilatory practices, lack of standardization in applying NIV, different weaning practices, different sedation protocols, etc.), the most important limitation has been the moderate accuracy of the model, which might have been improved by a larger sample. The LRs obtained in reference to the optimum cutoff points for the model of early extubation and mortality offer values that are insufficient for a clinical predictive rule–though they could be adequate for stratification in epidemiological studies of high or low probability of prolonged mechanical ventilation.21
In sum, the limitations of the study imply that the results cannot be generalized, and that the model is not applicable to clinical practice for follow-up evaluative purposes. Our work therefore constitutes a first approach or first analysis requiring further expansion in a larger second study, attempting to standardize therapeutic measures with a view to minimizing variability in clinical practice and offering a more solid construct or model.
Conflict of interestThe authors declare no conflict of interest.
The following is the supplementary data to this article:

Please cite this article as: Añón JM, et al. Modelo de probabilidad de ventilación mecánica prolongada. Med Intensiva. 2012;36:488–95.