


To determine whether the alveolar-arterial oxygen gradient (Grad[A-a]O2) helps confirm the influence of PEEP on PaFi (PaO2/FiO2).
DesignObservational study; we used linear regression to perform a multivariate study to improve the PaFi formula by taking PEEP into account.
SettingTertiary hospital.
PatientsWe included all patients who were admitted to the intensive care unit, regardless of pulmonary damage.
VariablesWe recorded personal history, clinical judgment, intensive care data, severity scores on the first day and progression. Two calculated variables: PaFi and Grad(A-a)O2.
ResultsA total of 956 patients were included: 63.9% men; median age 68 years. On the first day, 31.8% did not have mechanical ventilation (MV), 13.1% had non-invasive MV and 55.1% had invasive MV. PaFi values: 32.9% 0–200, 32.2% 201–300, and 34.8% >300. PEEP values: 0–5, 69.8%; 6–10, 27.5%; and >10, 2.6%. We observed a correlation (Pearson) between Grad(A-a)O2 and PaFi of −0.84 (p<0.001). On performing multiple regression (dependent variable: Grad[A-a]O2), the following variables were included in the model: PaFi, PEEP, APACHE IV and SOFA; coefficient of determination (R2) of 0.62 without PEEP and 0.72 with PEEP. We changed the PaFi formula, referring to it as PaFip (PaFi plus PEEP): Ln (PaFi/[PEEP+12]). Correlation index between PaFip and Grad(A-a)O2: −0.9 (p<0.001). We performed linear regression (dependent variable: Grad[A-a]O2) and used PaFip instead of PaFi. Only PaFi remained in the model, and was discretely complemented by APACHE IV; R2=0.8.
ConclusionsBy adding PEEP to the PaFi model (PaFip), we clearly improve the latter, as reflected by a better goodness of fit.
Valorar si el gradiente alveolo-arterial de oxígeno (Grad[A-a]O2) ayuda a confirmar la influencia de la PEEP en la PaFi (PaO2/FiO2).
DiseñoEstudio observacional; usamos una regresión lineal para realizar un estudio multivariable y mejorar la fórmula de la PaFi teniendo en cuenta la PEEP.
ÁmbitoHospital terciario.
PacientesTodos los pacientes de cuidados intensivos, con o sin daño pulmonar.
Variables de interés principalRegistramos los antecedentes personales, juicio clínico, datos durante ingreso en UCI, puntuaciones de severidad en el primer día y durante evolución; dos variables calculadas: PaFi and Grad(A-a)O2.
ResultadosUn total de 956 patientes incluidos; 63,9% hombres; edad mediana 68 años. Primer día, 31,8% no tienen ventilación mecánica (VM), 13,1% tienen VM no invasiva y 55,1% VM invasiva. PaFi: 32,9% 0–200, 32,2% 201–300, y 34,8% >300. PEEP: 0–5 69,8%, 6–10 27,5% y >10 2,6%. Observamos una correlación (Pearson) entre el Grad(A-a)O2 y la PaFi de −0,84 (p<0,001). Realizamos una regresión múltiple (variable dependiente: Grad(A-a)O2Grad[A-a]O2); variables incluidas en el modelo: PaFi, PEEP, APACHE IV y SOFA; coeficiente de determinación (R2) de 0,62 sin PEEP y 0,72 con PEEP. Cambiamos la fórmula de la PaFi, denominándola PaFip (PaFi más PEEP): Ln (PaFi/[PEEP+12]). El índice de correlación entre PaFip y Grad(A-a)O2: −0,9 (p<0,001). Realizamos una regresión lineal (variable dependiente: Grad[A-a]O2) y utilizamos PaFip en vez de la PaFi. Solo la PaFi permanece en el modelo, y es discretamente complementada por APACHE IV; R2 0,8.
ConclusionesAñadiendo la PEEP a la PaFi, creamos una variable (PaFip) que mejora el modelo, demostrando mayor capacidad de bondad de ajuste.
Following the introduction of the concepts of acute lung injury (ALI) and acute respiratory distress syndrome (ARDS) on occasion of the consensus conference of 1994, the term PaFi (PaO2/FiO2) has become universally adopted as a way to quantify the intensity of lung injury in the critical patient.1 PaFi homogenizes independently of the use of mechanical ventilation or not, and of whether positive end-expiratory pressure (PEEP) is employed or not. However, when working in the clinical setting with critical patients subjected to mechanical ventilation, we see that PaFi often might not reflect the intensity of lung injury. In this context, a PaO2 value of 80 with a FiO2 value of 0.5 would yield a PaFi of 160, but it would appear to be the same to have a PEEP of 5, 10 or 15.
The alveolo-arterial oxygen gradient (Grad[A-a]O2) is a simple way to measure alterations between the alveolus and capillary, and has recently been used in the study of different critical disorders (chronic obstructive pulmonary disease (COPD), pulmonary thromboembolism, etc.).2–4
The present study examines whether the use of Grad(A-a)O2 can help us to confirm the influence of PEEP upon PaFi and contribute to improve the PaFi formula if PEEP is taken into account.
Material and methodOver a period of two years (2008 and 2009) the study included all patients admitted to the Intensive Care Unit (ICU), with or without lung injury. The ICU in which the study was carried out is an adult Unit pertaining to Virgen de la Salud Hospital in Toledo (Spain). This ICU has 23 critical care beds and three beds for postoperative care involving special risks or requiring special monitorization during the first hours (e.g., uncomplicated brain tumor surgery and other neurosurgical, maxillofacial, vascular, ear, nose and throat operations, etc.).
Demographic data were collected (year of admission, gender, age), along with the patient history (smoking, obesity, chronic bronchitis, COPD, asthma, restrictive respiratory failure, tracheostomy, home ventilation), clinical judgment, baseline condition, diagnostic group (clinical, surgical), type of deterioration prior to admission to the ICU, origin, and data and scores in the ICU during the first day (orotracheal intubation, type of mechanical ventilation on the first day, chest X-rays, PaO2, FiO2, PEEP, APACHE II, APACHE IV, SOFA, SAPS II and SAPS III).
In the patients subjected to mechanical ventilation, we waited for the physician in charge of patient care to establish the best recruitment parameters, which were then recorded. In all patients we documented blood gases during the first day of admission, once the patient had been hemodynamically stable for several hours (with or without drugs) and with stable breathing (no variations in saturation or systemic blood pressure in the last two hours). PaO2, FiO2 and PEEP were recorded. These variables in turn yielded two parameters: PaFi (PaO2/FiO2) and Grad(A-a)O2, calculated from the following formula5:
Statistical analysis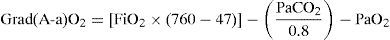
The categorical variables were expressed as frequencies and percentages, while quantitative variables were reported as the mean±standard deviation (SD). Where appropriate, the median (interval) was calculated. The comparison of categorical variables was based on the chi-squared test. Where pertinent, the quantitative variables (Grad[A-a]O2, PaFi, PEEP, etc.) were coded in the form of intervals and regarded as categorical variables. Analysis of the relationship between categorical and quantitative variables was carried out using the Student's t-test (in the case of two variables) or analysis of variance (ANOVA) (in the case of more than two variables).
On examining the correlation between two quantitative variables, use was made of the Pearson correlation coefficient. Dispersion plots were also used, fitting the line that best explained the observed relationship. Multivariate linear regression analysis was employed when the dependent variable was of a quantitative nature (PaFi, Grad[A-a]O2). The multivariate analysis incorporated those variables found to be significant in the bivariate analysis, and all those variables considered to be of interest in view of their importance (gender, age, PEEP, type of mechanical ventilation). Statistical significance was considered for p<0.05.
ResultsA total of 956 patients were included in the study: 63.9% were males, and the median age was 68 years (range 15–91 years). The median score values were: APACHE II 17; APACHE IV 58; SAPS II 43; SAPS III 63 and SOFA 7. A total of 33.6% of the subjects were surgical patients; 36.9% came from the hospitalization ward and 32.5% from the Emergency Department.
The most frequent reasons for admission to the ICU were congestive heart failure (9.8%), community-acquired pneumonia (8.9%), secondary peritonitis (6.3%), urological sepsis (5.5%), cardiorespiratory arrest (5.4%), cardiogenic shock (4.8%), nosocomial pneumonia (4.5%), exacerbated COPD (3.5%), postoperative hemorrhagic shock (3.2%), acute pancreatitis (3.1%), soft parts infectious disease (2.6%) and sepsis of unknown origin (2.5%).
A total of 64.5% of the patients were intubated. On the first day, 31.8% were not subjected to mechanical ventilation, 13.1% received noninvasive mechanical ventilation, and 55.1% were subjected to invasive mechanical ventilation. In turn, 32.9%, 32.2% and 34.8% had PaFi values between 0 and 200, 201–300 and over 300, respectively. A total of 69.8%, 27.5% and 2.6% of the patients presented PEEP values between 0 and 5, 6–10 and over 10 during the first day, respectively. The median Grad(A-a)O2 was 128.
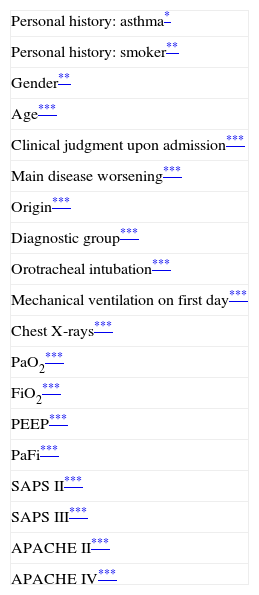
Table 1 shows the variables related to Grad(A-a)O2. The latter was seen to increase in the presence of lung disease (whether primary or secondary), in males, in patients with no antecedents of asthma or smokers. The clinical patients had higher Grad(A-a)O2 values than the surgical patients, in the same way as patients from the conventional hospitalization ward. Orotracheal intubation, mechanical ventilation (particularly invasive ventilation), radiologically manifest lung alterations, higher prognostic scores on the first day, and mortality were all associated to increased Grad(A-a)O2.
Significant variables in relation to Grad(A-a)O2.
| Personal history: asthma* |
| Personal history: smoker** |
| Gender** |
| Age*** |
| Clinical judgment upon admission*** |
| Main disease worsening*** |
| Origin*** |
| Diagnostic group*** |
| Orotracheal intubation*** |
| Mechanical ventilation on first day*** |
| Chest X-rays*** |
| PaO2*** |
| FiO2*** |
| PEEP*** |
| PaFi*** |
| SAPS II*** |
| SAPS III*** |
| APACHE II*** |
| APACHE IV*** |
APACHE: Acute Physiology and Chronic Health Evaluation; FiO2: fraction of inspired oxygen; Grad(A-a)O2: alveolo-arterial oxygen gradient; PaO2: oxygen partial pressure in arterial blood; PEEP: positive end-expiratory pressure; SAPS: Simplified Acute Physiology Score; SOFA: Sepsis-related Organ Failure Assessment.
p<0.05.
p<0.01
p<0.001.
A correlation was observed between Grad(A-a)O2 and PaFi of −0.84 (Pearson correlation index) (p<0.001) (Fig. 1). In the PaFi 0–200 group the Grad(A-a)O2 was 290±127 (range 48–610), in the PaFi 201–300 group the Grad(A-a)O2 was 136±60 (range 31–449), and in the PaFi >300 group the Grad(A-a)O2 was 60±41 (range 0–222); the differences in Grad(A-a)O2 according to the PaFi levels proved significant (p<0.001). Fig. 2 shows the dispersion plot with the line of best fit to the model.
O2 and PaFi during the first day. PaFi is coded according to the consensus conference.° and *: atypical values (outliers).")
O2 and PaFi, with the line that best fits to the model. R2=0.62.")
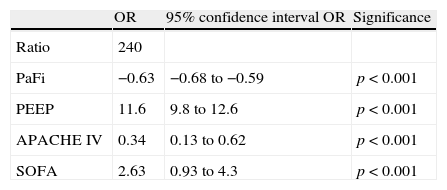
Multiple regression analysis with Grad(A-a)O2 as the dependent variable showed the variables that enter the model to be PaFi, PEEP, and the APACHE IV and SOFA scores (Table 2). It should be noted that patient age, SAPS II, SAPS III and APACHE II did not enter the model. In the regression analysis, the introduction of PEEP clearly improved the model – the determination coefficient (R2) increasing from 0.62 in the model without PEEP to 0.72 in the regression model with PEEP, independently of the rest of the variables.
Multiple linear regression, with the alveolo-arterial oxygen gradient as dependent variable.
| OR | 95% confidence interval OR | Significance | |
| Ratio | 240 | ||
| PaFi | −0.63 | −0.68 to −0.59 | p<0.001 |
| PEEP | 11.6 | 9.8 to 12.6 | p<0.001 |
| APACHE IV | 0.34 | 0.13 to 0.62 | p<0.001 |
| SOFA | 2.63 | 0.93 to 4.3 | p<0.001 |
APACHE: Acute Physiology and Chronic Health Evaluation; PaFi: PaO2/FiO2; PEEP: positive end-expiratory pressure; SOFA: Sepsis-related Organ Failure Assessment.
Based on the mathematical confirmation of a fact which we had assumed to be clear (i.e., that PEEP is of importance in quantifying the degree of respiratory impairment), we attempted to modify the PaFi formula by introducing PEEP, with a view to improving the fit. After a number of tests, the formula—referred to as PaFip (PaFi with the addition of PEEP)—offering the best fit was seen to be the following:
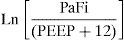
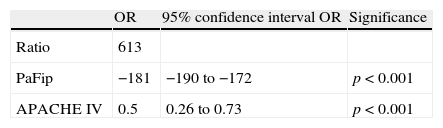
In the formula, when PEEP is 0, the value 1 is entered. For the rest of the levels (>1), we enter the corresponding value. This formula was determined in patients with or without mechanical ventilation. It yielded a Pearson correlation index between PaFip and Grad(A-a)O2 of −0.9 (p<0.001). On fitting to the straight line, the fit of the dispersion plot was seen to improve considerably (Fig. 3). For the global patient series, PaFip showed a median value of 2.8, and a mean of 2.8±0.6 (range 0.9–3.9). Table 3 shows the results obtained on performing linear regression analysis with Grad(A-a)O2 as the dependent variable, and introducing PaFip instead of PaFi. As can be seen, only PaFi remained in the model, discretely complemented by the APACHE IV score, which did little to improve the model; the rest of the variables did not intervene. The R2 value (determination coefficient) in the PaFip model was 0.8 (i.e., 80% of the data would be explained in this case, with an 18% improvement with respect to explanation of the data by PaFi alone). PaFi and PaFip presented a correlation index of 0.92 (p<0.001).
O2 and PaFip, with the line that best fits to the model. R2=0.8.")
Multiple linear regression, with the alveolo-arterial oxygen gradient as independent variable. PaFip is introduced in the model.
| OR | 95% confidence interval OR | Significance | |
| Ratio | 613 | ||
| PaFip | −181 | −190 to −172 | p<0.001 |
| APACHE IV | 0.5 | 0.26 to 0.73 | p<0.001 |
APACHE: Acute Physiology and Chronic Health Evaluation; PaFip: Ln [PaFi/(PEEP+12)]; SOFA: Sepsis-related Organ Failure Assessment.
On examining the correlation between Grad(A-a)O2 and PaFi coded by intervals according to the consensus conference, we found the correlation index in the PaFi intervals 0–200, 201–300 and >300 to be −0.76, −0.43 and −0.63, respectively. On doing the same with PaFip, i.e., referred to the correlation between Grad(A-a)O2 and the new intervals found, we observed the correlation index in the intervals 1–1.99, 2–2.99 and 3–4 to be −0.7, −0.7 and −0.73, respectively. In each case, PaFi and PaFip, the correlations were significant (p<0.001).
DiscussionAfter the first studies in 1910 showing gas exchange to be a result of diffusion phenomena, considerable interest focused on its characterization in clinical practice.6 As a result of the studies made during the Second World War by Fenn, Rahn and Riley, increased knowledge was gained of concepts that are well consolidated today, referred to oxygen physiology in general and to the alveolo-arterial oxygen gradient in particular.7–10
PaFi (PaO2/FiO2) is a widely used index for evaluating oxygen exchange, due to the ease with which it is calculated, and the fact that it can be obtained at the patient bedside. Its importance is moreover increased in that it forms part of the definitions of ARDS and ALI established by the American-European Consensus Conference,1 and of the Lung Injury Score.10 In this context, we may speak of ALI in the presence of bilateral lung infiltrates, discarding cardiogenic causes (pulmonary wedge pressure <18mmHg), and with a PaFi of between 201 and 300. In turn, ARDS is considered in the presence of the same radiological and hemodynamic criteria, with a PaFi of ≤200. As has been commented, its great advantage is the ease with which it is calculated. In contrast, its main problems are the following:
- -
Changes in FiO2 influence the observed intrapulmonary shunt fraction.11 When FiO2 is increased to 1, the effects of the alterations in the ventilation/perfusion ratio may be masked, with possible underestimation of the intrapulmonary shunt–particularly in situations characterized by a reduction of the ventilation/perfusion ratio (COPD, asthma, etc.). Furthermore, atelectasis usually appears at high FiO2, which in turn increases the shunt fraction.12
- -
The relationship between PaFi and FiO2 is not linear. Because of the complex relationship among the hemoglobin dissociation curve, Grad(A-a)O2, the arterial CO2 pressure and the hemoglobin levels, the relationship between PaFi and FiO2 is likewise complex13: it is neither constant nor linear, not even in situations in which the shunt remains constant. As a result, PaFi can show different behaviors for a greater or lesser FiO2, according to the existing shunt fraction.14
- -
PEEP modifies PaFi. Accordingly, one same PaFi value can be obtained under very different respiratory conditions with very different PEEP values.15 Attempts have been made to overcome these problems with PEEP-modified PaFi indices such as the oxygenation index [PaO2/(FiO2×mean respiratory pressure)]. This index was established in a sample of patients in the postoperative period of heart surgery, and now appears to be of some usefulness in the pediatric setting—though it has not been extended to adults.16
The calculation of Grad(A-a)O2 allows us to assess the ventilation-perfusion imbalance. Accordingly, we have used it to determine whether PaFi can be improved by means of a formula containing PEEP in explaining the diffusion alterations. In clinical practice, all intensivists view the PEEP value (following the appropriate adjustments) as a lung severity index. In this context, scales are often used in which PEEP is a key element in the assessment, along with PaFi.10
In our study, the multivariate analysis found PaFi alone to explain the fit of 62% of the data shown by Grad(A-a)O2. On introducing PEEP, this percentage would increase to 72%. It is clear that PEEP should be entered in the model, in the denominator along with FiO2, given their mutual contribution to oxygenation, though this cannot be done in a simple arithmetic manner. In this context, among the different models tested, we finally opted for a Naperian logarithm-based formula that renders the mathematical model more linear. With this equation, referred to as PaFip, we have been able to obtain a much better fit. In effect, the goodness of fit reaches 80% of the data of Grad(A-a)O2 explained by the PaFip regression model. This merely represents mathematical confirmation of something which we see in daily clinical practice.
Grad(A-a)O2 is frequently used in the evaluation of lung disease. We are aware that it has some important limitations:
- -
It is conditioned by FiO2. Accordingly, a high Grad(A-a)O2 with a high FiO2 may be seen in healthy subjects. This possibly could be mitigated by adjusting the minimum FiO2 required by the patient before the gradient is determined.
- -
Grad(A-a)O2 is only a reliable indicator of physiological shunt alterations in the presence of cardiovascular stability, constant FiO2 and elevated PaO2. In our study, the samples were obtained when the patient proved stable from the cardiovascular perspective, and FiO2 had been constant for several hours.
This situation causes patients with COPD and alveolar hypoventilation to possibly show normal values in the presence of important alterations in ventilation/perfusion ratio, or normal values may even be found in patients with pulmonary embolism.3,17 In any case, it is currently still used as a reference element in many situations4,17–23; as a result, we considered it of interest to conduct the present study with a view to exploring the value of the gradient as a reference of respiratory worsening.
As a result of the consensus conference, PaFi has been classified into different groups, in which the extreme cases define ALI and ARDS, in association to an appropriate clinical context.1,10 Of note is the great overlapping of values of Grad(A-a)O2 in each interval, as seen in Fig. 1. It is usually stated that Grad(A-a)O2 should not exceed 20mmHg in situations of hemodynamic stability and a FiO2 of 0.21. In our patients, in the PaFi >300 group, the mean value was 60. It is therefore difficult in critical patients to define the cutoff points of Grad(A-a)O2 that allow us to delimit contexts of increased respiratory worsening; our study was not designed with this in mind. However, we did observe the correlation between the values of PaFi in each interval and the values of Grad(A-a)O2. An adequate correlation was seen (−0.76) in the PaFi interval of 0–200, with a lesser correlation in the PaFi interval of >300 (−0.63), and a clearly deficient correlation in the PaFi interval of 201–300 (−0.43). This would indicate a shadow zone in the latter interval, and particularly better characterization of the patients with a lower PaFi, and thus a higher Grad(A-a)O2. On adding PEEP to the model and using PaFip, we have established three new cutoff points, similar to the previous points, and which in general exhibit much better correlation (≥−0.7 in each PaFip interval).
In our study we included patients with or without mechanical ventilation and/or PEEP, and the study sample was very heterogeneous. This lack of homogeneity weakens the results, but adds value to the conclusions, since it is our aim to apply this approach to all the patients we see in the setting of the ICU (thereby gaining external validity).
In conclusion, it can be affirmed that on adding PEEP to the PaFi model, using PaFip (Ln(PaFi/(PEEP+12))), we are able to improve the model considerably, with a better goodness of fit, bringing it closer to the routine clinical setting and introducing a parameter as important as PEEP in an easy manner. This in turn would require the adoption of new cutoff points.
Conflicts of interestThe authors declare no conflicts of interest.
Please cite this article as: Sánchez Casado M, et al. Relación entre el gradiente alveolo-arterial de oxígeno y la PaO2/FiO2 introduciendo la PEEP en el modelo. Med Intensiva. 2012;36:329–34.

