

As of June 3rd there are over 6.4 million confirmed cases in over 188 countries and territories and 382,435 confirmed deaths.1 New York has reported 30,007 of these deaths, or 7.8% of all COVID-19 deaths in the world to date, and has just passed the inevitable mantle of epicenter of the pandemic to Latin America.2
Discerning those patients whom are most likely to die due to COVID-19 is a challenge given the novelty of the syndrome. A better understanding of which patient progresses to serious disease with critical need of care, and which patient experiences rapid recovery could help better inform our understanding of the COVID-19 syndrome and better care for all patients.3 Such information could also assist in the allocation of intensive care beds, ventilators, and planning palliative care and hospice support.
While the majority of those who test positive for SARS-CoV-2 will not require hospital admission, intensive care or mechanical ventilation, some will (data from our institution suggest ∼13% of those hospitalized due to COVID-19 underwent mechanical ventilation). Concerns over a shortage of ventilators have transformed into commentary about ventilators being overused, while it is now shortages of medications that are anticipated.3
A recent publication outlined the unprecedented opportunities of prediction models to inform, personalize and improve care, as well as reiterating principles for the creation and use of such models.4 Using the Mount Sinai Health Systems’ database of all SARS-Co-V-2 positive patients with an encounter in New York City, we developed a prediction model to identify those patients most likely to succumb to the disease thin 7 days (the median time to death of those who died) from the onset of COVID-19 symptoms. We did this by first identifying all those whom died following a positive SARS-CoV-2 test, and all of those whom were positive for SARS-CoV-2, but surviving after at least 7 days post-diagnosis (Table 1). The data was randomly divided into a training and independent holdout dataset (80%:20%). Feature selection included least absolute shrinkage and selection operator (LASSO) regression method. Prediction models were built using machine learning methods including SVM, k-NN and random forest. The performance of the constructed model was assessed by area under the receiver operating characteristic curve (AUC), calibration (calibration plots and Hosmer–Lemeshow calibration test) and clinical utility assessed by decision curve analysis.
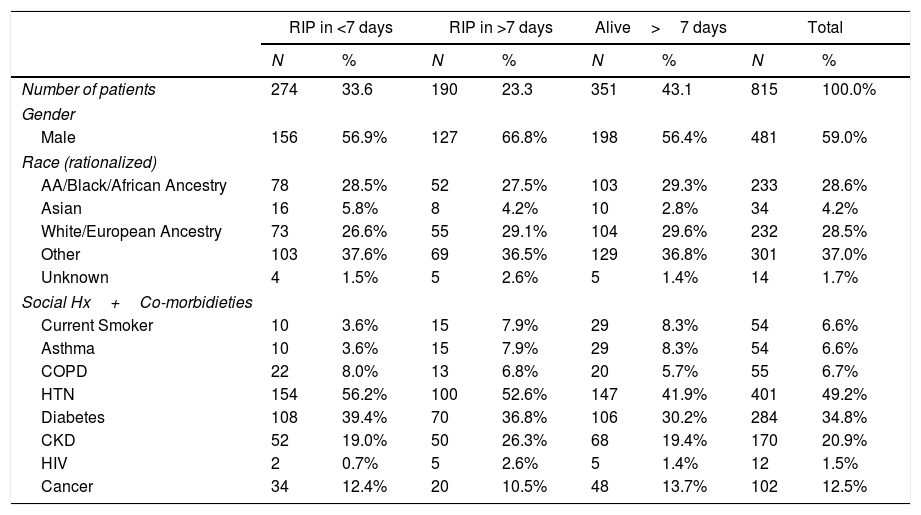
Patient characteristics of this cohort.
| RIP in <7 days | RIP in >7 days | Alive>7 days | Total | |||||
|---|---|---|---|---|---|---|---|---|
| N | % | N | % | N | % | N | % | |
| Number of patients | 274 | 33.6 | 190 | 23.3 | 351 | 43.1 | 815 | 100.0% |
| Gender | ||||||||
| Male | 156 | 56.9% | 127 | 66.8% | 198 | 56.4% | 481 | 59.0% |
| Race (rationalized) | ||||||||
| AA/Black/African Ancestry | 78 | 28.5% | 52 | 27.5% | 103 | 29.3% | 233 | 28.6% |
| Asian | 16 | 5.8% | 8 | 4.2% | 10 | 2.8% | 34 | 4.2% |
| White/European Ancestry | 73 | 26.6% | 55 | 29.1% | 104 | 29.6% | 232 | 28.5% |
| Other | 103 | 37.6% | 69 | 36.5% | 129 | 36.8% | 301 | 37.0% |
| Unknown | 4 | 1.5% | 5 | 2.6% | 5 | 1.4% | 14 | 1.7% |
| Social Hx+Co-morbidieties | ||||||||
| Current Smoker | 10 | 3.6% | 15 | 7.9% | 29 | 8.3% | 54 | 6.6% |
| Asthma | 10 | 3.6% | 15 | 7.9% | 29 | 8.3% | 54 | 6.6% |
| COPD | 22 | 8.0% | 13 | 6.8% | 20 | 5.7% | 55 | 6.7% |
| HTN | 154 | 56.2% | 100 | 52.6% | 147 | 41.9% | 401 | 49.2% |
| Diabetes | 108 | 39.4% | 70 | 36.8% | 106 | 30.2% | 284 | 34.8% |
| CKD | 52 | 19.0% | 50 | 26.3% | 68 | 19.4% | 170 | 20.9% |
| HIV | 2 | 0.7% | 5 | 2.6% | 5 | 1.4% | 12 | 1.5% |
| Cancer | 34 | 12.4% | 20 | 10.5% | 48 | 13.7% | 102 | 12.5% |
Percentages may not total 100, due to rounding. RIP in ≥7 days was chosen as a cut point as the median time to death from the onset of symptoms was 7 days. AA: refers to African American; COPD: chronic obstructive pulmonary disease; HTN: hypertension; CKD: chronic kidney disease; HIV: positive for human immunodeficiency virus.
During the study period, there were 14,651 patients who tested positive for SARS-CoV-2; complete data was available for 5152. Of these 464 (9%) died; the median time to death from the onset of symptoms was 7 days in this cohort.5 Patients who had been in hospital for at least 7 days and had not deceased accounted for 6.8% of this cohort (N=351) (Table 1). Significant predictors of mortality within 7 days of symptom onset (as identified by the feature selection method described above) include age, gender, respiratory rate, oxygen saturation level, systolic blood pressure, maximum temperature and zip code (Fig. 1A).
 Correlation matrix demonstrating the statistically significant (p<0.05) correlations between risk factors and the ‘outcome’ variable of death within 7 days from symptom onset: the larger the size and the stronger the color, the higher the correlation. (b) Receiver operating characteristic curves and AUC values for the model constructed to predict death within 7 days from the listed variables (Age, Sex, Systolic BP, Max Temperature, O2 saturations and Zip code) in the independent holdout dataset demonstrating the discriminative ability of this model (AUC=0.8612; 95% CI 0.804–0.919). (c) Calibration curves of the model in the holdout dataset demonstrating the agreement between predicted and observed probabilities of a positive Covid-19 test. (d) Decision curve analysis for positive Covid-19 test prediction in the holdout dataset. (e) Screenshot of the deployed web-app which is freely available for use online at The risk tool is freely available online at www.tiny.cc/covidcalc (f) Kaplan–Meier Curve of risk strata as defined by the derived risk model derived from 3 demographic and 4 clinical features.; risk strata of low (33% risk of death within 7 days) intermediate (34–66%) and high risk (>66%) are plotted in an independent hold-out test set from the NY cohort.")
(a) Correlation matrix demonstrating the statistically significant (p<0.05) correlations between risk factors and the ‘outcome’ variable of death within 7 days from symptom onset: the larger the size and the stronger the color, the higher the correlation. (b) Receiver operating characteristic curves and AUC values for the model constructed to predict death within 7 days from the listed variables (Age, Sex, Systolic BP, Max Temperature, O2 saturations and Zip code) in the independent holdout dataset demonstrating the discriminative ability of this model (AUC=0.8612; 95% CI 0.804–0.919). (c) Calibration curves of the model in the holdout dataset demonstrating the agreement between predicted and observed probabilities of a positive Covid-19 test. (d) Decision curve analysis for positive Covid-19 test prediction in the holdout dataset. (e) Screenshot of the deployed web-app which is freely available for use online at The risk tool is freely available online at www.tiny.cc/covidcalc (f) Kaplan–Meier Curve of risk strata as defined by the derived risk model derived from 3 demographic and 4 clinical features.; risk strata of low (33% risk of death within 7 days) intermediate (34–66%) and high risk (>66%) are plotted in an independent hold-out test set from the NY cohort.
The risk probability of death within 7 days for patients was calculated from a model developed in 80% of this cohort, using the 3 demographic and 4 clinical variables listed above. The model was assessed in the independent hold-out group using discriminative ability (Fig. 1B: AUC 0.861), calibration curves; which demonstrate that the magnitude of the assigned probabilities track the relative frequency of the observed outcomes (Fig. 1C) and decision curve analysis (Fig. 1D) which demonstrates the model offers a superior net benefit across a greater range of probabilities than other common strategies. Patients were stratified according to their calculated risk probability as follows: low risk <33%, intermediate, 34–66%, and high risk >66%. Patients classified as low risk by this model have a statistically significant longer survival than those in the intermediate and high risk groups (p<0.0001) (Fig. 1F).
This model demonstrates the significant role that both clinical and social determinants play in predicting the clinical outcome for patients infected with SARS-CoV-2 and tested positive for COVID-19. The methods used to develop this risk stratification tool can be easily employed to reproduce a time and location specific model, for other cities and other countries as this pandemic continues to evolve and unfold globally. Such tools can aide clinicians in decision making, and provide health systems with insights to allow them better allocate resources in response to this pandemic.
We would like to acknowledge the contributions of the following, without whom this work would not have been possible: Dr. David Reich, President and COO of Mount Sinai Hospitals for his leadership, the staff of Mount Sinai Hospitals for their dedication and care in documenting the care of and caring for patients; the Department of Scientific Computing at the Icahn School of Medicine at Mount Sinai for the collation of this data.

