


Sepsis is associated to a high mortality rate, and its severity must be evaluated quickly. The severity of illness scores used are intended to be applicable to all patient populations, and generally evaluate in-hospital mortality. However, patients with sepsis continue to be at risk of death after hospital discharge.
ObjectiveTo develop a model for predicting 1-year mortality in critical patients diagnosed with sepsis.
PatientsThe data corresponding to 5650 admissions of patients with sepsis from the Medical Information Mart for Intensive Care (MIMIC-III) database were evaluated, randomly divided as follows: 70% for training and 30% for validation.
DesignA retrospective register-based cohort study was carried out. The clinical information of the first 24h after admission was used to develop a 1-year mortality prediction model based on Stochastic Gradient Boosting (SGB) methodology. Variable selection was addressed using Least Absolute Shrinkage and Selection Operator (LASSO) and SGB variable importance methodologies. The predictive power was evaluated using the area under the ROC curve (AUROC).
ResultsAn AUROC of 0.8039 (95% confidence interval (CI): [0.8033 0.8045]) was obtained in the validation subset. The model exceeded the predictive performances obtained with traditional severity of disease scores in the same subset.
ConclusionThe use of assembly algorithms, such as SGB, for the generation of a customized model for sepsis yields more accurate 1-year mortality prediction than the traditional scoring systems such as SAPS II, SOFA or OASIS.
La sepsis conlleva una elevada mortalidad, y su gravedad debe evaluarse rápidamente. Los sistemas utilizados para clasificar la intensidad de la enfermedad pretenden ser aplicables a todos los pacientes, y generalmente evalúan la mortalidad intrahospitalaria. Sin embargo, los pacientes con sepsis continúan estando en riesgo de muerte después del alta hospitalaria.
ObjetivoDesarrollar un modelo para la predicción de la mortalidad a un año de pacientes en UCI con diagnóstico de sepsis.
PacientesSe evaluaron los datos de 5650 admisiones de pacientes con sepsis de la base de datos Medical Information Mart for Intensive Care (MIMIC-III), los cuales fueron divididos aleatoriamente así: 70% para entrenamiento y 30% para validación.
DiseñoEstudio retrospectivo de cohorte basado en registros. Se utilizó la información clínica de las primeras 24 horas después de la admisión para desarrollar un modelo de predicción de mortalidad a un año basado en la metodología Stochastic Gradient Boosting (SGB). La selección de variables se abordó utilizando las metodologías Least Absolute Shrinkage and Selection Operator (LASSO) e importancia de variables por SGB. El poder predictivo del modelo fue evaluado usando el AUROC.
ResultadosSe obtuvo un AUROC de 0.8039 (intervalo de confianza [IC] del 95%: [0.8033-0.8045]). El modelo supera los resultados obtenidos con algunos puntajes tradicionales en el mismo subconjunto de validación.
ConclusiónEl uso de algoritmos de ensamblaje, como SGB, para la generación de un modelo adaptado para la sepsis, proporcionan estimaciones de mortalidad a un año más precisas que los sistemas de puntuación tradicionales como SAPS II, SOFA u OASIS.
The vast amount of data obtained from a single patient in an Intensive Care Unit (ICU) makes it humanly impossible to organize and interpret it in the required time, especially to predict the outcome of a patient; for this reason, different types of indicators that synthesize multiple physiological and demographic data into a single number that represents the severity of the illness of a patient have been developed from statistical analysis of the data collected for a large number of patients. Some commonly used indicators are severity-of-disease classification systems as APACHE (Acute Physiology and Chronic Health Evaluation), SAPS (Simplified Acute Physiology Score), MPM (Mortality Prediction Model), OASIS (Oxford Acute Severity of Illness Score), SOFA (Sequential Organ Failure Assessment), among others1; in general, there is a score that increases with the risk of patient mortality. These classification systems are used to determine the risk in population studies conducted in an ICU, and provide a method for benchmarking between intensive care units of different hospitals. However, these indicators lack the precision required for use at individual level, they present significant errors at patient data away from the average. For this reason, efforts have been made to increase the performance of these indicators through the use of computational techniques such as machine learning; in recent years, specific models according to groups of patients that shares a common characteristic (like diagnostics, service type or a similarity metric) have been created.2,3
Sepsis is a life-threatening organ dysfunction due to a dysregulated host response to infection. It is an important public health problem, which generates high costs for the health system and carries a high morbidity and mortality (in-hospital mortality ranged from 14.7% to 29.9% in the United States).4
A model that takes into account the peculiarities of sepsis and identify sensitively and early poor patient's outcome, could become a very useful tool to help the clinical group to understand the severity of the disease and could help to the generation of alerts that favor early onset of therapeutic measures, thus helping to improve the prognosis of patients with sepsis admitted to an ICU.
The performance of mortality prediction systems in patients with suspected sepsis, severe sepsis and septic shock have been evaluated in the ICU,5 customized versions for severe sepsis and septic shock of in-hospital mortality classification systems have also been developed,5,6 and even particular models have been created for in hospital mortality prediction of ICU patients with sepsis, severe sepsis and septic shock.7–10
Cited works report better performance than traditionally severity of disease scores and tend to focus on the prediction of in-hospital mortality, however, long-term outcomes from sepsis are poorly understood. Winters et al. concluded that patients with sepsis have ongoing mortality beyond short-term, so the use of 28-day mortality or in-hospital mortality as end points for clinical studies may lead to inaccurate inferences.11 Shankar-Hari and Rubenfeld assert that in the first year following a sepsis episode, approximately 60% of sepsis survivors have at least one rehospitalization episode, which is most often due to infection and one in six sepsis survivors die.12 In 2007 Yende et al. insure that long-term mortality following severe sepsis is high, and fewer than half of patients who experience severe sepsis are alive at 1 year.13 In a different study published in 2016 Yende et al. studied the long-Term Quality of Life Among Survivors of Severe Sepsis and concluded that, among individuals enrolled in the clinical trial who lived independently prior to severe sepsis, one third had died and of those who survived, a further one third had not returned to independent living by 6 months.14
According to all of the above, the main objective of this study is to develop a model that goes beyond the prediction of in-hospital mortality, for this reason, this paper presents the development of a model for the 1-year mortality prediction of sepsis diagnosed patients in an ICU that outperforms commonly used severity-of-disease classification systems. This model would help identify those patients at greatest risk, and will be the first step to detect signs of alarm from a worse outcome beyond the hospital discharge.
Methods and proceduresData baseFor this study we used MIMIC-III (Medical Information Mart for Intensive Care) database. It is the latest version of MIMIC, an open database (https://mimic.physionet.org), and the third version was published in November 2015. MIMIC-III provides demographic information, vital signs measures, laboratory test results, drug information, procedures, fluid balance, length of stay and mortality both inside and outside the medical center. MIMIC-III uses the Social Security Administration Death Master File to obtain the Out-of-hospital mortality dates.15 MIMIC-III contains data associated with 58,977 different hospital admissions for 46,520 patients over 16 years old admitted to the ICU at Beth Israel Medical Center in Boston, United States between 2001 and 2012.15–17
Sepsis criteriaTraditionally sepsis has been linked to a systemic inflammatory response syndrome in response to an infectious process, and presented in three stages: sepsis, severe sepsis and septic shock. However, recently the Third International Consensus Definitions for Sepsis and Septic Shock has recommended the elimination of the terms sepsis syndrome, septicemia, and severe sepsis and instead defined sepsis as “life-threatening organ dysfunction due to a dysregulated host response to infection”. The consensus, also, proposed replacing the Systemic inflammatory response syndrome (SIRS) as diagnostic tool, and substituting with SOFA for encounters in the ICU, as an indicator of organ dysfunction that helps predict a poor prognosis in patients.18–20
In spite of the rigor of the methodology used by the consensus, currently, there remains some controversy around the new definitions,21–23 since the new definitions did not involve low or middle income countries, and SOFA is a score that is routinely calculated in some, but not all, ICUs. Even the experts in sepsis pathobiology of the third international consensus recognized some limitations since some of the definitions and clinical criteria were generated through voting, and unanimity was not always presented.19
Seeking to follow the definition of the consensus, but without forgetting the doubts regarding the new way of doing the diagnosis, we used the Angus criteria in this study to identify ICU patients with sepsis24; therefore, from the 58,977 MIMIC-III admissions, all the ones that complying with the following: (i) ICD-9-CM codes for both a bacterial or fungal infections and a diagnosis of acute organ dysfunction were selected and (ii) explicit sepsis related diagnosis: severe sepsis or septic shock. 15,254 admissions were obtained.
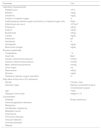
Working dataset and exclusion criteriaThe working dataset was extracted from the 15,254 admissions with a diagnosis of sepsis according to the Angus criteria; First, we selected the admissions of patients aged 16 or older with stays longer than 24 h, resulting in a dataset with 13,836 patients. Then, only the admissions that had at least 70% of the laboratory measurements and at least 70% of routine charted data presented in Table 1 were included in the working dataset, getting 5650 admissions (with a 1-year mortality rate of 43.3%).
Extracted data from each admission.
| Parameter | Unit |
|---|---|
| Laboratory measurements | |
| Platelet count | 109/L |
| Bilirubin | mg/dL |
| Creatinine | mg/dL |
| Fraction of inspired oxygen | % |
| Partial pressure arterial oxygen and fraction of inspired oxygen ratio | Ratio |
| White blood cell count | 103/mm3 |
| Potassium | mEq/L |
| Sodium | mEq/L |
| Bicarbonate | mEq/L |
| Lactate | mg/dL |
| Arterial pH | pH |
| Hematocrit | % |
| Hemoglobin | mg/dL |
| Blood urea nitrogen | mg/dL |
| Routine charted data | |
| Temperature | °C |
| Heart rate | Bpm |
| Systolic arterial blood pressure | mmHg |
| Diastolic arterial blood pressure | mmHg |
| Mean arterial blood pressure | mmHg |
| Urine output | mL |
| Base excess | mEq/L |
| Glucose | mg/dL |
| Peripheral capillary oxygen saturation | % |
| Data taken at the time of ICU admission | |
| Gender | Female, male |
| Admission type | Medical, scheduled surgical |
| Unscheduled surgical | |
| Age | Years |
| Glasgow Coma Scale | Integer 3–15 |
| Comorbidities | |
| Diabetes | Binary (presence) |
| Immunosuppressive diseases | |
| Malignancy | |
| Hematologic malignancy | |
| Metastatic cancer | |
| Heart failure | |
| Pulmonary diseases | |
| Vascular diseases | |
| Coronary diseases | |
| Obesity | |
| Alcohol abuse | |
| Collagen diseases | |
| Drug abuse | |
| Malnutrition | |
| Organ dysfunction | |
| Cardiovascular | Binary (presence) |
| Neurologic | |
| Hepatic | |
| Hematologic | |
| Renal | |
| Mechanical ventilation | |
The data listed in the first two segments of Table 1 were extracted during the first 24h of each admission. Since the variables are not measured with the same frequency, we calculated statistical indices that allowed their description: mean, maximum, minimum, variance and range. Fig. 1 presents two of the variables as an example, the 24 h time window is also shown.

The data listed in the last three segments of Table 1 represent single values throughout the entire duration of a patient admission; therefore, they do not require indicators for their description.
Of all variables listed in Table 1, only four presented more than 5% of missing data being bilirubin the most critical with 34% of absent values, followed by Fraction of Inspired O2 with 15%, Lactate with 13% and Base excess with 7%. The SGB algorithm used for the development of the model is based on decision trees, so it is possible to handle missing values without using imputation.25
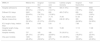
Table 2, presents the description of the admissions selected as study cohort by first care unit type; it is evident the sensitivity of the condition of patients with sepsis, since, when compared to the general MIMIC-III population,15 they present a longer length of stays (both ICU and hospital) and higher in-hospital mortality. Table 2, also shows the 1-year mortality which is almost twice the hospital mortality.
Description of the study cohort.
| MIMIC-III | Medical ICU | Surgical ICU | Coronary care | Cardiac surgery recovery | Surgical trauma ICU | Total |
|---|---|---|---|---|---|---|
| Hospital admissions | 3138 (55.54%) | 765 (13.54%) | 735 (13.01%) | 404 (7.15%) | 608 (10.76%) | 5650 (100%) |
| Different ICU stays | 3402 (53.64%) | 934 (14.73%) | 828 (13.06%) | 483 (7.62%) | 695 (10.96%) | 6342 (100%) |
| Age, median years | 67.5 | 64.72 | 71.75 | 70.36 | 61.63 | 67.54 |
| Gender (masculine) | 1642 (52.32%) | 393 (51.37%) | 406 (55.23%) | 248 (61.38%) | 395 (64.96%) | 3084 (54.58%) |
| ICU length of stay, median days | 5.06 | 6.68 | 5.81 | 8 | 7.88 | 5.9 |
| Hospital length of stay, median days | 10.29 | 14.99 | 10.63 | 15.88 | 17.13 | 11.88 |
| Hospital mortality | 757 (24.12%) | 165 (21.56%) | 168 (22.85%) | 76 (18.81%) | 111 (18.25%) | 1277 (22.6%) |
| One-year mortality | 1459 (46.49%) | 301 (39.34%) | 346 (47.07%) | 161 (39.85%) | 183 (30.09%) | 2450 (43.36%) |
Abbreviations: MIMIC-III: medical information mart for intensive care, ICU: intensive care unit.
The study cohort, containing 5650 admissions, was randomly divided into two groups: a train subset with 3955 admissions (70% of the working set), and a validation subset of 1695 admissions. Fig. 2 presents the accrual of admissions included in the study cohort.
Model development
The data listed in Table 1, were converted into 140 predictors, 115 of which were the statistical descriptions of the laboratory measurements and the routine charted data, 20 were the presences of comorbidities and organ dysfunctions, two were the numerical values for age and Glasgow Coma Score (GCS), and 3 corresponded to the gender and admission type categorical data, since each of these variables were binarized using one hot encoding.
To select the most important predictors for the 1-year mortality prediction model two techniques were used; the first one was Least Absolute Shrinkage and Selection Operator (LASSO) based on maximum likelihood logistic regression; for this methodology mean imputation was used. The second technique was based on Stochastic Gradient Boosting (SGB) variable importance, a procedure that indicates the contributions of each of the predictors to the model, therefore it is possible to choose the most relevant predictors that represent the majority of the performance on the model.
Stochastic gradient boosting (SGB) is a type of ensemble algorithm. An ensemble algorithms consist of multiple base models (Small decision trees for SGB), each one of those provides a different solution to the problem; The solutions of all the base models, are finally combined (usually by weighted voting or averaging) into a single final model output, which is usually a more stable and accurate prediction. The SGB algorithm involves a parameter-tuning process. the three main parameters are: M, the number of trees that are aggregated in the model; ν, the learning rate that helps to control over-fitting by controlling the gradient steps and L, the number of splits performed on each Tree.26–28 Least Absolute Shrinkage and Selection Operator (LASSO),29 is a regression analysis method that performs both variable selection and regularization in order to enhance the prediction accuracy and interpretability of the statistical model. LASSO puts a constraint on the sum of the absolute values of the model parameters, applying a regularization process where it penalizes the coefficients of the regression variables and set some of them exactly to zero. In practice there is tuning parameter λ, that controls the controls the amount of shrinkage that is applied to the estimates. The SGB and LASSO models were implemented with R-packages.30–32 A detailed description of the used methodologies and the parameters tuning process is found in the supplementary material.
After the predictors were selected with both methods five SGB models were developed, two with the predictors selected with each of the methods, one with the intersection of the predictors, one with the union of the predictors and one with all the predictors. To assess performance in the five SGB models developed with the different sets of predictors and the three severity-of-disease classification systems (SOFA, SAPS II and OASIS) we calculate the Area Under an ROC Curve (AUROC) using the PRROC R package.33 This was repeated for 5000 random samples of size 320 to generate the distributions of metrics shown in a comparison boxplot. The goodness of fit of the proposed SGB models was evaluated over the entire validation subset using the Pearson's Chi-square test, to measure the discrepancy between the observed and the predicted mortality distribution; and the Hosmer–Lemeshow Test was used to assess whether or not the observed event rates match predicted event rates in subgroups of increasing probability of the outcome. Fig. 3 illustrates the methodology that was followed to develop the model.
 tuning parameters: M, the number of trees that are aggregated in the model; ν, the learning rate and L, the number of splits performed on each tree. Least Absolute Shrinkage and Selection Operator (LASSO) tuning parameter: λ, controls the controls the amount of shrinkage that is applied to the estimates.")
Model development. Stochastic gradient boosting (SGB) tuning parameters: M, the number of trees that are aggregated in the model; ν, the learning rate and L, the number of splits performed on each tree. Least Absolute Shrinkage and Selection Operator (LASSO) tuning parameter: λ, controls the controls the amount of shrinkage that is applied to the estimates.
For the model based on all the predictors the parameters that presented a better AUROC and an adequate calibration were M (number of trees)=1150, L (number of splits on each tree)=9 and ν (learning rate)=0.01. The predictive power of the SGB model with all the variables over the 1695 admissions of the validation subset were evaluated and an AUROC of 0.8039 (95% confidence interval (CI): [0.8033 0.8045]) was obtained; with this methodology the relative influence of each variable is scaled so that the sum adds 100, with higher numbers indicating stronger influence on the response, the 37 most important predictors for the 1-year mortality are presented in Fig. 4.

SGB relative importance of the predictors for the 1-year mortality prediction model. Abbreviations: Bun: blood urea nitrogen; Max: maximum; WBC: white blood cell; Min: minimum; SpO2: peripheral capillary oxygen saturation; PaO2/FiO2: partial pressure arterial oxygen and fraction of inspired oxygen ratio; FiO2: fraction of inspired oxygen; Mechanical vent: mechanical ventilation; DABP: diastolic arterial blood pressure; SABP: systolic arterial blood pressure; MABP: mean arterial blood pressure.
After applying LASSO regularization process some of the coefficients of the regression are set exactly to zero. Table 3 presents the LASSO selected predictors (with shrinkage parameter λ=0.01288503). For the SGB model with the intersection variables (18 predictors) the AUROC was 0.792 (95% confidence interval (CI): [0.791 0.793]). The other three SGB models were not different in their performance to the model with all the variables.
LASSO selected predictors.
| Predictor |
|---|
| Haematologic malignancy |
| Metastatic cancer |
| Admission type |
| Gender |
| Age |
| Heart rate maximum |
| Systolic arterial blood pressure minimum |
| Systolic arterial blood pressure maximum |
| Temperature minimum |
| Temperature maximum |
| Urine output |
| Blood urea nitrogen maximum |
| White blood cell count maximum |
| Bilirubin maximum |
| Glasgow Coma Scale Minimum |
| Diastolic arterial blood pressure minimum |
| Base excess maximum |
| Fraction of inspired oxygen maximum |
| Glucose minimum |
| Peripheral capillary oxygen saturation minimum |
| Peripheral capillary oxygen saturation mean |
| Creatinine maximum |
| Creatinine range |
| Hemoglobin maximum |
| Lactate minimum |
| Lactate mean |
| Platelet count maximum |
| Malignancy |
| Heart failure |
| Vascular |
| Obesity |
| Alcohol abuse |
| Hypertension |
| Cardiovascular |
| Haematologic dysfunction |
| Renal dysfunction |
| Mechanical ventilation |
To benchmark the proposed SGB models, three severity-of-disease classification systems were used to evaluate the 1-year mortality on the same validation subset. The AUROC values for the reference scores were: OASIS 0.631 (95% confidence interval (CI): [0.630–0.632]), SOFA 0.588 (95% confidence interval (CI): [0.587–0.589]) and SAPS2 0.702 (95% confidence interval (CI): [0.701–0.703]). Fig. 5 presents the box plots of the AUROC and the accuracy of the three reference severity of disease scores and the SGB models with all the predictors and the intersection predictors.
, and the variables from the intersection between the SGB variable importance selected variables and the LASSO selected variables (18 predictors).")
Box plots of AUROC and accuracy for the 1-year mortality on the validation subset. For the proposed SGB models with all variables (140 predictors), and the variables from the intersection between the SGB variable importance selected variables and the LASSO selected variables (18 predictors).
The calibration of the proposed SGB models was adequate with p-values of 0.0916 and 0.127 for the model with all the variables and the model with the intersection variables respectively. Goodness of fit was also adequate (p-values for all variables model: 0.1857 and p-values for intersection model: 0.9219).
For SGB model with the intersection predictors, observed versus predicted of numbers of deaths were compared graphically within deciles of increasing probability of the 1-year mortality (Fig. 6), and it is observed that estimated and observed mortality pairs are similar and shows that the number of outcome events is indeed increasing along the probability deciles. The relative importance of the 18 predictors of the intersection models are listed in Table 4. These predictors allow to identify features that could become prognostic markers for the 1-year mortality of the sepsis diagnosed patients within the ICU and could be an input for a new severity score for patients with sepsis in the ICU.

Relative importance of intersection model.
| Predictor | Relative importance |
|---|---|
| Age | 17.77 |
| Urine output | 16.17 |
| Blood urea nitrogen maximum | 7.28 |
| Metastatic cancer | 5.82 |
| Temperature maximum | 5.03 |
| Bilirubin maximum | 5.01 |
| Hemoglobin maximum | 4.98 |
| Lactate mean | 4.38 |
| Lactate minimum | 4.3 |
| Temperature minimum | 4.1 |
| Platelet count maximum | 3.81 |
| Glucose minimum | 3.72 |
| Peripheral capillary oxygen saturation mean | 3.53 |
| White blood cell count minimum | 3.47 |
| Systolic arterial blood pressure maximum | 3.43 |
| Malignancy | 2.89 |
| Mechanical ventilation | 2.58 |
| Hypertension | 1.74 |
Accuracy and AUROC analysis over the validation data indicate that custom mortality prediction models for a specific disease presents a better performance that traditional scores, which could lead to better management of illness within the ICU. Accuracy and AUROC analysis also ratify the complex interdependence among different physiological systems in response to sepsis, because the SGB models are composed of between 450 and 1150 trees, which are difficult to interpret; therefore, it is necessary to develop easy-to-use computer tools that allow these types of models to be implemented within the ICU. This study indicates that it is possible to generate a specific model for the prediction of mortality of patients admitted to an ICU with a diagnosis of sepsis, that includes variables that are now commonly evaluated and been widely used.
SGB variable importance and LASSO methodologies allowed to develop models that preserve the same performance as the one generated with all the predictors but with less predictors. Also the intersection of the predictors selected by the two methods leads to the development of a much simpler model with only 18 predictors and less trees, which also presents good performance.
As expected, older patients are at greater risk in consequence the most important parameter for the outcome is the age. Urine output is used as a marker of acute kidney injury, a disease that is associated with substantial in-hospital mortality, beside this, it is important to note that it is a relatively simple and widely used variable in the ICU that has a high relevance in predicting 1-year mortality with the SGB methodology.
Minimum lactate over the first 24h of the ICU admission is the ninth most important variable for the outcome prediction in this study; Lactate is currently used within the ICU as a diagnostic tool and as a prognostic marker, since the higher the value, the greater the risk of mortality. However, if the lactate of a patient does not reach below a threshold, it will also have a higher mortality risk. For this reason, the minimum lactate during the first 24h must also be analyzed in ICUs. Mean lactate is also considered an important predictor, which agrees with what is reported in the literature, since hyperlactatemia is related with a poor outcome in ICU.34 An elevated blood urea nitrogen (BUN) is associated with increased mortality in critically ill patients.35
The main objective of this work is to present a model for the 1-year mortality prediction of the patients that are admitted in a ICU with a sepsis diagnosis; and shows that the use of ensemble based algorithms (SGB in this study) and the inclusion of statistical descriptors that are not usually taken into account in the traditional severity-of-disease classification systems (for example mean, minimum and maximum values of the same variable), improves the performance of the prediction of prognosis models in patients admitted to an ICU with diagnosis of sepsis, however, this means that the model can only be used after the first 24h of observation.
Other limitations of this study include the fact that it is based on the data taken at only one institution, however, despite the limitation of being single-centered, the main advantages of MIMIC-III are that, right now, it is the only freely accessible critical care database of its kind, the dataset spans more than a decade and it has detailed information about individual patient care that includes time-stamped nurse-verified physiological measurements. For this reasons MIMIC-III (and specially it previous version MIMIC-II) are widely used internationally. For this study in particular, an important advantage is that besides in-hospital mortality, MIMIC-III provides Out-of-hospital mortality dates through the Social Security Administration Death Master File. On the other hand, there have been few validated methods of medical record data extraction for estimating sepsis, particularly in this work, the Angus criteria was used, which is one of the first protocols using administrative data, and was validated by comparing a nurse-driven identification of a population of patients with the clinical syndrome of sepsis, however, Angus criteria has shown to be capable of capture most of the patients with severe sepsis but not exclusively and cohorts identified by different methodologies (for instances Angus criteria and Martin Criteria) yielded widely different patient groups.36
It is also important to note that the criteria used to select patients is based on the ICD codes, which in MIMIC-III are generated for billing purposes at the end of the hospital stay, hence it does not guarantee that patients suffer from sepsis at the time of admission, even so, we evaluate the data of the first 24 hours after admission since we considered that the majority of patients are usually already infected at ICU admission.
The emergence of machine learning techniques in the field of health is a fact. Specifically, in the field of Intensive Care, it is undeniable that the potential for its application is immense. Specifically, the use of assembly algorithms, and in particular the SGB, allows the development of prediction models, which despite being complex show significantly better discrimination than traditional severity of disease scores (Like OASIS, SAPS II or SOFA). This could be explained by the fact that the base models in the SGB algorithm are not fitted independently, but sequentially, this mean that the subsequent predictors are based on the results of previous predictors, moreover, SGB is based on a steepest gradient algorithm which places emphasis on misclassified training data that are close to their correct classification, which reduces the number of misclassified observations and facilitates mortality prediction models to be used at the individual level.
Author's contributionJavier E. García-Gallo contributed in the concepts, design, definition of intellectual content, literature search, experimental studies, data acquisition, data analysis, statistical analysis, manuscript preparation, manuscript editing, manuscript review.
Nelson J. Fonseca-Ruiz contributed in the concepts, design, definition of intellectual content, literature search, data analysis, manuscript editing, manuscript review.
Leo Anthony Celi contributed in the concepts, design, definition of intellectual content, literature search, manuscript preparation, manuscript editing, manuscript review.
John F. Duitama-Muñoz contributed in the concepts, design, definition of intellectual content, data analysis, manuscript preparation, manuscript editing, manuscript review.
Conflicts of interestThe authors have no conflicts of interest to declare.
This work was supported by COLCIENCIAS – Departamento Administrativo de Ciencia, Tecnología e Innovación de la República de Colombia through the Doctorados nacionales program.


