


Edited by: Rosario Amaya Villar - Unidad de Cuidados Intensivos, Hospital Universitario Virgen del Rocio, Sevilla, España
Last update: January 2025
More infoTo compare adherence to protective mechanical ventilation (MV) parameters in patients with acute respiratory distress syndrome (ARDS) caused by COVID-19 with patients with ARDS from other etiologies.
DesignMultiple prospective cohort study.
Setting: Two Brazilian cohorts of ARDS patients were evaluated. One with COVID-19 patients admitted to two Brazilian intensive care units (ICUs) in 2020 and 2021 (C-ARDS, n=282), the other with ARDS-patients from other etiologies admitted to 37 Brazilian ICUs in 2016 (NC-ARDS, n=120).
Patients: ARDS patients under MV.
Interventions: None.
Main variables of interest: Adherence to protective MV (tidal volume ≤8mL/kg PBW; plateau pressure ≤30cmH2O; and driving pressure ≤15cmH2O), adherence to each individual component of the protective MV, and the association between protective MV and mortality.
ResultsAdherence to protective MV was higher in C-ARDS than in NC-ARDS patients (65.8% vs. 50.0%, p=0.005), mainly due to a higher adherence to driving pressure ≤15cmH2O (75.0% vs. 62.4%, p=0.02). Multivariable logistic regression showed that the C-ARDS cohort was independently associated with adherence to protective MV. Among the components of the protective MV, only limiting driving pressure was independently associated with lower ICU mortality.
ConclusionsHigher adherence to protective MV in patients with C-ARDS was secondary to higher adherence to limiting driving pressure. Additionally, lower driving pressure was independently associated with lower ICU mortality, which suggests that limiting exposure to driving pressure may improve survival in these patients.
Comparar la adhesión a la ventilación mecánica (VM) protectora en pacientes con síndrome de dificultad respiratoria aguda (SDRA) causada por COVID-19 con pacientes con SDRA de otras etiologías.
DiseñoEstudio de cohorte prospectivo.
Âmbito: Se evaluaron dos cohortes de pacientes con SDRA: 1.pacientes con COVID-19 ingresados en dos unidades de cuidados intensivos (UCI) brasileñas en 2020 y 2021 (C-ARDS, n=282); 2.pacientes con SDRA de otras etiologías ingresados en 37 UCI brasileñas en 2016 (NC-ARDS, n=120).
Pacientes: Pacientes con SDRA bajo VM invasiva.
Intervenciones: No.
Variables de interés principals: Adhesión a la VM protectora (volumen tidal ≤8mL/kg; presión de meseta ≤30cmH2O; y presión de distensión [PD] ≤15cmH2O), adhesión a cada componente individual de la VM protectora, y la asociación entre la VM protectora y la mortalidad.
ResultadosLa adhesión a la VM protectora fue mayor en la cohorte C-ARDS que en la NC-ARDS (65,8% vs. 50,0%, p=0,005), principalmente debido a mayor adhesión a la PD≤15cmH2O (75,0% vs. 62,4%, p=0,02). La regresión logística multivariable mostró que la cohorte C-ARDS se asoció de forma independiente con la adhesión a la VM protectora. Entre los componentes de la VM protectora, sólo la limitación de la PD se asoció de forma independiente con menor mortalidad en la UCI.
ConclusiónLa mayor adhesión a la VM protectora en los pacientes con C-ARDS fue secundaria a la mayor adhesión a limitación da PD. Además, una menor PD se asoció de forma independiente a menor mortalidad en la UCI, lo que sugiere que limitar la exposición a altas PD puede mejorar la supervivencia en estos pacientes.
Patients with acute respiratory distress syndrome (ARDS) are particularly exposed to ventilator-induced lung injury (VILI)1,2. In these patients, only a small proportion of the lungs is aerated and these ventilated areas might be exposed to excessive strain and stress, leading to local inflammation due to mechanical transduction3,4. The use of low tidal volume (VT=6 to 8mL/kg of predicted body weight [PBW]) and the maintenance of plateau pressure (Pplat) <30cm H2O might decrease mortality in ARDS patients by reducing VILI occurrence5,6.
However, limiting the VT based on PBW normalizes the VT to the lung size but might not guarantee protective mechanical ventilation (MV), particularly in patients with severe ARDS. In these patients, alveolar overdistension can occur at the end of inspiration even with low VT7. Moreover, protective MV might not be guaranteed by limiting the Pplat, especially in patients ventilated with low levels of positive end-expiratory pressure (PEEP)7. Facing these limitations, Amato et al. proposed the driving pressure (DP) as an important parameter to guide the ventilatory strategy in ARDS patients. DP allows to adjust VT based on the amount of preserved and aerated lung tissue, which can be better estimated by the compliance of the respiratory system (CRS) than by the PBW8. Observational studies have confirmed the association between lower DP levels during MV and lower mortality in ARDS patients9,10.
Patients with severe COVID-19 may develop acute respiratory failure and frequently fulfill the criteria for ARDS according to the Berlin definition11,12. For those patients, the same principles of protective MV, including VT of 6−8mL/kg PBW, Pplat lower than 30cm H2O, and DP lower than 15cm H2O, are recommended for both groups of patients13.
As the COVID-19 pandemic occurred years after the description of the concepts of protective MV, we hypothesized that adherence to protective MV might be greater during the pandemic, compared with the MV applied to ARDS patients before COVID-19. To test this hypothesis, we compared the ventilatory parameters applied to ARDS patients from two cohorts, one of ARDS caused by COVID-19 (C-ARDS) and the other of ARDS with other etiologies (NC-ARDS).
Patients and methodsDesign, settings and participantsThis study compared two prospective cohorts, one of C-ARDS patients and the other of NC-ARDS patients. The C-ARDS cohort was conducted in two COVID-19 dedicated ICUs in Juiz de Fora (Minas Gerais, Brazil), from March 2020 to June 2021. In this cohort, all consecutive patients aged 18 years or older were eligible for participation if they were admitted to one of the participant ICUs with COVID-19 confirmed by RT-PCR, received invasive MV, and had ARDS defined by the Berlin criteria11. We excluded patients who had received invasive MV for more than 24h before admission in the participating ICUs, patients who were ventilated for less than 24h, and those for whom life-sustaining treatment was withheld.
To form the NC-ARDS cohort, we performed a secondary analysis of a prospective, observational, multicenter international cohort conducted over 30 days in 201614. For the purpose of this analysis, patients admitted to the 37 participant Brazilian ICUs were included. Among these patients, we included those aged 18 years or older, who received invasive MV, and in whom ARDS was the reason for MV or those who developed ARDS on the first day of MV. In both cases, ARDS diagnosis was based on the Berlin criteria12. We excluded patients who were ventilated for less than 24h, and those for whom life-sustaining treatment was withheld.
The study protocols of both cohorts followed the ethical principles of the Declaration of Helsinki and were approved by the Ethics Committees of each participant hospital and written informed consent was obtained from the patients’ next of kin (protocols number: 3.949.165 and 1.443.656).
Data collectionAt admission, the following patient’s characteristics were prospectively recorded: age, sex, severity scores (estimated by Simplified Acute Physiology Score III [SAPS III], in the C-ARDS cohort, and by Simplified Acute Physiology Score II [SAPS II] in the NC-ARDS cohort), cardiovascular dysfunction and renal dysfunction defined as sequential organ failure assessment (SOFA) sub-score higher than 2 points for each respective organ.
Day 0 was defined as the first calendar day that a patient received invasive MV in a participant ICU. We did not collect ventilatory parameters on day 0, at the time of patient stabilization after orotracheal intubation and MV initiation, but only on days 1–2, given the patient's delicacy and severity, to make the reproducibility of any future study increase. The following ventilatory parameters were collected on days 1 and 2, as close as possible to 8 a.m.: ventilatory mode, VT, respiratory rate, PEEP, Pplat during volume-controlled mode and maximum airway pressure (Pmax) during pressure-controlled modes, DP (=Pplat minus total PEEP or Pmax minus total PEEP), CRS (=VT divided by DP). VT was also expressed as VT normalized for PBW (mL/kg PBW). The PBW was calculated by the following equations: PBW=50+0.91×(height expressed in cm–152.4), for males; PBW=45.5+0.91×(height expressed in cm–152.4), for females6. Arterial blood gas analysis was recorded simultaneously with the ventilatory parameters.
OutcomesThe primary outcome was adherence to protective MV, defined by the presence of all the following three parameters: VT ≤8mL/kg PBW; Pplat ≤30cm H2O; and DP≤15cm H2O. Secondary outcomes included: adherence to each individual component of the protective MV definition, ICU and hospital mortality.
Statistical analysisCategorical variables are reported as numbers (relative proportions) and were compared using Chi-square test. Continuous variables are reported as median (25th–75th percentile) and were compared using Mann-Whitney U test or t-test, as appropriate.
Scatterplots were used to present distributions of VT versus Pplat, VT versus DP, PEEP versus Pplat, and PEEP versus DP. We chose cutoffs of 8mL/kg PBW for VT, 30cm H2O for Pplat, and 15cm H2O for DP, based on the definition of protective MV. VT, Pplat, DP, and PEEP on day 1 were presented in cumulative distribution plots.
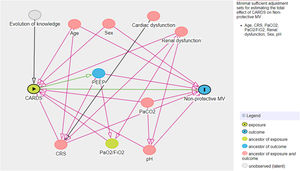
A multivariate logistic model was performed considering the cohort (C-ARDS or NC-ARDS) as the independent variable of interest and the protective MV as the dependent variable. We performed a directed acyclic graph (DAG) to choose the confounders and to avoid over-adjustment of the model. We used the dagitty tool - www.dagitty.net15. Briefly, a DAG is a graphical tool that enables the visualization of the relationships between the exposure of interest, the outcome being studied, and all other variables that are associated in some way with at least two other variables in the diagram. A comprehensive review can be found in recent reviews16,17. In this model, the following confounders were selected: age, sex, CRS, ratio of arterial oxygen partial pressure to fraction of inspired oxygen (PaO2/FiO2), arterial carbon dioxide partial pressure (PaCO2), pH, renal dysfunction (Fig. 1 in Supplementary Appendix).
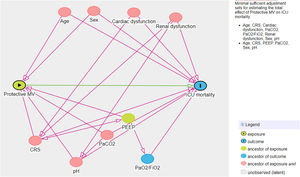
Another multivariate logistic model was performed considering non-adherence to protective MV as the independent variable of interest and ICU mortality as the dependent variable. For this analysis, another DAG was drawn and the following confounders were selected: age, sex, CRS, PaO2/FiO2, PaCO2, pH, cardiovascular and renal dysfunction (Fig. 2 in Supplementary Appendix). The same model was applied considering non-adherence to protective MV as the independent variable of interest and hospital mortality as the dependent variable.
All analyses were conducted with Stata 15.1 (Stata CorpLP, College Statio, TX, USA), and significance level was set at 0.05.
ResultsOverall 120 of 902 patients admitted to 37 Brazilian ICUs that participated in the original cohort study met the Berlin criteria for ARDS diagnosis at admission or on the first day of MV and constituted the NC-ARDS cohort. The C-ARDS cohort was constituted of 228 patients admitted to two COVID-19 dedicated ICUs (Fig. 1).

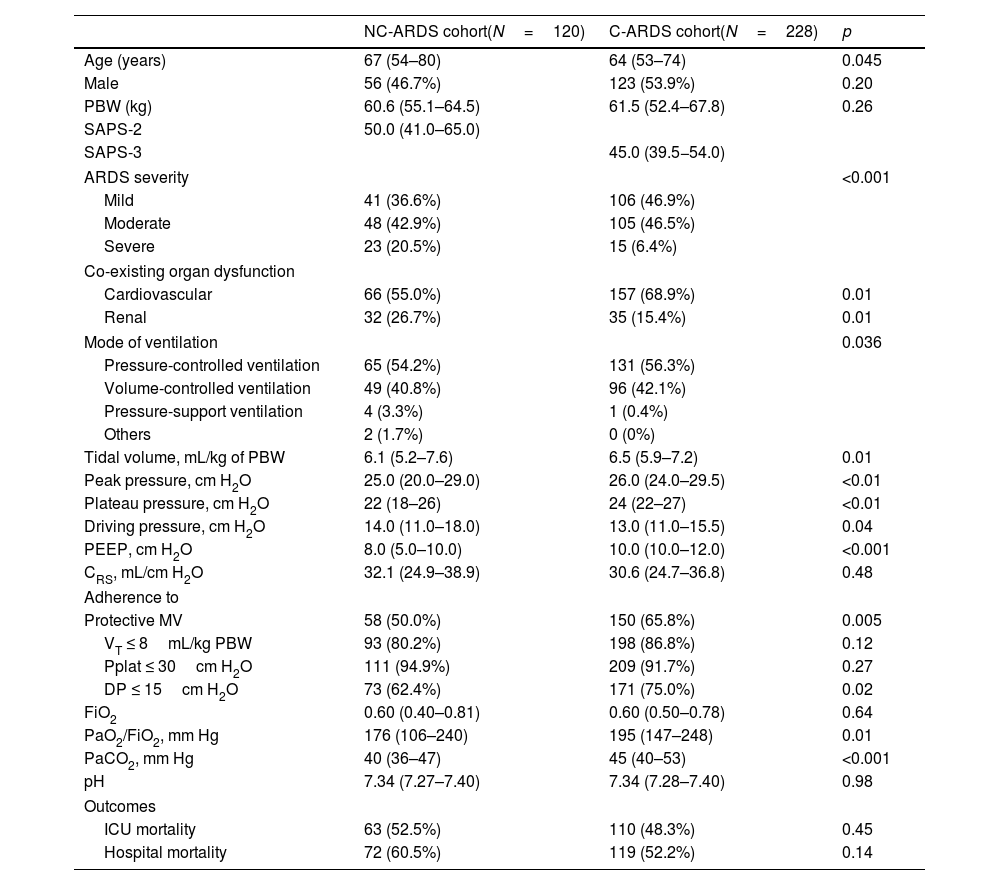
Table 1 shows demographic and clinical characteristics, and respiratory parameters on day 1 of MV in both cohorts. Patients with C-ARDS were younger and presented severe form of ARDS less frequently. At baseline, a higher proportion of patients with C-ARDS presented cardiovascular dysfunction and a lower proportion presented renal dysfunction, compared with patients with NC-ARDS. C-ARDS patients received higher VT and higher PEEP levels, they presented higher Pplat and higher PaO2/FiO2 compared with patients with NC-ARDS. C-ARDS patients presented lower DP compared with patients with NC-ARDS. Similar results were found on day 2 of MV and they are shown in Table 2 in Supplementary Appendix.
Baseline demographic and clinical characteristics, and respiratory parameters on day 1 of mechanical ventilation and outcomes in patients from NC-ARDS and C-ARDS cohorts.
| NC-ARDS cohort(N=120) | C-ARDS cohort(N=228) | p | |
|---|---|---|---|
| Age (years) | 67 (54–80) | 64 (53–74) | 0.045 |
| Male | 56 (46.7%) | 123 (53.9%) | 0.20 |
| PBW (kg) | 60.6 (55.1–64.5) | 61.5 (52.4–67.8) | 0.26 |
| SAPS-2 | 50.0 (41.0–65.0) | ||
| SAPS-3 | 45.0 (39.5−54.0) | ||
| ARDS severity | <0.001 | ||
| Mild | 41 (36.6%) | 106 (46.9%) | |
| Moderate | 48 (42.9%) | 105 (46.5%) | |
| Severe | 23 (20.5%) | 15 (6.4%) | |
| Co-existing organ dysfunction | |||
| Cardiovascular | 66 (55.0%) | 157 (68.9%) | 0.01 |
| Renal | 32 (26.7%) | 35 (15.4%) | 0.01 |
| Mode of ventilation | 0.036 | ||
| Pressure-controlled ventilation | 65 (54.2%) | 131 (56.3%) | |
| Volume-controlled ventilation | 49 (40.8%) | 96 (42.1%) | |
| Pressure-support ventilation | 4 (3.3%) | 1 (0.4%) | |
| Others | 2 (1.7%) | 0 (0%) | |
| Tidal volume, mL/kg of PBW | 6.1 (5.2–7.6) | 6.5 (5.9–7.2) | 0.01 |
| Peak pressure, cm H2O | 25.0 (20.0–29.0) | 26.0 (24.0–29.5) | <0.01 |
| Plateau pressure, cm H2O | 22 (18–26) | 24 (22–27) | <0.01 |
| Driving pressure, cm H2O | 14.0 (11.0–18.0) | 13.0 (11.0–15.5) | 0.04 |
| PEEP, cm H2O | 8.0 (5.0–10.0) | 10.0 (10.0–12.0) | <0.001 |
| CRS, mL/cm H2O | 32.1 (24.9–38.9) | 30.6 (24.7–36.8) | 0.48 |
| Adherence to | |||
| Protective MV | 58 (50.0%) | 150 (65.8%) | 0.005 |
| VT ≤ 8mL/kg PBW | 93 (80.2%) | 198 (86.8%) | 0.12 |
| Pplat ≤ 30cm H2O | 111 (94.9%) | 209 (91.7%) | 0.27 |
| DP ≤ 15cm H2O | 73 (62.4%) | 171 (75.0%) | 0.02 |
| FiO2 | 0.60 (0.40–0.81) | 0.60 (0.50–0.78) | 0.64 |
| PaO2/FiO2, mm Hg | 176 (106–240) | 195 (147–248) | 0.01 |
| PaCO2, mm Hg | 40 (36–47) | 45 (40–53) | <0.001 |
| pH | 7.34 (7.27–7.40) | 7.34 (7.28–7.40) | 0.98 |
| Outcomes | |||
| ICU mortality | 63 (52.5%) | 110 (48.3%) | 0.45 |
| Hospital mortality | 72 (60.5%) | 119 (52.2%) | 0.14 |
Categorical variables expressed as n (%), continuous variables expressed as median (IQR).
ARDS: acute respiratory distress syndrome; CRS: compliance of the respiratory system; DP: driving pressure; FiO2: fraction of inspired oxygen; ICU: intensive care unit; IQR: interquartile range; MV: mechanical ventilation; PaCO2: arterial carbon dioxide partial pressure; PaO2/FiO2: ratio of arterial oxygen partial pressure to fraction of inspired oxygen; PBW: predicted body weight; PEEP: positive end expiratory pressure; Pplat: plateau pressure; SAPS: simplified acute physiology score.
Organ dysfunction defined by a score of 2 points or more in the respective domain of the sequential organ failure assessment (SOFA).
Numbers and percentages of missing data, and their distribution across both cohorts are shown in Table 1 in Supplementary Appendix.
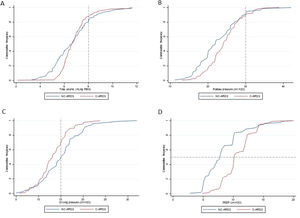
Protective MV, as defined by the three parameters (VT ≤8mL/kg PBW; Pplat ≤30cm H2O; and DP≤15cm H2O), was applied to 65.8% of C-ARDS patients and to 50.0% of the NC-ARDS patients (p=0.005) on day 1 of MV. VT was lower than 8.0mL/kg PBW in 86.8% in C-ARDS and in 80.2% in NC-ARDS (p=0.12) on day 1 of MV. The proportion of patients with Pplat ≤30cm H2O was 91.7% in C-ARDS and 94.9% in NC-ARDS (p=0.28), and the proportion of patients with DP≤15cm H2O was 75.0% in C-ARDS and 62.4% in NC-ARDS (p=0.02) on day 1 of MV (Table 1 and Fig. 2). Fig. 3 shows the distributions of DP and Pplat in different VT and PEEP levels. Multivariable logistic regression showed that the C-ARDS cohort was independently associated with protective MV on day 1 (Table 2).
, plateau pressure, cm H2O (B); driving pressure, cm H2O (C); positive end expiratory pressure, cm H2O (D). Vertical dotted lines represent the respective cutoffs for tidal volume, plateau pressure and driving pressure. Horizontal dotted line represents the median of applied PEEP.")
Ventilatory parameters on the first day of mechanical ventilation in C-ARDS and NC-ARDS patients.
Cummulative frequency distribution of tidal volume, mL/kg PBW (A), plateau pressure, cm H2O (B); driving pressure, cm H2O (C); positive end expiratory pressure, cm H2O (D). Vertical dotted lines represent the respective cutoffs for tidal volume, plateau pressure and driving pressure. Horizontal dotted line represents the median of applied PEEP.
 and driving pressure, cm H2O (B). Distribution of PEEP, cm H2O against plateau pressure, cm H2O (C) and driving pressure, cm H2O (D). Dotted lines represent the respective cutoffs for each variable. ARDS: acute respiratory distress syndrome; C-ARDS: COVID-19 acute respiratory distress syndrome; NC-ARDS: acute respiratory distress syndrome from other etiologies; PEEP: positive end expiratory pressure; PBW: predicted body weight.")
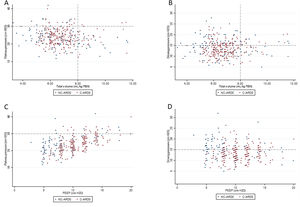
Distribution of ventilatory parameters on the first day of mechanical ventilation in C-ARDS and NC-ARDS patients.
Distribution of tidal volume, mL/kg PBW against plateau pressure, cm H2O (A) and driving pressure, cm H2O (B). Distribution of PEEP, cm H2O against plateau pressure, cm H2O (C) and driving pressure, cm H2O (D). Dotted lines represent the respective cutoffs for each variable.
ARDS: acute respiratory distress syndrome; C-ARDS: COVID-19 acute respiratory distress syndrome; NC-ARDS: acute respiratory distress syndrome from other etiologies; PEEP: positive end expiratory pressure; PBW: predicted body weight.
Multivariable logistic regression assessing the association between C-ARDS cohort and non-protective mechanical ventilation on day 1.
| Multivariable odds ratio (95% CI) | p | |
|---|---|---|
| C-ARDS cohort | 0.58 (0.34–0.99) | 0.047 |
| Age | 0.99 (0.98–1.02) | 0.927 |
| Female | 1.23 (0.74–2.05) | 0.419 |
| CRS | 0.93 (0.90–0.96) | <0.001 |
| PaO2/FiO2 | 1.00 (0.99–1.00) | 0.072 |
| PaCO2 | 0.97 (0.94–0.99) | 0.014 |
| pH | 1.01 (0.98–1.04) | 0.616 |
| Renal dysfunction | 1.11 (0.58–2.12) | 0.756 |
C-CARDS: acute respiratory distress syndrome due to COVID-19, CI: confidence interval, CRS: compliance of the respiratory system, PaO2/FiO2: ratio of arterial oxygen partial pressure to fraction of inspired oxygen; PaCO2: arterial carbon dioxide partial pressure.
On day 2 of MV, protective MV was applied to 67.1% of C-ARDS patients and to 42.0% of the NC-ARDS patients (p<0.001). On day 2, the proportions of patients ventilated with VT > 8mL/kg PBW or with Pplat > 30 cm H2O were similar between the two cohorts. However, 75.4% of C-ARDS patients presented DP≤15cm H2O compared to 53.9% of NC-ARDS patients (p<0.001) (Table 3, Figs. 3 and 4 in Supplementary Appendix).
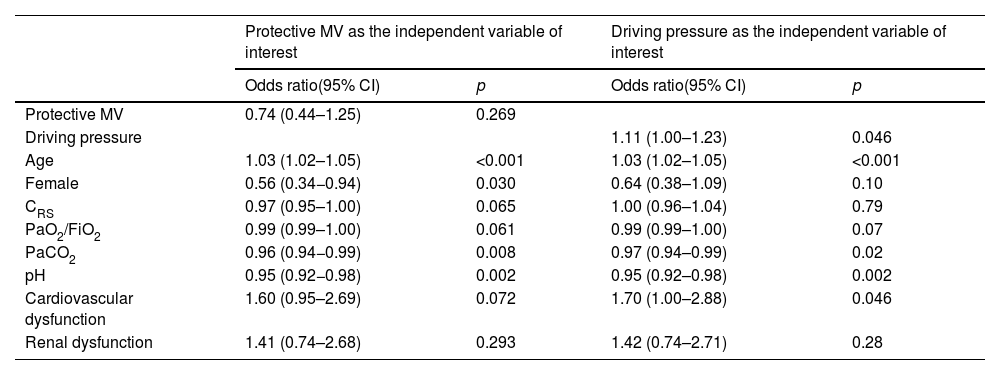
There was neither significant difference in ICU mortality between C-ARDS and NC-ARDS cohorts (48.3% vs. 52.5%, respectively, p=0.45), nor in hospital mortality (52.2% vs. 60.5%, respectively, p=0.14) (Table 1). Protective MV (VT ≤8mL/kg PBW; Pplat ≤30cm H2O; and DP≤15cm H2O) was not independently associated with lower ICU mortality (Table 3) and hospital mortality (Table 5 in Supplementary Appendix) in both cohorts. Among the individual components of the protective MV definition, there was a significant association between DP≤15cm H2O and ICU mortality (Table 3). However, there were no significant associations between VT ≤8mL/kg PBW or Pplat ≤30cm H2O and ICU mortality (Table 4 in Supplementary Appendix).
Multivariable logistic regression assessing the association between protective mechanical ventilation and driving pressure in C-ARDS and NC-ARDS cohorts, on day 1 and ICU-mortality.
| Protective MV as the independent variable of interest | Driving pressure as the independent variable of interest | |||
|---|---|---|---|---|
| Odds ratio(95% CI) | p | Odds ratio(95% CI) | p | |
| Protective MV | 0.74 (0.44–1.25) | 0.269 | ||
| Driving pressure | 1.11 (1.00–1.23) | 0.046 | ||
| Age | 1.03 (1.02–1.05) | <0.001 | 1.03 (1.02–1.05) | <0.001 |
| Female | 0.56 (0.34−0.94) | 0.030 | 0.64 (0.38–1.09) | 0.10 |
| CRS | 0.97 (0.95–1.00) | 0.065 | 1.00 (0.96–1.04) | 0.79 |
| PaO2/FiO2 | 0.99 (0.99–1.00) | 0.061 | 0.99 (0.99–1.00) | 0.07 |
| PaCO2 | 0.96 (0.94−0.99) | 0.008 | 0.97 (0.94–0.99) | 0.02 |
| pH | 0.95 (0.92−0.98) | 0.002 | 0.95 (0.92–0.98) | 0.002 |
| Cardiovascular dysfunction | 1.60 (0.95–2.69) | 0.072 | 1.70 (1.00–2.88) | 0.046 |
| Renal dysfunction | 1.41 (0.74–2.68) | 0.293 | 1.42 (0.74–2.71) | 0.28 |
CI: confidence interval, CRS: compliance of the respiratory system; MV: mechanical ventilation, PaO2/FiO2: ratio of arterial oxygen partial pressure to fraction of inspired oxygen; PaCO2: arterial carbon dioxide partial pressure.
In this observational study, which compared two prospective Brazilian cohorts of ARDS patients (C-ARDS and NC-ARDS), we found that a greater proportion of patients with C-ARDS received protective MV, compared with NC-ARDS patients. Multivariable analysis showed that the C-ARDS cohort was independently associated with protective MV. The higher adherence to protective MV in the C-ARDS cohort occurred mainly due to a higher proportion of patients with DP equal to or lower than 15cm H2O. Among the three individual components of the protective MV, only driving pressure was independently associated with ICU mortality.
The first clinical studies demonstrating that a protective MV could reduce mortality in ARDS patients were based on limiting VT and Pplat5,6. In our study, the proportion of patients with these two parameters on safe levels was similar between the two cohorts, and in accordance with recent studies in C-ADRS and NC-ARDS patients9,18,19. These findings might reflect progressive incorporation of ventilatory strategies aimed at reducing VILI throughout the last two decades, as demonstrated by Peñuelas et al. 14. These authors evaluated four cohorts of mechanically ventilated patients (1998, 2004, 2010, and 2016) and showed a significant increase in the use of protective MV over time. Moreover, they showed that 28-day mortality decreased significantly and that a lung protective strategy mediated an important fraction of the effect of temporal evolution on mortality.
More recently, DP has been considered an important ventilatory variable in the protective ventilatory strategy. Firstly, Amato et al. analyzed data from ARDS patients enrolled in previous randomized trials and demonstrated that DP was the ventilation variable best associated with mortality8. Since then, other authors have demonstrated an association between DP and mortality in ARDS patients of different etiologies10,20,21, including ARDS due to COVID-1918,22. In our study, C-ARDS patients presented lower DP than NC-ARDS patients, and a higher proportion of patients in the C-ARDS cohort presented DP equal to or lower than 15cm H2O. This difference was responsible for the higher adherence to protective MV in the C-ARDS cohort. It might have occurred due to progressive incorporation of the DP as a protective ventilatory parameter over the years that separate the two cohorts. Moreover, the C-ARDS cohort was formed with patients admitted to two COVID-19 dedicated ICUs over 18 months, i.e. patients with a single clinical condition, a fact that might have improved compliance to protective MV.
ICU and hospital mortality were similar between the two cohorts and in line with mortality rates observed in previous studies of ARDS patients due to COVID-19 or other causes9,22–25. In our analysis, the association between protective MV and ICU mortality did not reach statistical significance. When each component of the protective MV was analyzed separately, DP but not VT and Pplat was independently associated with ICU mortality. This may have occurred because most patients were ventilated with VT lower than 8mL/kg PBW and Pplat lower than 30cm H2O, leading to insufficient statistical power to detect an association between these variables and mortality. DP presented a broader distribution, especially in the NC-ARDS cohort, which may have happened because the role of DP in protective MV has been described more recently. Another possible explanation for these findings is that once DP is kept under safe levels, the importance of VT and Pplat as protective variables decreases26.
Our study has several relevant limitations. 1. The C-ARDS cohort was formed in only two COVID-19 dedicated ICUs, whereas the NC-ARDS cohort was formed in 37 ICUs from different Brazilian states. Therefore, the NC-ARDS cohort better represents the ventilatory practices in Brazil, compared to the C-ARDS cohort. 2. NC-ARDS was formed over only one month, and C-ARDS cohort was formed over 18 months, during which time adherence to protective MV may have progressively increased. 3. Ventilatory parameters were collected only on the first two days of MV and may not represent those applied during the following days. We cannot exclude the possibility that ventilatory parameters applied beyond day 2 influenced the mortality. 4. Not all clinical variables possibly associated with protective MV or mortality were collected, a fact that might have limited the precision of the DAGs that were drawn for the multivariable analyses. 5. Different disease severity scores were applied in each cohort (SAPS-3 in C-ARDS, SAPS-II in NC-ARDS), consequently they could not be compared.
In conclusion, we observed a higher adherence to protective MV among C-ARDS patients, mainly secondary to higher adherence to limiting DP. Incorporating DP in the protective MV seems to be important, since, among the three components of the protective MV, DP was the one best associated with mortality. However, to ascertain a causal relationship between DP and mortality in ARDS patients, randomized clinical trials are necessary.
Authors’ contribution- -
Erich V. Carvalho: conception and design of the study, acquisition of data, analysis and interpretation of data, literature search, drafting the article, final approval of the version to be published.
- -
Sérgio P. S. Pinto: conception and design of the study, acquisition of data, analysis and interpretation of data, literature search, drafting the article, final approval of the version to be published.
- -
Edimar P. Gomes: conception and design of the study, acquisition of data, analysis and interpretation of data, literature search, drafting the article, final approval of the version to be published.
- -
Óscar Peñuelas: conception and design of the study, analysis and interpretation of data, revising the article providing intellectual content of critical importance to the work described, final approval of the version to be published.
- -
Caio G. Stohler: acquisition of data, analysis and interpretation of data, revising the article providing intellectual content of critical importance to the work described, final approval of the version to be published.
- -
Gustavo C. Arantes: acquisition of data, analysis and interpretation of data, revising the article providing intellectual content of critical importance to the work described, final approval of the version to be published.
- -
Lucas L. Carvalho: acquisition of data, analysis and interpretation of data, revising the article providing intellectual content of critical importance to the work described, final approval of the version to be published.
- -
Roberta M. F. Oliveira: acquisition of data, analysis and interpretation of data, revising the article providing intellectual content of critical importance to the work described, final approval of the version to be published.
- -
Pedro N. Martins: acquisition of data, analysis and interpretation of data, revising the article providing intellectual content of critical importance to the work described, final approval of the version to be published.
- -
Maycon M. Reboredo: conception and design of the study, analysis and interpretation of data, drafting the article, final approval of the version to be published.
- -
Bruno V. Pinheiro: conception and design of the study, analysis and interpretation of data, drafting the article, final approval of the version to be published.
This study was supported by a National Council for Scientific and Technological Development – CNPq.
Declarations of interestNone.