


To evaluate the differences observed in ion and GAP anion determinations obtained by point-of-care (POC) blood gas versus laboratory biochemical testing, and to analyze the possible errors according to the limits of normality.
Material and methodsA descriptive, cross-sectional retrospective study was made to assess concordance between two diagnostic tests in patients admitted to the Critical Care Unit of Ourense University Hospital Complex (Spain), between July and November 2015, involving at least one coinciding biochemical test and POC determination. Patients under 18years of age were excluded.
ResultsA total of 1073 samples were analyzed. Lin's concordance correlation coefficients for sodium, potassium and chlorine were 0.87, 0.84 and 0.72, respectively. Kappa concordance of the normality limits for sodium, potassium and chlorine was 0.63, 0.74 and 0.32. The results indicated poor correlation of the anion GAP and null concordance between POC and biochemical testing, including the value corrected for albumin.
ConclusionsPoor concordance was observed between the ion values as determined by biochemistry and blood gases; the two methods are therefore not interchangeable. Kappa agreement with normality limits was good for sodium and potassium, and weak for chlorine. Possible validity was noted in orienting the classification within the ion limits, with the exception of chlorine. No agreement was recorded in relation to the anion GAP, even that corrected for albumin.
Evaluar las diferencias observadas en la determinación de los iones y del anión GAP obtenidos por gasometría (POC) y por bioquímica de laboratorio, y analizar los posibles errores en función de los límites de normalidad.
Material y métodosEstudio descriptivo transversal retrospectivo para valorar la concordancia entre dos pruebas diagnósticas de los pacientes ingresados en la Unidad de Reanimación del Complexo Hospitalario Universitario de Ourense, entre julio y noviembre de 2015, con al menos una determinación coincidente de bioquímica y POC. Se excluyeron pacientes menores de 18años.
ResultadosSe analizaron 1.073 muestras. Coeficientes de correlación de concordancia de Lin en sodio, potasio y cloro de 0,87, 0,84 y 0,72, respectivamente. Concordancia kappa de los límites de normalidad para sodio, potasio y cloro de 0,63, 0,74 y 0,32. Pobre correlación del anión GAP y nula concordancia entre el POC y el calculado por la bioquímica, incluido el corregido por albúmina.
ConclusionesConcordancia pobre entre los iones de la bioquímica y la gasometría, por lo que no son intercambiables. Concordancia kappa con los límites de normalidad buena para el sodio y potasio, y débil para el cloro. Posible validez para una orientación en la clasificación dentro de los límites de los iones, excepto para el cloro. Nula concordancia para el anión GAP, incluso el corregido por albúmina.
At European intensive care units (ICU), the daily collection of blood tests samples with diagnostic purposes goes from 40mL to 80mL,1,2 that is, one concentrate of red blood cells every 7–10days. In order to reduce these losses and waiting times, it is customary to use blood gas samples that, in shorter spans of time and with lower volumes of blood give us the acid–base balance, the levels of hemoglobin and the determination of the patient's ion concentration.
The use of quick diagnostic modalities such as point-of-care (POC) blood gas testing has several advantages when it comes to its availability and shorter timeframes since the total processing of the samples by the core laboratory can still make that results available for another 60–90min3 in urgent situations, whereas the use of blood gas testing shortens the analytical testing phase to just a few minutes. Other than time, it also minimizes preanalytical processing and the volume of blood needed to perform the test.4
The determination of hemoglobin and ions in the blood gas testing can lead to making erroneous decisions. Several studies show clinical differences between POC testing and core lab testing in the determination of hemoglobin5 and ions,6–9 although other studies find no discrepancies at all.10
The hypothesis of our study was that there are differences in the determination of the ions obtained through blood gas testing and those obtained at the core lab, and that such differences can also be seen in the anion gap. Our null hypothesis was that there were not such differences but a match between both measuring methods. That is why we tried to evaluate the differences seen in these methods and analyze all possible errors based on the cut-off values for normalcy.
When in the presence of a good match, we avoided running unnecessary tests, used smaller blood volumes, spent less money and the risks involved in the whole process of blood extraction were lower.
Patients and methodsWe designed one descriptive, cross-sectional study to assess concordance between two diagnostic tests in the determinations of the ions obtained using blood gas testing and those obtained at the core lab. We decided to conduct this study retrospectively in patients admitted at the Resuscitation Unit of the Complexo Hospitalario Universitario de Ourense, Galicia, Spain. The study protocol was coded 2016/408 and approved by the research ethics committee of Pontevedra-Vigo-Ourense. Afterwards the study was okayed by the Board of Directors of the aforementioned hospital.
The patients admitted to the Resuscitation Unit of the Complexo Hospitalario Universitario de Ourense were recruited from July through November 2015. We included patients with, at least, one simultaneous determination of ions in the blood gas and biochemical tests performed. Patients under 18 were excluded from the study. The samples were collected at the Resuscitation Unit and sent to the core lab using a pneumatic tube system.
The measurement targets were ions determined using POC and traditional biochemistry tests. The results obtained at the arterial gas testing and biochemical test were collected and then analyzed simultaneously after sending the samples to the core lab using a pneumatic tube system.
The machine used during the blood gas testing was the Siemens Rapidlab 1265 blood gas analyzer (Siemens Healthcare GmbH, Henkestr. 127, 91052 Erlangen, Germany), whereas the machine used to determine the biochemistry was the Roche cobas 6000 analyzer series including the cobas c501 and Roche cobas e601 analyzers (Roche Diagnostics International Ltd., CH-6343 Rotkreuz, Switzerland).
The following variables were collected: age, sex, cause for admission (whether traumatic or not), the APACHE II score, ions in the arterial blood testing (sodium [Na], potassium [K], chloride [Cl], HCO3, anion gap), ions in biochemistry (Na, K, Cl) and albumin.
All lab reports that documented inadequate coagulated samples or insufficient volumes were not used during the testing and considered errors in the pre-analytical testing phase. When the analytics of the patient under studied was not valid, the data collected was discarded from the study.
For the calculation of the anion gap the formula with potassium was used, which is the exact same one used by the blood gas test machine,11 and it was obtained from ions in the biochemical test and bicarbonate in the blood gas testing.
For the anion gap corrected for serum albumin the following formula was used:
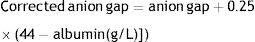
The reference biochemical values provided by the lab report for the biochemistry were: Na, 136–147; K, 3.5–5.1, and Cl, 98–110. The reference values for blood gas testing purposes were: Na, 135–145; K, 3.3–4.6, and Cl, 96–111.
For concordance analysis purposes, the Lin's concordance correlation coefficient and the Bland–Altman plot were used. Also, the kappa concordance correlation coefficients in the normalcy cut-off values were obtained. In order to estimate the size of the sample using the Bland–Altman plot, we used potassium since it has the smallest margin for error. We established a type I error of 0.01 and an 80% statistical power, a mean difference12 of −0.3, a 0.14 standard deviation and a 0.6 maximum difference between both tests which is why 1026 samples were needed. We assumed possible errors due to failing to collect 5% of the data, which led to the collection of 1077 samples. Prior to performing the statistical analyses, the normal distribution of the sample for each and every parameter under study was validated. Data were analyzed using this software: Libreoffice Calc for Linux 5.1.2.2, SPSS 15 for Windows and MedCalc 17.9 for Windows.
ResultsA total of 1077 samples were collected. Four (4) of them were excluded for a total of 1073 samples. The study sample included 152 admissions (102 men and 50 women), 22 deaths, mean APACHE II scores of 15.53±6.99 and mean age of 69.29±15.33; 38 were of traumatic origin and 114 of non-traumatic origin.
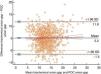
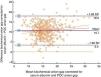
The Bland–Altman plot shows bias or systematic errors in all the parameters used. These analyses are shown from Figs. 1–5 for sodium, potassium, chloride, anion gap, and anion gap corrected for serum albumin, respectively. Table 1 shows the results from the concordance studies conducted.

Bland–Altman plot for biochemically-tested sodium vs POC tested sodium. Unit of measurement, mmol/L. Standard deviation, 2.39; mean difference, 1.22 (1.08–1.36); upper limit of the concordance correlation, 5.90 (5.65; 6.15), lower limit of the concordance correlation, −3.46 (−3.71; −3.21). Percentage analysis: mean difference, 0.87% (0.77%; 0.97%), upper limit of the concordance correlation, 4.20% (4.02%; 4.37%); lower limit of the concordance correlation, −2.46% (−2.63%; −2.28%). 95% confidence intervals. Regression line included.
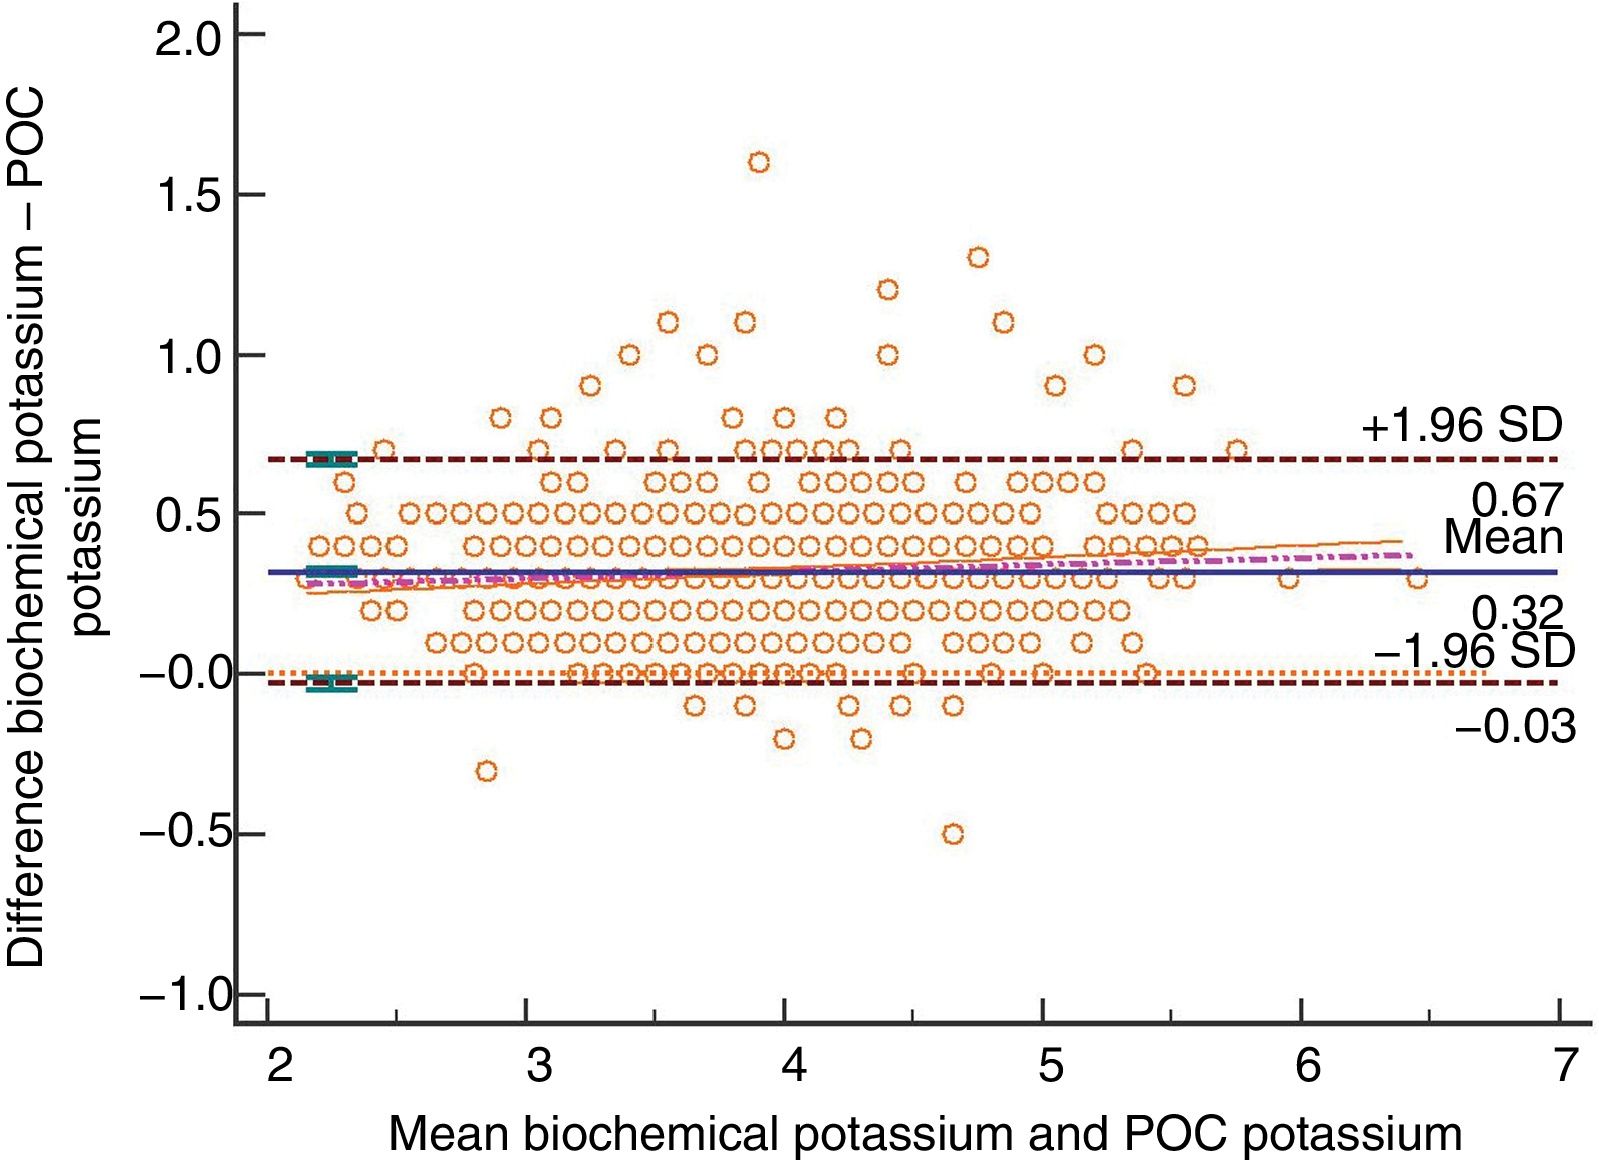
Bland–Altman plot for biochemically-tested potassium vs POC tested potassium. Unit of measurement, mmol/L. Standard deviation, 0.18; mean difference, 0.32 (0.31; 0.33); upper limit of the concordance correlation, 0.67 (0.65; 0.69); lower limit of the concordance correlation, −0.03 (−0.05; −0.01). Percentage analysis: mean difference, 8.45% (8.16%; 8.74%); upper limit of the concordance correlation, 17.91% (17.41%; 18.41%); lower limit of the concordance correlation, −1.01% (−1.51%; −0.51%). 95% confidence intervals. Regression line included.
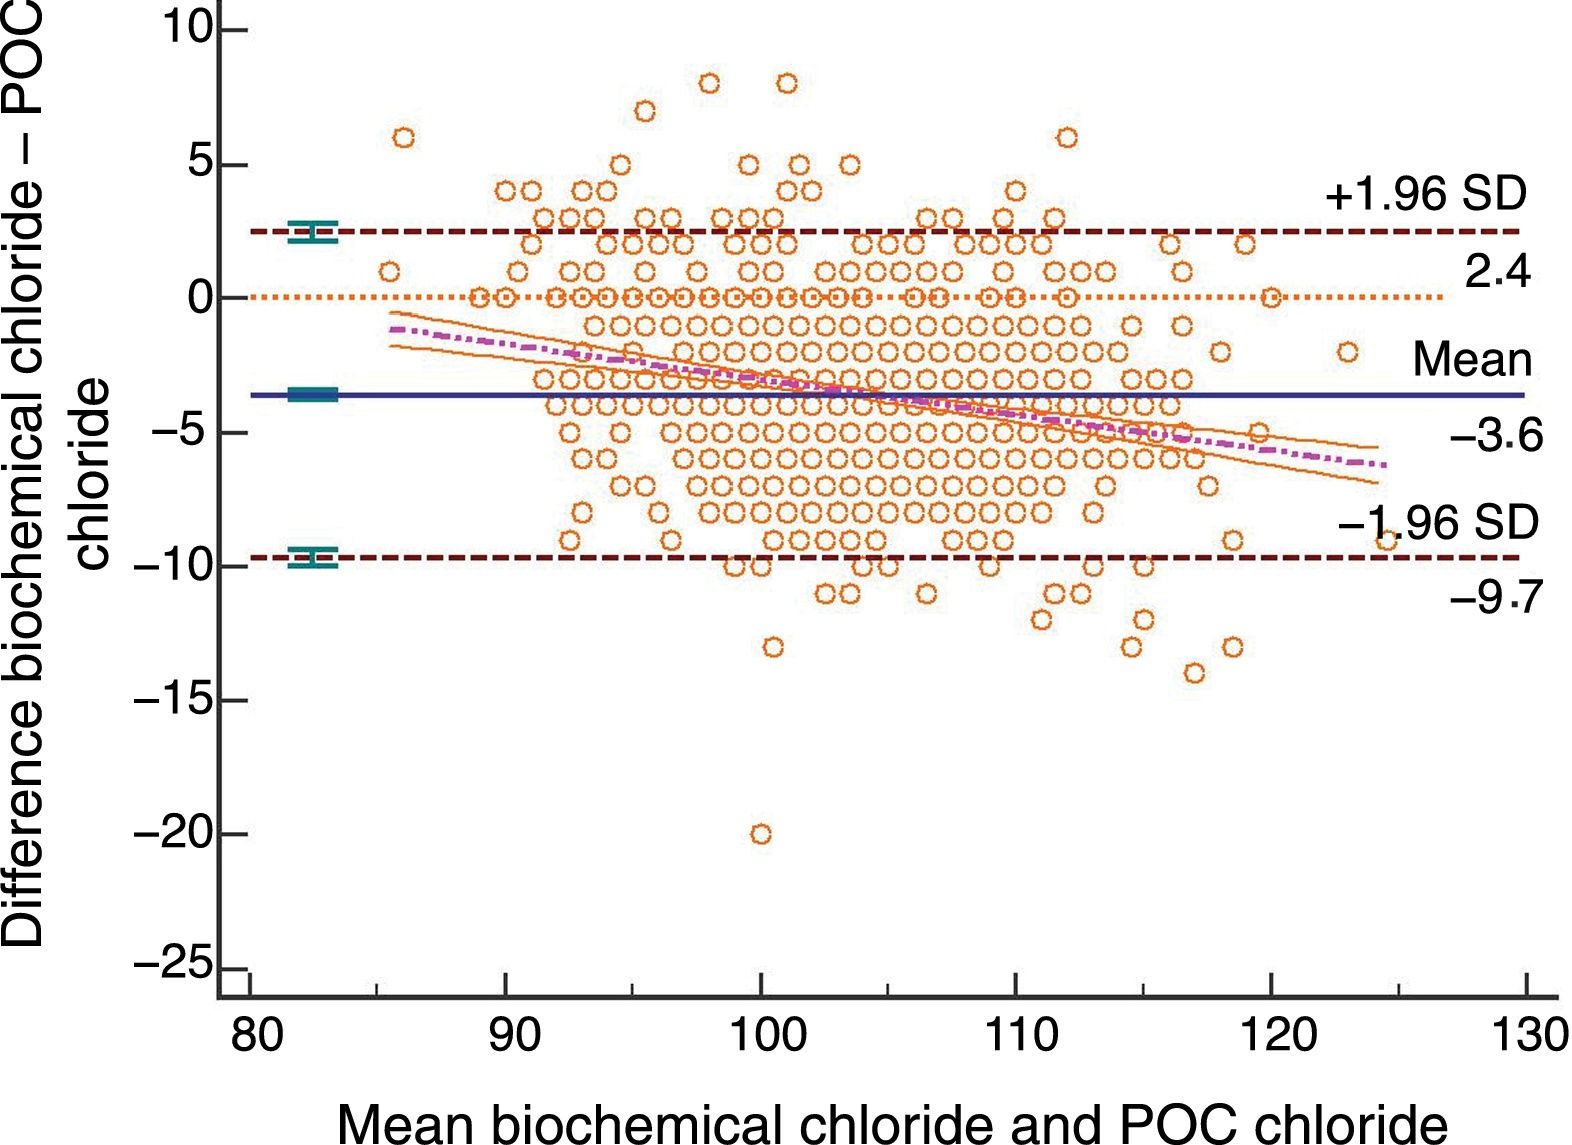
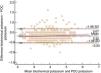
Bland–Altman plot for biochemically-tested chloride vs POC tested chloride. Unit of measurement, mmol/L. Standard deviation, 3.09; mean difference, −3.61 (−3.80; −3.43); upper limit of the concordance correlation, 2.45 (2.13; 2.77); lower limit of the concordance correlation, −9.67 (−9.99; −9.35). Percentage analysis: mean difference, −3.43% (−3.61%; −3.26%); upper limit of the concordance correlation, 2.37% (2.07%; 2.68%); lower limit of the concordance correlation, −9.24% (−9.55%; −8.93%). 95% confidence intervals. Regression line included.
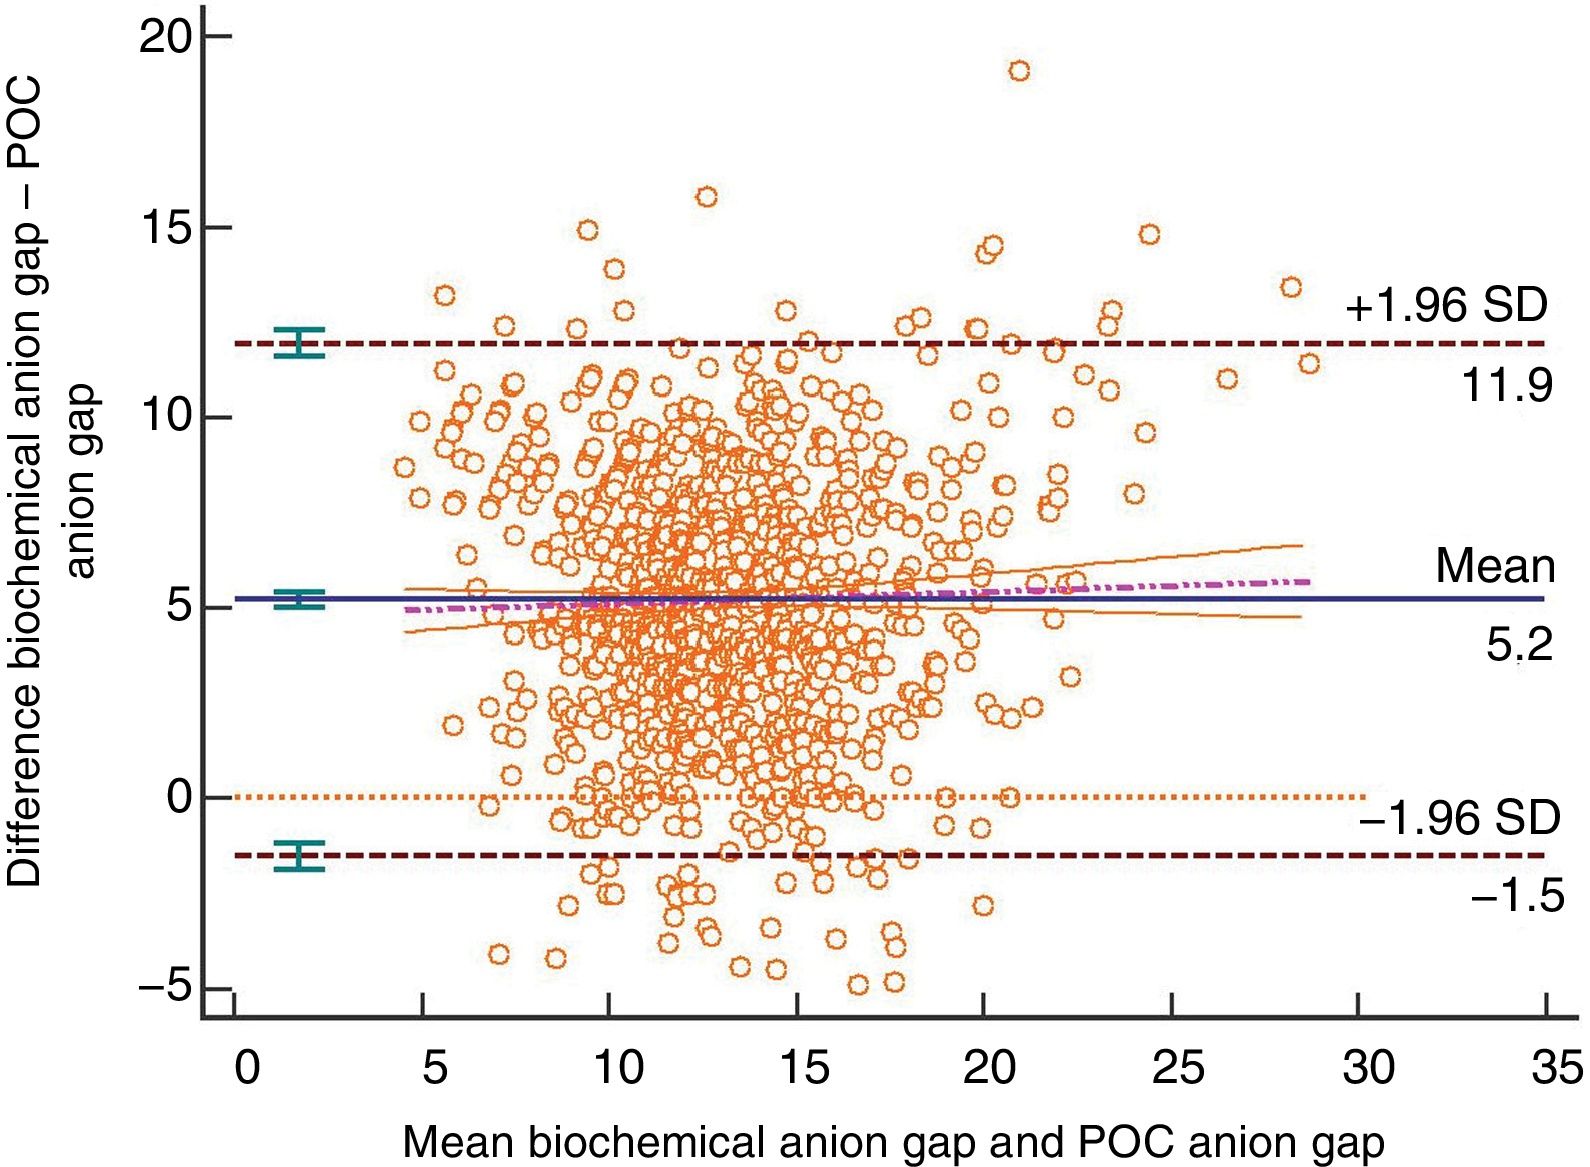
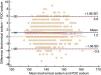
Bland–Altman plot for the biochemically-tested anion gap vs the POC tested anion gap. Unit of measurement, mmol/L. Standard deviation, 3.43; mean difference, 5.20 (4.99; 5.40); upper limit of the concordance correlation, 11.92 (11.57; 12.28); lower limit of the concordance correlation, −1.53 (−1.89; −1.17). Percentage analysis: mean difference, 42.93% (40.91%; 44.95%); upper limit of the concordance correlation, 108.81% (105.31%; 112.31%); lower limit of the concordance correlation, −22.95% (−26.45%; −19.46%). 95% confidence intervals. Regression line included.
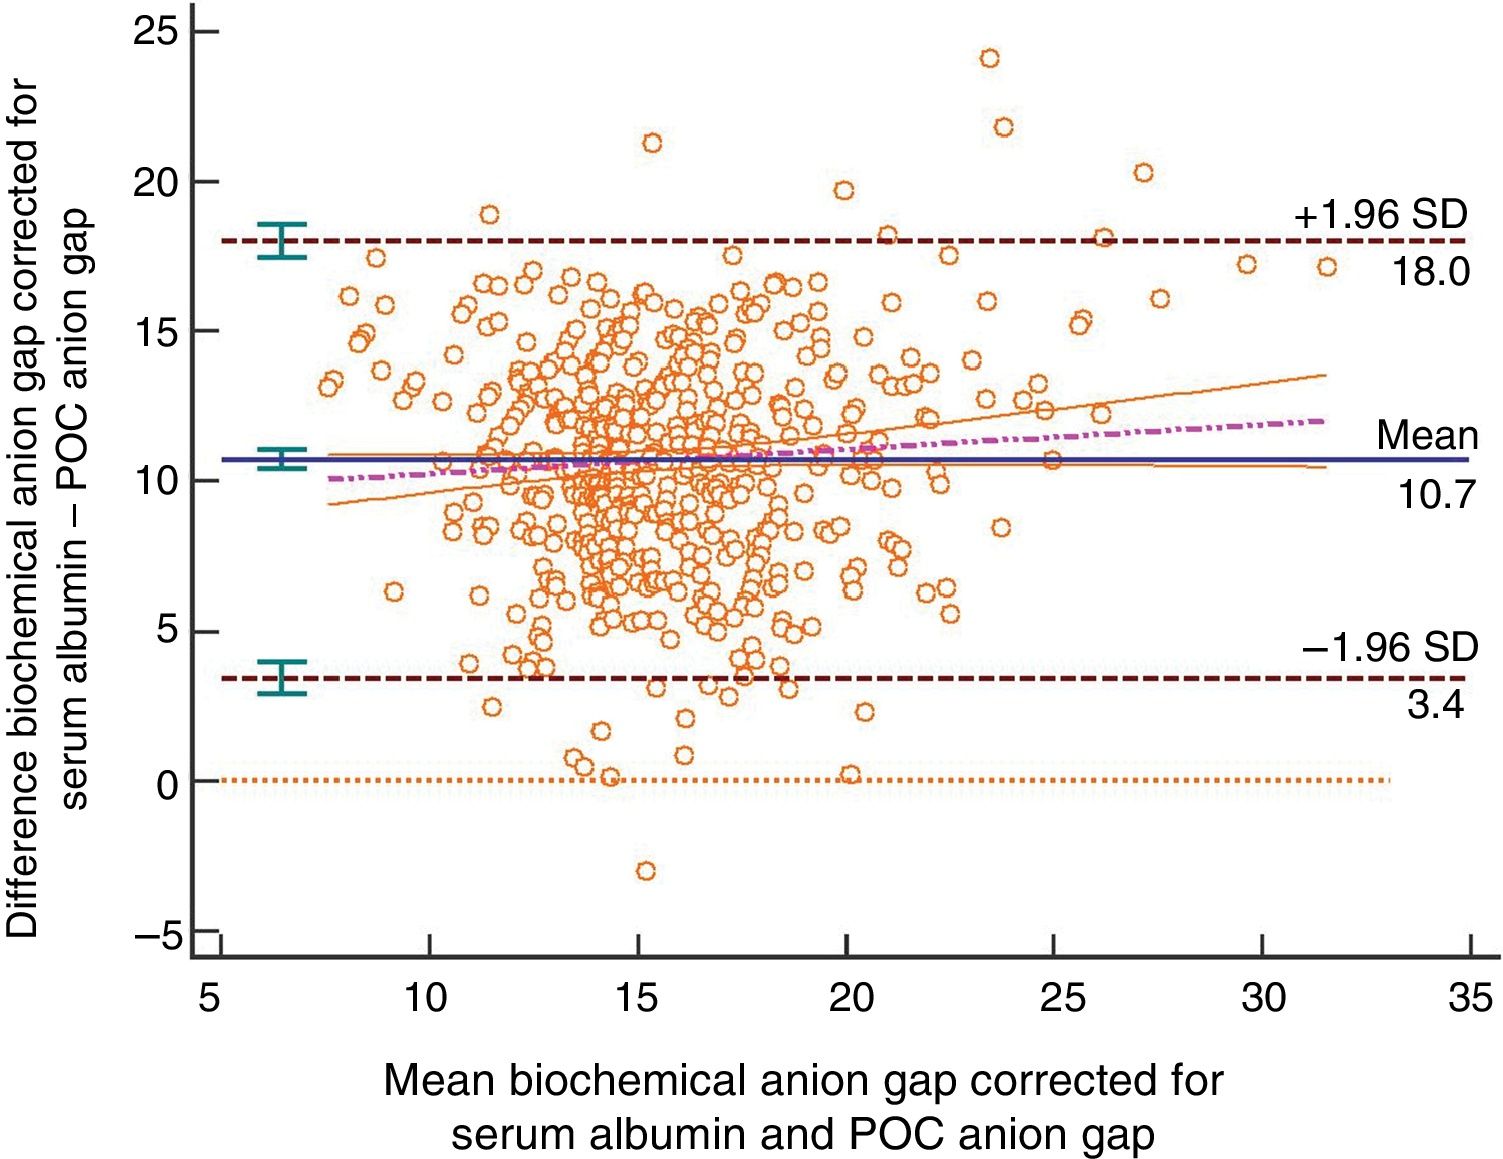
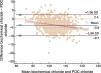
Bland–Altman plot for the biochemically-tested anion gap corrected for serum albumin vs the POC tested anion gap. Unit of measurement, mmol/L. Standard deviation, 3.72; mean difference, 10.72 (10.40; 11.04); upper limit of the concordance correlation, 18.01 (17.46; 18.57); lower limit of the concordance correlation, 3.43 (2.87; 3.98). Percentage analysis: mean difference, 71.30% (68.65%; 84.63%); upper limit of the concordance correlation, 131.49% (126.91%; 136.08%); lower limit of the concordance correlation, 11.10% (6.52%; 15.68%). 95% confidence intervals. Regression line included.
Data from the concordance studies conducted between the ions obtained through blood gas testing and biochemical testing. 95% confidence intervals shown in brackets.
| Sodium (mmol/L) | Potassium (mmol/L) | Chloride (mmol/L) | GAP (mmol/L) | Anion gap corrected for serum albumin (mmol/L) | |
|---|---|---|---|---|---|
| Number of pairs | 1.073 | 1.073 | 1.073 | 1.068 | 520 |
| Mean gas meter | 139.88 (139.56; 140.19) | 3.70 (3.66; 3.73) | 106.08 (105.71; 106.45) | 10.52 (10.30; 10.75) | 10.38 (10.06; 10.70) |
| Mean biochemistry | 141.10 (140.79; 141.41) | 4.02 (3.98; 4.05) | 102.47 (102.14; 102.80) | 15.72 (15.49; 15.95) | 21.10 (20.78; 21.44) |
| Concordance Lin | 0.87 (0.86; 0.89) | 0.84 (0.83; 0.85) | 0.72 (0.70; 0.75) | 0.30 (0.27; 0.33) | 0.11 (0.09; 0.13) |
Contingency tables according to the limits of normalcy are shown from Tables 2–6 for sodium, potassium, chloride, anion gap, and anion gap corrected for serum albumin, respectively. The Cohen's kappa coefficient13 for the limits established is good for sodium and potassium, weak for chloride, and poor both for the anion gap and the anion gap corrected for serum albumin.
Concordance of sodium values obtained through biochemical testing vs POC testing. Kappa correlation coefficient, 0.63 (0.57; 0.68) with a 95% confidence interval.
| Biochemical sodium\gases (mmol/L) | Low (<135) | Normal (135–145) | High (>145) |
|---|---|---|---|
| Low (<136) | 79 | 45 | 0 |
| Normal (136–147) | 57 | 721 | 35 |
| High (>147) | 0 | 27 | 109 |
Concordance of potassium values obtained through biochemical testing vs POC testing. Kappa correlation coefficient, 0.74 (0.70; 0.79), with a 95% confidence interval.
| Biochemical potassium\gases (mmol/L) | Low (<3.3) | Normal (3.3–4.6) | High (>4.6) |
|---|---|---|---|
| Low (<3.5) | 170 | 9 | 0 |
| Normal (3.5–5.1) | 72 | 752 | 22 |
| High (>5.1) | 0 | 6 | 42 |
Concordance of chloride values obtained through biochemical testing vs POC testing. Kappa correlation coefficient, 0.32 (0.26; 0.39), with a 95% confidence interval.
| Biochemical chloride\gases (mmol/L) | Low (<96) | Normal (96; 111) | High (>111) |
|---|---|---|---|
| Low (<98) | 55 | 155 | 0 |
| Normal (98–110) | 3 | 650 | 137 |
| High (>110) | 0 | 9 | 64 |
Concordance of anion gap values obtained through biochemical testing vs POC testing. Kappa correlation coefficient, −00.2 (−0.08; 0.03), with a 95% confidence interval.
| Biochemical anion gap\POC (mmol/L) | Low (<10) | Normal (10–20) | High (>20) |
|---|---|---|---|
| Low (<10) | 32 | 10 | 0 |
| Normal (10–20) | 441 | 460 | 2 |
| High (>20) | 5 | 112 | 6 |
Concordance of anion gap corrected for serum albumin values obtained through biochemical testing vs POC testing. Kappa correlation coefficient, −0.07 (−0.12; −0.03), with a 95% confidence interval.
| Biochemical anion gap corrected for serum albumin\POC (mmol/L) | Low (<10) | Normal (10–20) | High (>20) |
|---|---|---|---|
| Low (<10) | 0 | 0 | 0 |
| Normal (10–20) | 140 | 90 | 0 |
| High (>20) | 106 | 182 | 2 |
The best thing to do would have been to conduct one prospective study with more control measurements in order to identify all possible errors, but we believe that the methodology used and the number of samples included avoided the error of introducing assessment biases in the analysis and make it look more like an actual setting. There are several factors that cannot be controlled retrospectively, but still this allows us to have an actual picture of the results obtained during the entire process.
Working with multiple determinations per individual14 or with a heterogeneous15 number of determinations per individual can lead to bias when interpreting the results (especially when it comes to standard deviation and confidence intervals limits). We strongly believe that the state of all individuals changes while on critical care whether because they get better or worse, so we cannot expect that the inter-subject variability will be constant, which is by the way a prerequisite for the use of Bland–Altman corrected plots. That is the reason why we did not use this analytical method in our study.
When it comes to concordance, results are poor for the three3 ions, since Lin's concordance correlation coefficient is poor.16 When it comes to the Bland–Altman plot, the confidence interval of the means of the differences does not include the value zero, which is why there can be statistically significant differences between both measurements, being the results obtained from both machines not interchangeable while having a constant and proportional systematic error between both diagnostic modalities.17
Another issue here is the practical application of these results. The Bland–Altman plot analysis only defines concordance intervals but won’t tell us if these limits are clinically acceptable.18 Assuming a maximum sample discrepancy of ±5% and taking into consideration that this discrepancy may not be valid in all patients and/or situations,19 the results obtained tell us that the levels of sodium may be used interchangeably by both methods, whereas the levels of potassium or chloride should not be used interchangeably for such level of discrepancy.
Many times, it is interesting to know whether ions fall within the ranges of normalcy or not. When it comes to anomalies in the normalcy cut-off values, concordance in blood gas test machine measurements is good for both sodium and potassium but not for chloride that has a poor level of concordance. Thus, for guiding purposes we should be using the first two values.
We have low concordance with the anion gap although we did not expect that the kappa coefficient would be negative, which is indicative that here chance is more reliable than the correlation kept between both tests. The different interpretations that are possible here may complicate diagnostic guidance, but such an analysis was out of the present study. The correlation between the POC testing of the anion gap and the anion gap corrected for serum albumin showed worse results compared to the normal anion gap. In the present study we did not develop any other type of correlations such as the anion gap corrected for serum albumin and phosphate, or any other methods to know what the acid–base balance was. The results obtained for the anion gap from one method and the other are consistent with what the medical literature describes.20
The use of the pneumatic tube system can lead to a greater degree of hemolysis, especially with potassium.21 In our case, potassium was not the worst concordance found and although it was poor concordance, we did not find alterations suggestive of hemolysis.
Although it is well-known that changes in the type of heparin syringe used can alter the validity of the samples,6,22 we did not know of any changes of material and dry balanced heparin syringes were used. Although electrolyte-balanced heparin can bring systematic errors to the measurement of positive ions23 this did not seem to be the systematic error seen in our case since the worst finding of all with a negative ion is chloride.
Also, the collection of samples was not protocolized and although most blood samples were collected early in the morning, others were collected throughout the day. This may generate discrepancies in the results obtained both due to the availability of personnel and the timeframe picked for sample collection. However, and yet despite the fact that this can be interpreted as a limitation, we believe that it can also be a strength since more timeframes were covered and with more personnel than in ideal circumstances.
Most patients had one arterial IV, so the collection of the blood samples happened simultaneously. However, this was not the case with all cases whether for the lack of an arterial catheter or due to catheter malfunctioning. The extraction site and the technique used to collect the samples are shown on the lab report. This may be prone to analysis, yet we should not focus on the collection of the samples only since several academic studies10,24 also show contradictory findings on this regard.
We should bear in mind here that blood gas analyzers have several advantages added to how fast they are. They are not affected by the levels of serum protein in the measurement of electrolytes,25 and they are recommended in cases of hypoalbuminemia.26,27,25,28,29 We don’t think that the hypoalbuminemia present in critically ill patients may explain by itself the poor concordance results obtained. Sodium ion is the most widely studied parameter in medical literature with a greater difference in cases of hypoalbuminemia25,29 than the one seen in our study.
In sum, we obtained poor concordances, meaning that in our case both tests are not interchangeable. However, when it comes to the normalcy cut-off values, concordance was good for sodium and potassium and weak for chloride. This is encouraging enough to use these results for guiding purposes within the ion ranges except for chloride, although not for the value per se. There was null concordance between the POC testing of the anion gap and the biochemical testing of the anion gap.
Contributions from the authorsAngel López: study idea and design, data mining, data analysis and interpretation, manuscript draft, final approval.
Beatriz García: data mining, critical review of the intellectual content, final approval of the manuscript version presented here.
Ana Gómez: data mining, critical review of the intellectual content, final approval of the manuscript version presented here.
Laura González: data mining, critical review of the intellectual content, final approval of the manuscript version presented here.
Nerea González: data mining, critical review of the intellectual content, final approval of the manuscript version presented here.
Luis Martín: data mining, critical review of the intellectual content, final approval of the manuscript version presented here.
Gabriel Jaime: study idea, data mining, data analysis and interpretation, critical review of the intellectual content, final approval of the manuscript version presented here.
Conflicts of interestNone whatsoever.
We wish to thank the members of the Anesthesiology and Critical Care Working Group for their collaboration throughout this study.
Please cite this article as: López A, García B, Gómez A, González L, González N, Martín L, et al. Concordancia de los iones y anión GAP obtenidos mediante gasometría vs laboratorio estándar en cuidados críticos. Med Intensiva. 2019;43:521–527.