


To analyze whether frailty can improve the prediction of mortality in patients admitted to the ICU after digestive surgery.
DesignProspective, observational, 6-month follow-up study of a cohort of patients admitted to the ICU between June 1, 2018, and June 1, 2019.
SettingSurgical ICU of a third level hospital.
PatientsSeries of successive patients older than 70 years who were admitted to the ICU immediately after a surgical intervention on the digestive system. 92 patients were included and 2 were excluded due to loss of follow-up at 6 months.
InterventionsUpon admission to the ICU, severity and prognosis were assessed by APACHE II, and fragility by the Clinical Frailty Scale and the modified Frailty Index.
Main variables of interestICU, in-hospital and 6-month mortality.
ResultsThe model that best predicts mortality in the ICU is the APACHE II, with an area under the ROC curve (AUC) of 0.89 and a good calibration. The model that combines APACHE II and Clinical Frailty Scale is the one that best predicts in-hospital mortality (AUC: 0.82), significantly improving the prediction of isolated APACHE II (AUC: 0.78; Integrated Discrimination Index: 0.04). Frailty is a predictor of mortality at 6 months, being the model that combines Clinical Frailty Scale and Frailty Index the one that has shown the greatest discrimination (AUC: 0.84).
ConclusionsFrailty can complement APACHE II by improving its prediction of hospital mortality. Furthermore, it offers a good prediction of mortality 6 months after surgery. For mortality in ICU, frailty loses its predictive power, whereas isolated APACHE II shows excellent predictive capacity.
Analizar si la fragilidad puede mejorar la predicción de mortalidad en los pacientes ingresados en UCI tras una cirugía digestiva.
DiseñoEstudio prospectivo, observacional y con seguimiento a 6 meses de una cohorte de pacientes que ingresaron en UCI entre el 1 de junio de 2018 hasta el 1 de junio de 2019.
ÁmbitoUCI quirúrgica de un hospital de tercer nivel.
PacientesSerie de pacientes sucesivos mayores de 70 años que ingresaron en UCI inmediatamente después de una intervención quirúrgica sobre el aparato digestivo. Fueron incluidos 92 pacientes y se excluyeron 2 por pérdida de seguimiento a los 6 meses.
IntervencionesAl ingreso en UCI se estimó gravedad y pronóstico mediante el APACHE II, y fragilidad mediante la Clinical Frailty Scale y el modified Frailty Index.
Variables de interés principalesMortalidad en UCI, intrahospitalaria y a los 6 meses.
ResultadosEl modelo que mejor predice mortalidad en UCI es el APACHE II, con un área bajo la curva ROC (ABC) de 0,89 y una buena calibración. El modelo que combina APACHE II y Clinical Frailty Scale es el que mejor predice mortalidad intrahospitalaria (ABC: 0,82), mejorando significativamente la predicción del APACHE II aislado (ABC: 0,78; Integrated Discrimination Index: 0,04). La fragilidad es un factor predictor de mortalidad a los 6 meses, siendo el modelo que combina la Clinical Frailty Scale y el modified Frailty Index el que ha demostrado mayor discriminación (ABC: 0,84).
ConclusionesLa fragilidad puede complementar al APACHE II mejorando su predicción de mortalidad hospitalaria. Además, ofrece una buena predicción de la mortalidad a los 6 meses de la cirugía. Para la mortalidad en UCI, la fragilidad pierde su poder de predicción mientras que el APACHE II aislado muestra una excelente capacidad predictiva.
In recent years, the gradual aging of the population and improvements in healthcare have resulted in a considerable increase in the number of elderly patients admitted to Intensive Care Units (ICUs) throughout the world.
Until only a few decades ago, it was very uncommon for patients over 70 or 75 years of age to be admitted to the ICU. However, at present, age is in no way a conditioning factor for patient admission to intensive care. Indeed, it has been estimated that up to one-quarter of all patients admitted to the ICU in the United States and Europe are over 80 years of age.1
In these elderly individuals, digestive tract surgery, followed by ischemic heart disease are the most common causes of admission to the ICU according to some series.2–4 In this respect, major surgery is up to four-fold more frequent in patients over 70 years of age than in those under that age.5 Furthermore, it has been estimated that more than 60% of all surgical patients in the United States are over 65 years of age.6
In order to obtain adequate information on the expected prognosis in these patients, it is important to establish an estimate as reliable as possible of mortality – not only in short term but also in-hospital and over the longer term. The common practice in making such predictions involves the application of severity scales such as the Acute Physiology and Chronic Health Evaluation II (APACHE II) tool, which uses a logistic regression model to transform a numerical score into an estimate of the probability of in-hospital mortality at the time of patient admission to the ICU.7
Although these predictive scales usually regard patient age as an important risk factor, they do not take into account other elements such as frailty, which may play an important role in predicting outcomes in elderly patients.
At present, frailty is regarded as an age-related medical syndrome characterized by increased vulnerability to the development of disability and other adverse health events, including mortality, in the presence of an external stressor.8,9 In this regard, there is growing evidence that frailty is an important risk factor for the appearance of serious complications and mortality following major surgery.6,10–13
The present study was carried out to determine whether frailty can improve the prediction of mortality among patients admitted to the ICU following gastrointestinal surgery. We evaluated the predictive capacity of the APACHE II in relation to patient mortality in three different moments (in-ICU, in-hospital, and at 6 months), establishing comparisons with two widely validated frailty scales and with a model combining the APACHE II and frailty.
Patients and methodsA prospective, observational 6-month follow-up study was carried out in the surgical ICU of a tertiary hospital, covering the period from 1 June 2018 to 1 June 2019. The study was approved by the Research and Innovation Commission and by the Ethics Committee of the center. The patients included in the study, or their relatives, provided verbal consent to participation.
The initial cohort consisted of a series of consecutive patients over 70 years of age admitted to the ICU immediately after elective or urgent gastrointestinal surgery. Patients in the postoperative period who were admitted to the ICU from the hospital ward due to some complications (including repeat surgery) were excluded, in the same way as those subjects admitted to the ICU under end-of-life conditions and/or who died within 24 hours of ICU stay, and those failing to complete the 6-month follow-up period.
The level of severity and the prognosis upon admission were estimated using the APACHE II. This scale considers the patient history and age, as well as the diagnosis and other clinical and laboratory test parameters.7 It has been widely validated and is universally used in the critical care setting. The APACHE II estimates mortality during hospital stay secondary to the disease condition giving rise to admission to the ICU.
Evaluation of frailtyThe evaluation of frailty was made by the clinician in charge of the patient during the first hours of admission to the ICU and after obtaining informed consent to participation in the study from either the patient or the family (depending on the level of consciousness of the former). The modified Frailty Index (mFI)14 and the Clinical Frailty Scale (CFS) were used for this purpose.15
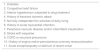
The mFI (Table 1) is based on the frailty model introduced by Rockwood in 2001.16 This model considers that frailty increases with the number of deficits accumulated by the patient in the course of his/her lifetime. The term “deficit” is taken to represent the presence of a clinical or laboratory test alteration, the loss of functional capacity, or patient worsening in the social and cognitive spheres. The model allows us to quantify frailty through a frailty index obtained as the ratio between the number of existing deficits and the contemplated total number of deficits. Thus, the values are continuous, covering a range between 0 and 1. Calculation of the original index contemplated up to 70 deficits per patient – a fact that made it difficult to apply the tool in the clinical setting. The mFI uses a smaller number of deficits, selecting 11 of those included in the original scale. It was proposed and developed by the National Surgical Quality Improvement Program of the American College of Surgeons, and was posteriorly validated in other studies.17,18
Modified Frailty Index.
| 1. Diabetes |
| 2. Congestive heart failure |
| 3. Arterial hypertension subjected to drug treatment |
| 4. History of transient ischemic attack |
| 5. Not fully independent for activities of daily living |
| 6. History of acute myocardial infarction |
| 7. Peripheral vascular disease and/or intermittent claudication |
| 8. Stroke with sequelae |
| 9. COPD or recurrent pneumonia |
| 10. History of angina and/or percutaneous coronary revascularization |
| 11. Acute encephalopathy or delirium of recent onset |
Adapted from: Searle et al.14.
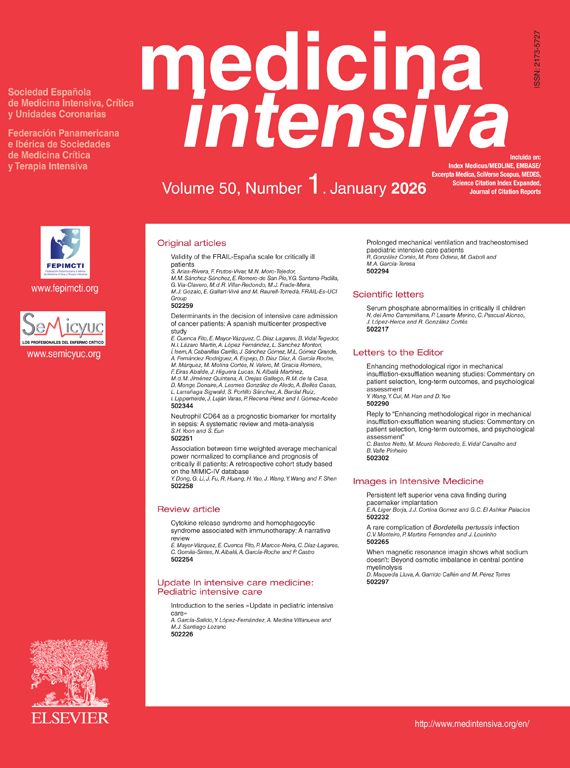
The CFS (Fig. 1) in turn evaluates frailty based on the clinical judgment of the examiner. It was proposed by Rockwood in 2005, and has shown a good correlation with the FI.19 Based on the data obtained from the case history, the physical exploration and the patient interview, the clinician classifies the patient into one of the 8 frailty levels contemplated by the scale, ranging from “in shape, robust” to “seriously frail”.8
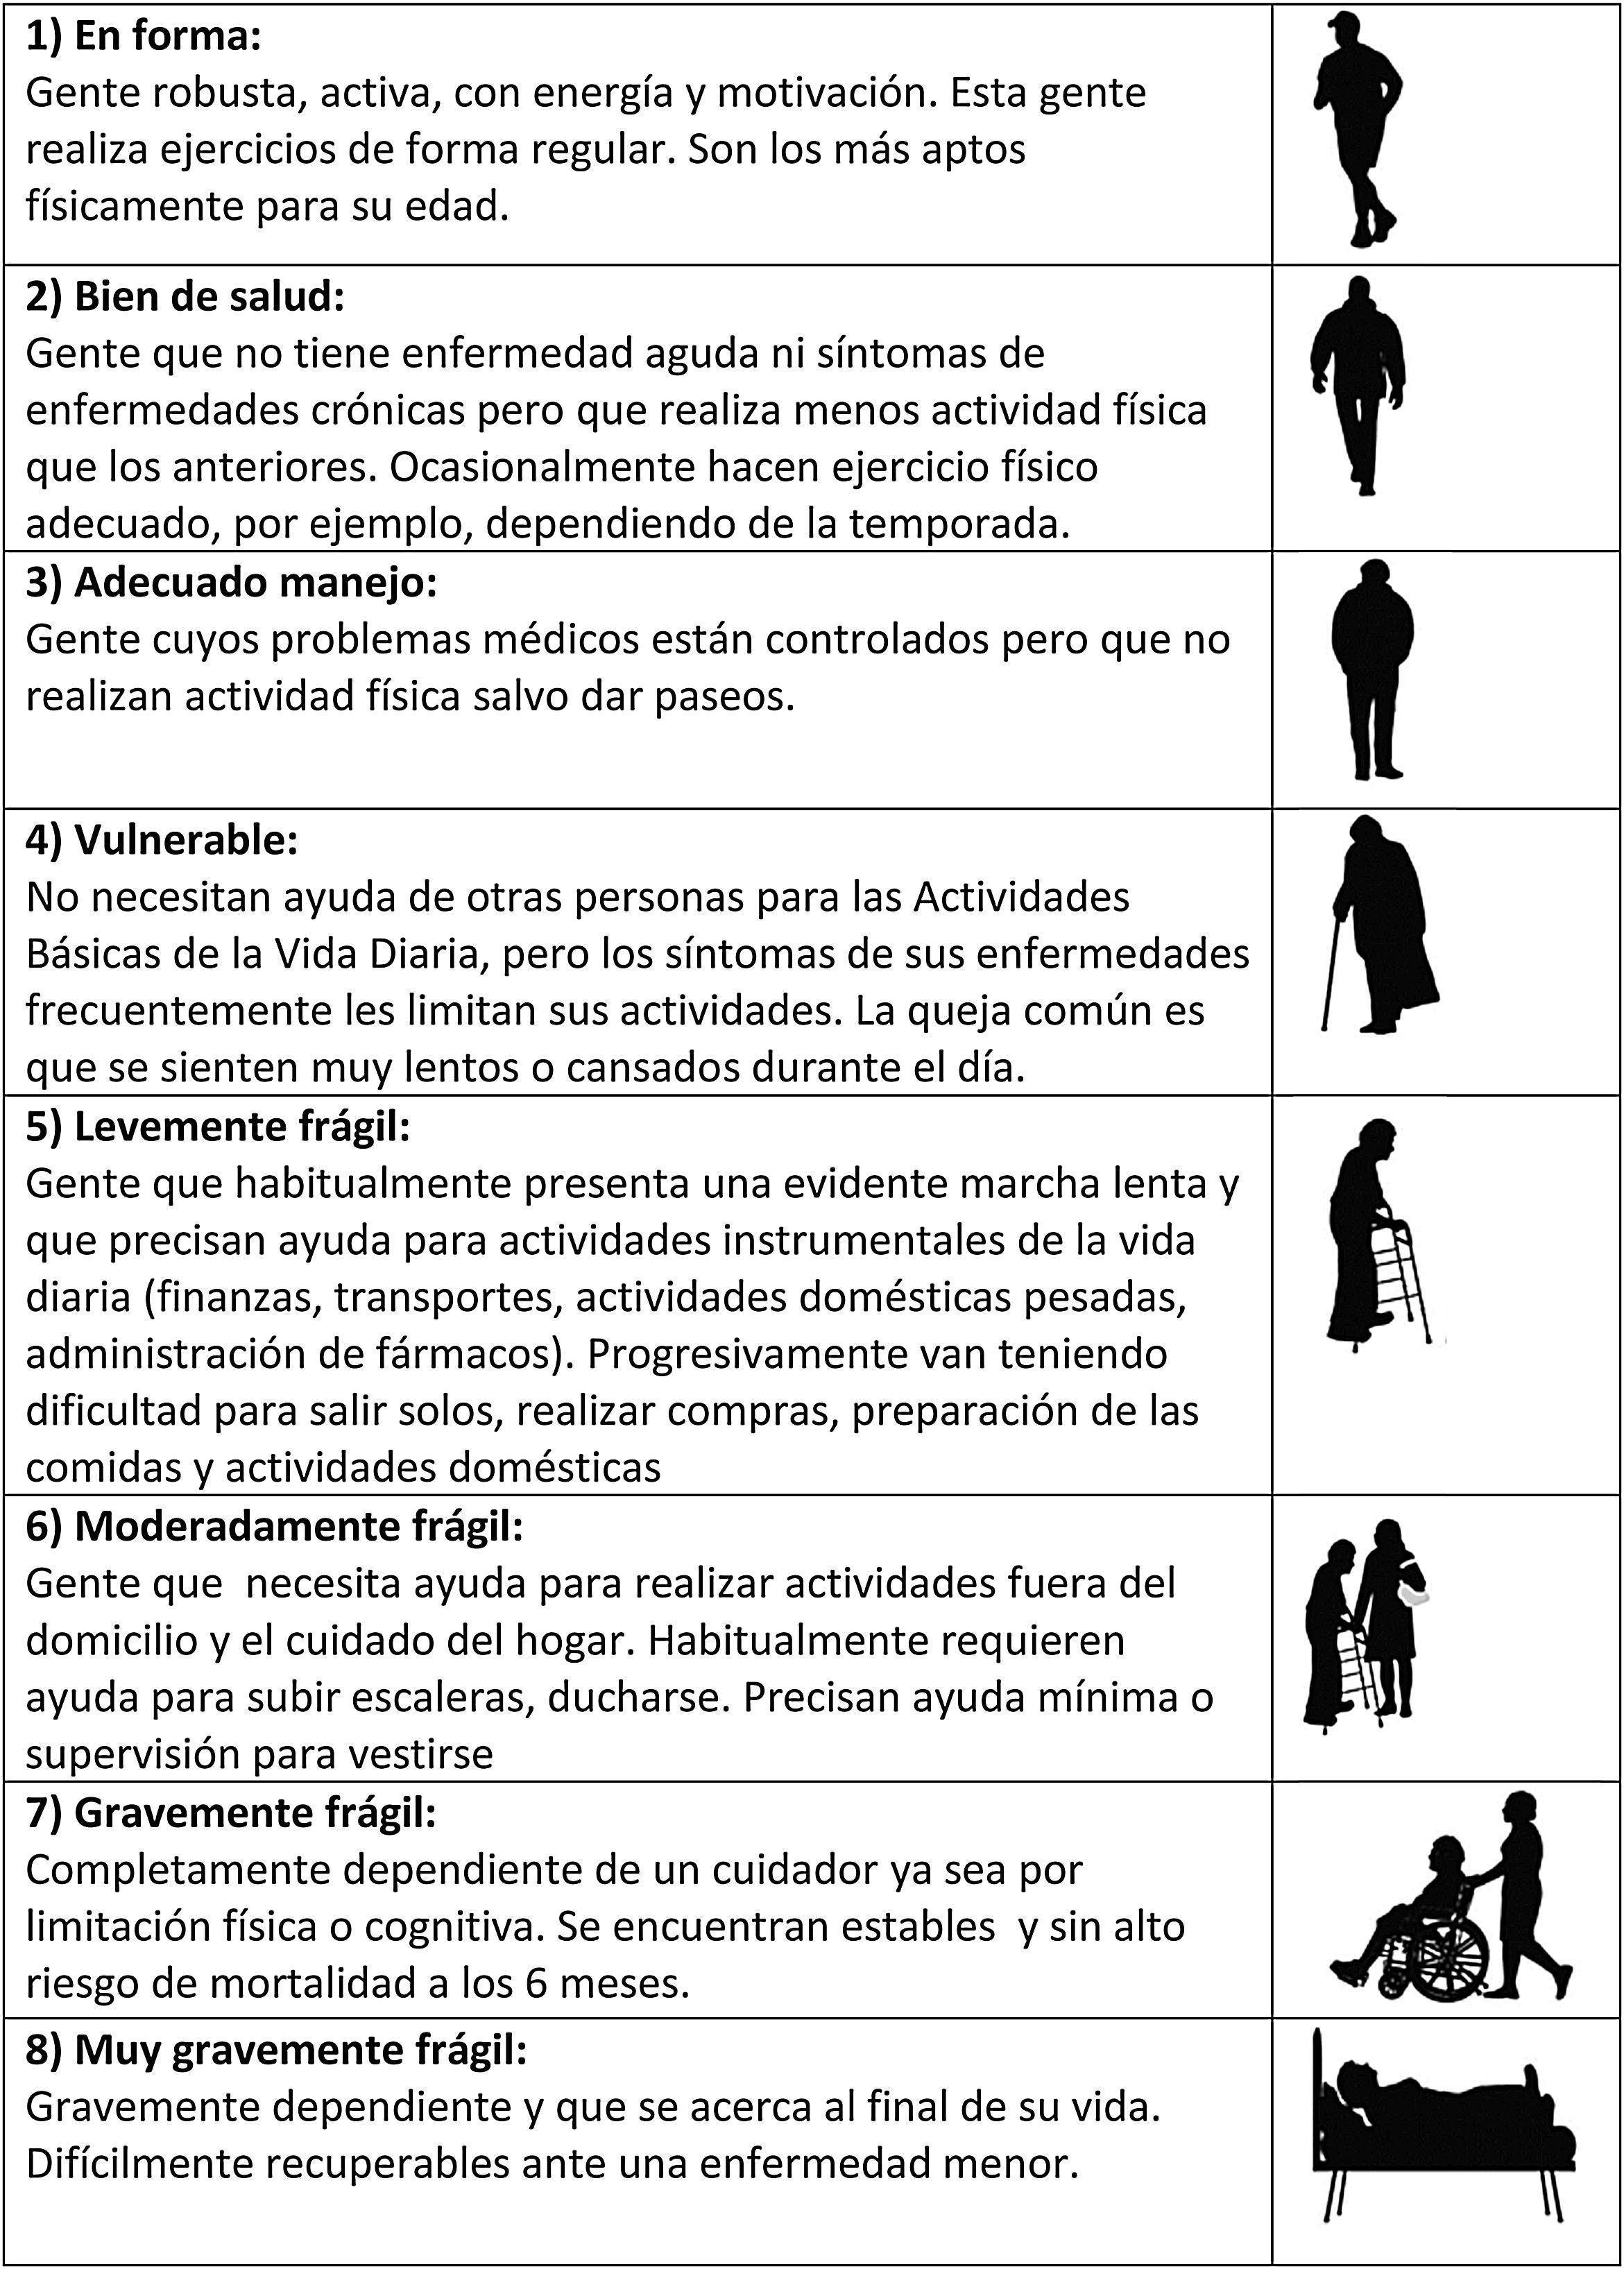
Level of frailty determined by the Clinical Frailty Scale, based on the clinical judgment of the examiner. Adapted from: Rockwood et al.15
The primary study parameter or endpoint was the incidence of mortality in three different moments: in-ICU, in-hospital, and at 6 months after the operation.
Other parametersIn addition to epidemiological parameters such as patient age and gender, we recorded clinical variables such as the nature of surgery (elective or urgent), the presence of postoperative complications (repeat surgery, readmission to the ICU) and the days of ICU and hospital stay. We also documented the need for hospital readmission and the patient situation (stable, need for a caregiver or institutionalized) at 6 months post-surgery.
Statistical analysisContinuous variables were reported as the mean and standard deviation (SD) or as the median and interquartile range (IQR), depending on whether the data presented a normal or non-normal distribution as indicated by the Shapiro-Wilk test. Categorical variables in turn were reported as absolute values and/or percentages.
Frailty was classified into three levels (frail, prefrail or robust) for each of the scales used. The mFI cut-off points corresponded to values 0-0.09 for robust patients, 0.1-0.27 for prefrail patients and 0.28-1 for frail patients. In the case of the CFS, scores of 1 and 2 corresponded to robust patients, 3 and 4 to prefrail individuals, and ≥ 5 to frail patients.8 The concordance between the two scales (CFS and mFI) in classifying the patients as frail was assessed by means of the Kappa index.
The analysis of the differences in the incidence of mortality between the different frailty levels was based on the Mantel-Haenszel linear trend test. To analyze the association of frailty to continuous variables such as age or the days of stay, we examined the presence of a linear trend between the different groups using simple linear regression models. The association of frailty to the rest of the prognostic variables was explored using logistic regression analysis, with calculation of the corresponding odds ratios (ORs) and 95% confidence intervals (95%CIs).
The predictive capacity of the different models was evaluated by assessing their calibration and discrimination using the Hosmer-Lemeshow (HL) test and the area under the receiver operating characteristic curve (AUROC), respectively. Calibration measures the concordance between the probabilities of the event observed in the sample and predicted by the model. Discrimination in turn evaluates the degree to which the model distinguishes between individuals in which the event occurs and those in which the event does not occur. The comparison of the AUROCs of the different models was made with the DeLong test. In order to determine whether the predictive capacity of the APACHE II improves significantly on adding some of the frailty measures, we used the significance of the integrated discrimination index (IDI).
The STATA/IC 15.0 statistical package (StataCorp LP, College Station, TX, USA) was used throughout. Statistical significance was considered for p < 0.05 in all cases.
ResultsA total of 92 patients were included during the study period, though two were lost to follow-up at 6 months and were excluded from the analysis. Of the 90 patients analyzed, 67 were men (74.4%). The mean and median age was 77.1 and 76 years (p25-p75: 73-82), respectively, with a range of 70-92 years.
Fifty-seven percent of the operations were elective, while the rest were carried out on an urgent basis. All the elective surgeries were tabulated as complex major operations according to the British United Provident Association and with a score of II or III according to the American Society of Anesthesiologists, and mainly corresponded to hepatobiliopancreatic (liver resection or duodenopancreatectomy) and esophageal surgery.
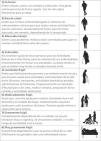
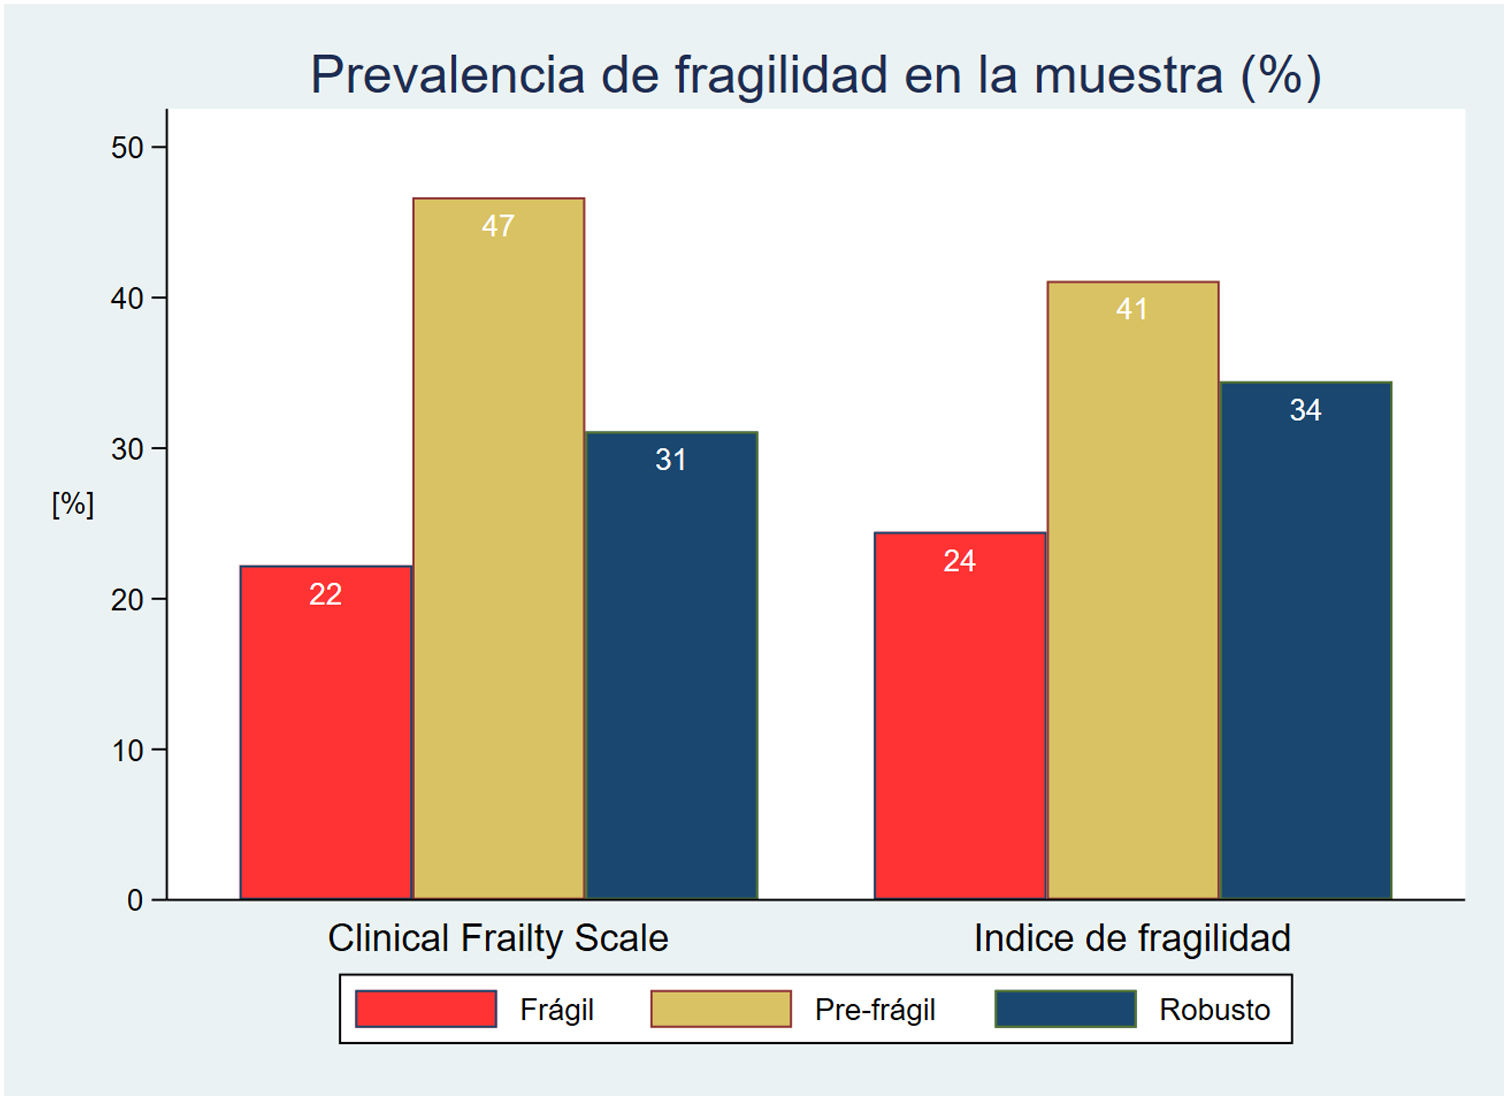
The prevalence of frailty was similar with both scales in the initial patient cohort: 22% in the case of CFS and 24% with mFI (Fig. 2). The percentage agreement in classifying the patients as frail was 77.8%, with a concordance no greater than moderate between them (kappa index 0.38).
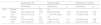
The frail patients showed a significantly higher APACHE II risk score. This linear trend was statistically significant (p < 0.01) for both frailty scales (Table 2). There was also a significant tendency towards gradually older age as frailty increased according to CFS (p < 0.01). The frail patients were also characterized by longer ICU stays than the prefrail or robust individuals.
Characteristics of the patients according to their classification by the two frailty scales.
| Clinical Frailty Scale (CFS) | Modified Frailty Index (mFI) | |||||||
|---|---|---|---|---|---|---|---|---|
| Frail | Prefrail | Robust | p | Frail | Prefrail | Robust | p | |
| N (%) | 20 (22.2) | 42 (46.7) | 28 (31.1) | 22 (24.4) | 37 (41.1) | 31 (34.5) | ||
| Age (years) | 78.5(74-82.5) | 77.5(73-82) | 74.5(72.5-77) | <0.01 | 76(73-82) | 78(73-82) | 75(72-78) | 0.26 |
| APACHE II | 20.5(17-23.5) | 14(10-21) | 9(7-12) | <0.01 | 21(15-23) | 13(10-19) | 10(8-18) | <0.01 |
| ICU stay (days) | 5(2.5-10.5) | 6(3-11) | 3(2-4.5) | 0.02 | 5(3-11) | 5(2-8) | 3(2-6) | 0.11 |
| Hospital stay (days) | 19.5(10.5-30.5) | 19(10-45) | 12(8-22) | 0.1 | 17(10-52) | 16(7-29) | 18(9-28) | 0.5 |
With regard to the postoperative course, Table 3 shows the OR of the association of the groups of frail and prefrail patients with respect to readmission to the ICU, the need for repeat surgery, or readmission in the first 6 postoperative months, using the group of robust patients as reference.
Association of the frailty scales to the need for readmission to the ICU, repeat surgery and readmission at 6 months.
| Readmission ICU | Repeat surgery | Readmission 6 months | |||||
|---|---|---|---|---|---|---|---|
| OR (95%CI) | p | OR (95%CI) | p | OR (95%CI) | p | ||
| CFS | Robust | ref. | ref. | ref. | |||
| Prefrail | 4.61 (0.94-22.72) | 0.06 | 8.82 (2.6-30.03) | <0.01 | 1.63 (0.50-5.35) | 0.42 | |
| Frail | 4.33 (0.75-25.15) | 0.1 | 11.14 (2.74-45.26) | <0.01 | 1.15 (0.27-4.96) | 0.19 | |
| mFI | Robust | ref. | ref. | ref. | |||
| Prefrail | 2.18 (0.51-9.26) | 0.20 | 1.99 (0.74-5.4) | 0.17 | 0.79 (0.26-2.44) | 0.69 | |
| Frail | 5.33 (1.22-23.3) | 0.03 | 3.68 (1.16-11.6) | 0.03 | 0.64 (0.17-2.46) | 0.52 | |
Odds ratios calculated by univariate logistic regression analysis, comparing frail and prefrail patients with the reference group (ref.).
CFS: Clinical Frailty Scale; mFI: modified Frailty Index.
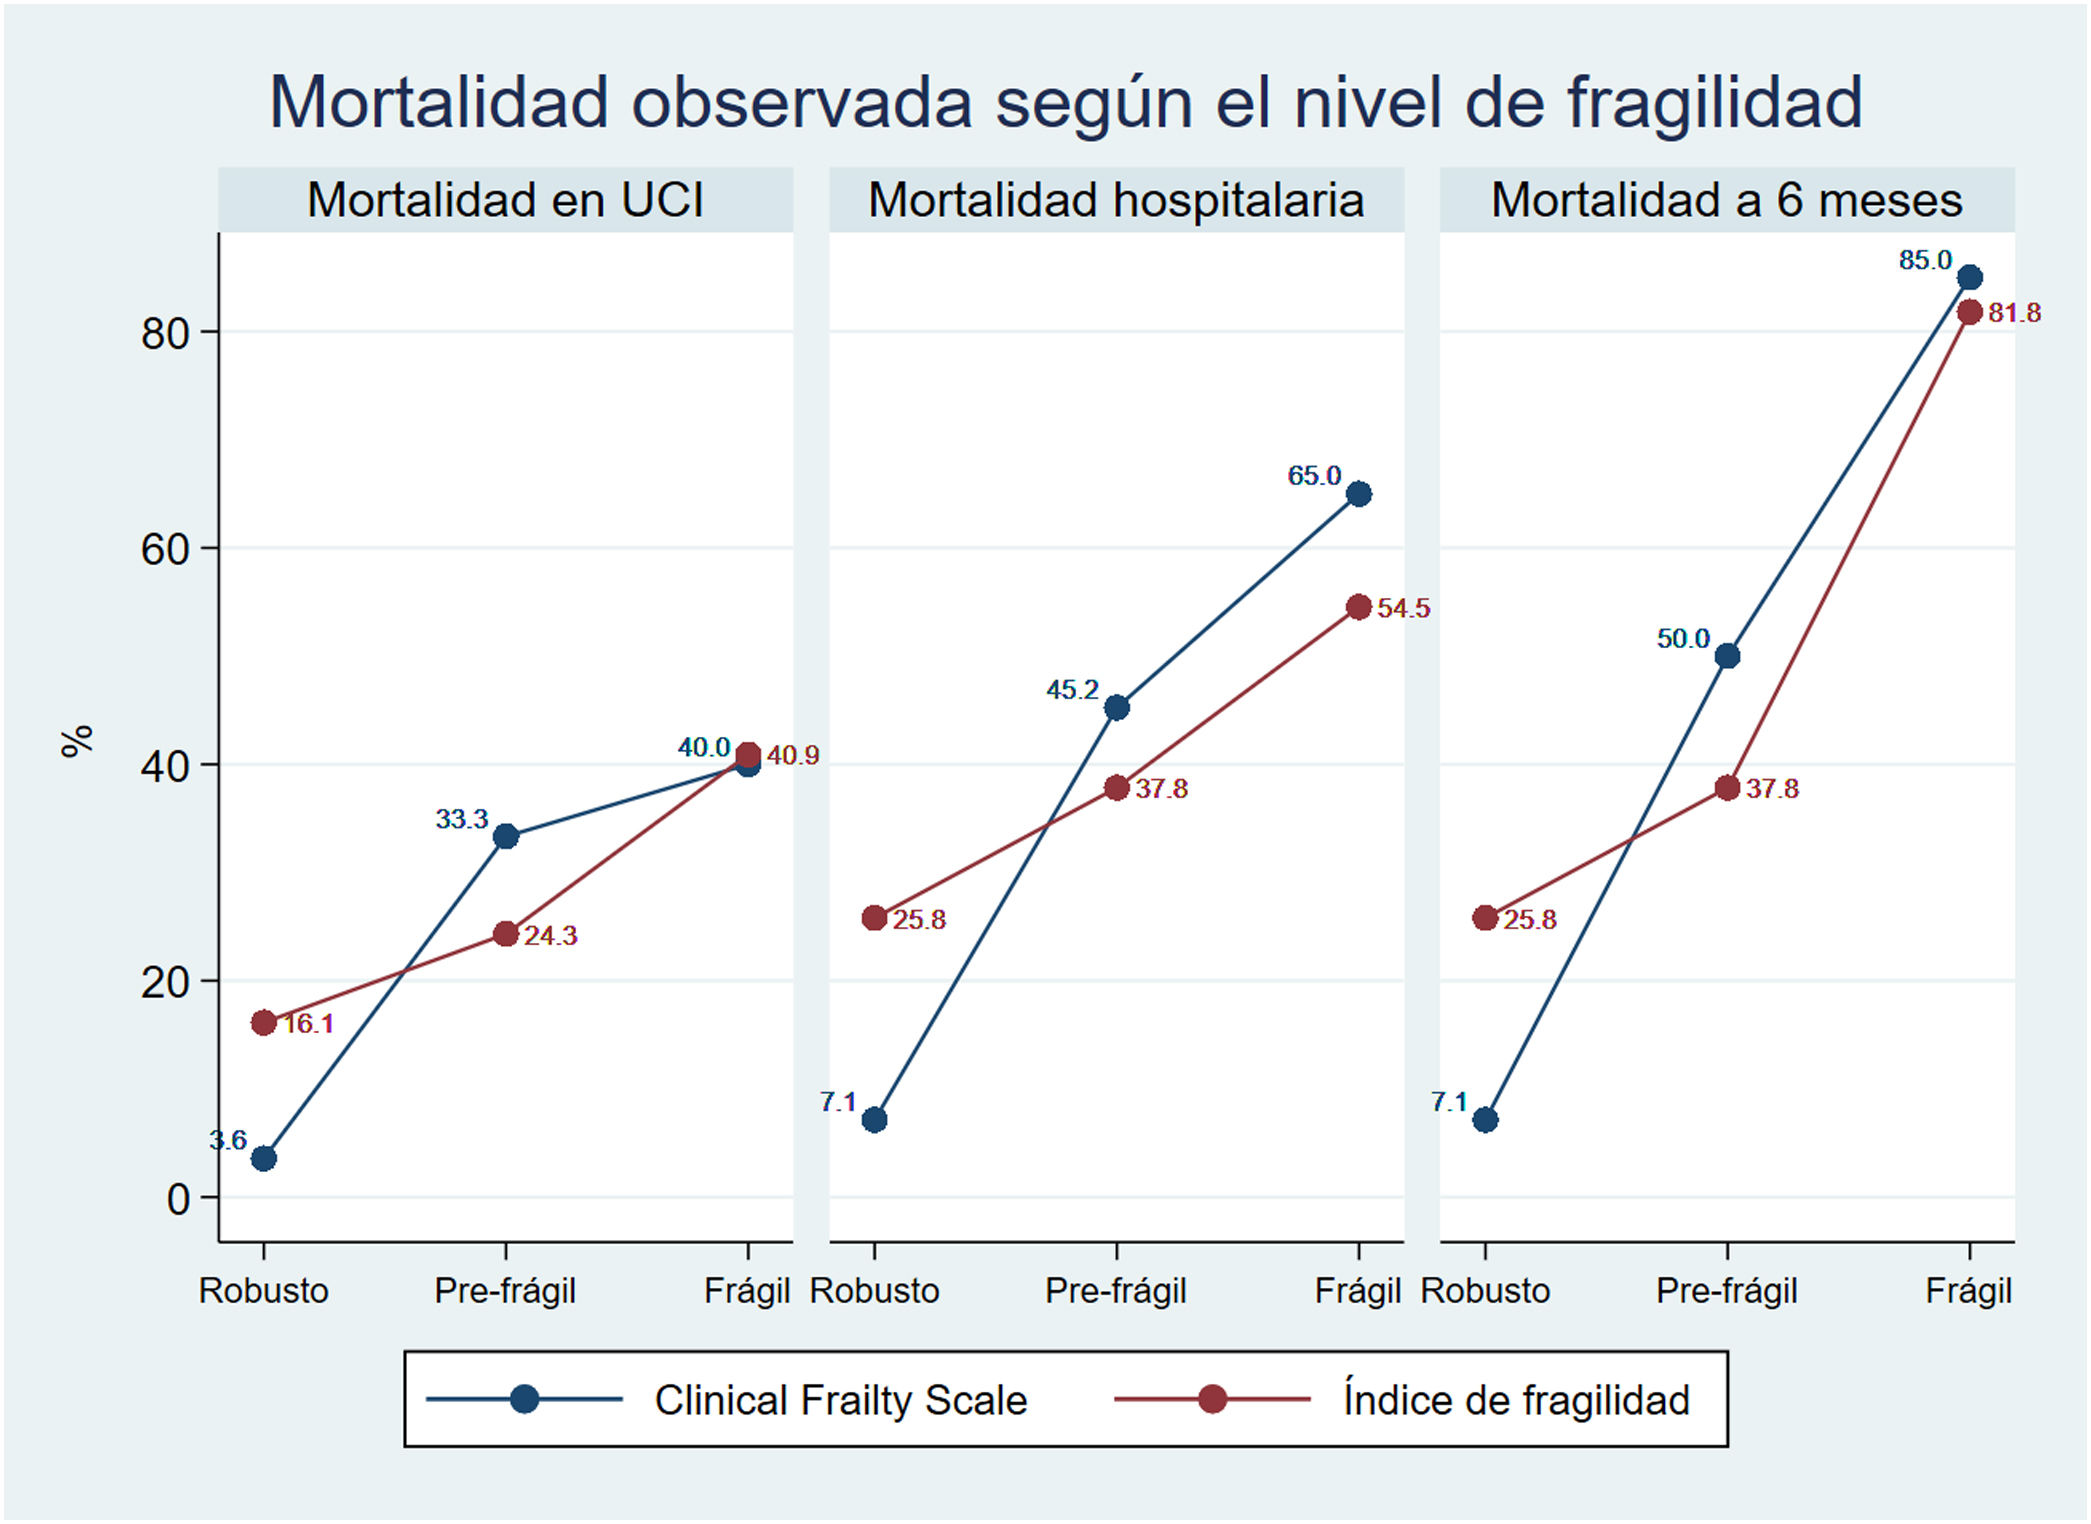
The global mortality rate was 25.5% in the ICU (23 patients), 37.7% (34 patients) in hospital, and 44.4% (40 patients) at 6 months post-surgery.
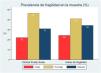
There was a clear and statistically significant linear tendency towards increased mortality with increasing frailty, both in the ICU and in hospital, as well as at 6 months of follow-up (p < 0.01) (Fig. 3).
This association between frailty and mortality was independent of the age of the patients, and remained statistically significant in the bivariate regression models adjusted for age evaluating all three mortalities, for both CFS and mFI.
Predictive capacity of the different modelsAll the analyzed models showed good calibration (HL > 0.05) for the studied episodes, with the exception of CFS (HL = 0.024) and mFI (HL 0.05) in predicting in-hospital mortality.
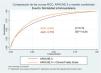
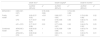
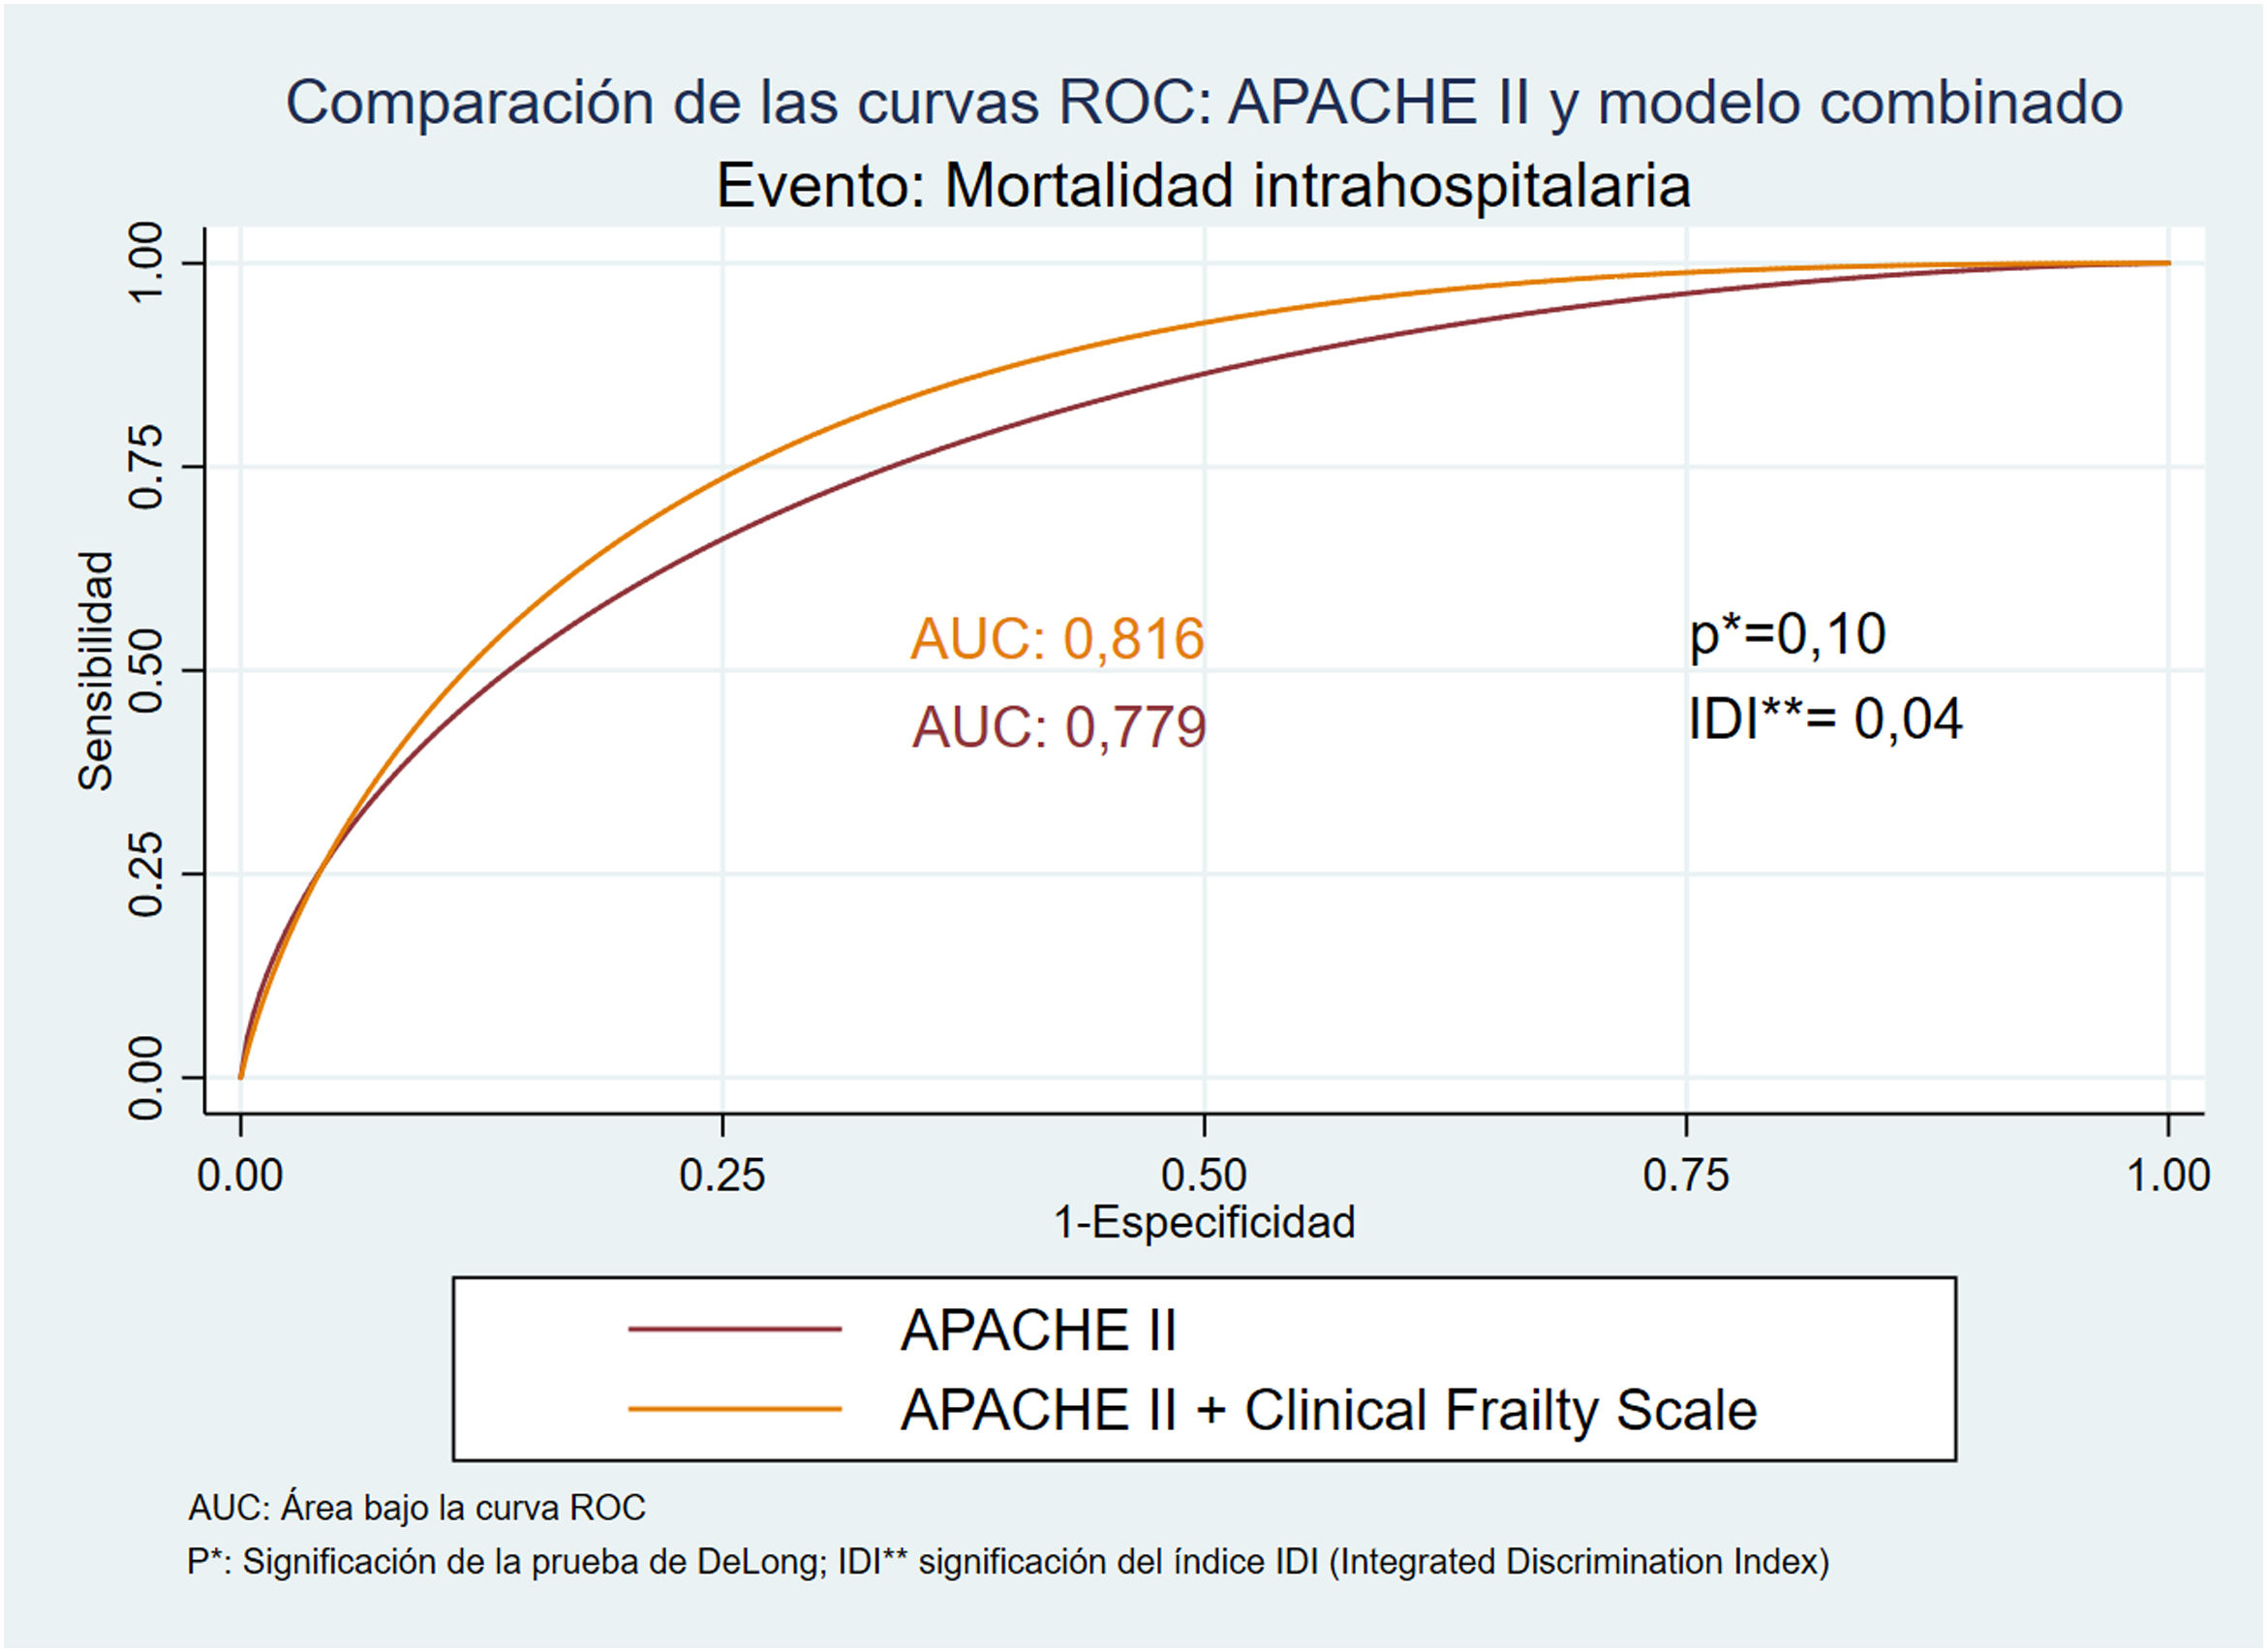
With regard to discrimination capacity, Table 4 summarizes the AUROCs corresponding to both the APACHE II and the frailty scales, and a combination of both. The comparisons used the area under the curve (AUC) of the APACHE II as reference. The model with the greatest predictive capacity regarding in-ICU mortality was the APACHE II (AUC: 0.89; HL: 0.54), while the model combining APACHE and CFS afforded the best predictive capacity in terms of in-hospital mortality (AUC: 0.82; HL: 0.21). In this model, the significance of the IDI (p < 0.05) indicates a significant improvement of the predictive capacity of APACHE II on adding the frailty scale (Fig. 4).
Comparison of the discriminating capacity (area under the ROC curve [AUROC]) of the APACHE II, CFS, mFI, and of the different models combined.
| Death ICUa | Death hospitalb | Death 6 monthsc | |||||
|---|---|---|---|---|---|---|---|
| AUROC (95%CI) | p* | AUROC (95%CI) | p* | AUROC (95%CI) | p* | ||
| APACHE II | 0.89 (0.81-0.97) | 0.78 (0.68-0.88) | 0.74 (0.63-0.85) | ||||
| Frailty model | mFI | 0.69 (0.57-0.82) | <0.01 | 0.68 (0.57-0.80) | 0.14 | 0.78 (0.69-0.88) | 0.52 |
| CFS | 0.77 (0.67-0.87) | 0.02 | 0.78 (0.68-0.87) | 0.96 | 0.82 (0.74-0.91) | 0.09 | |
| mFI + CFS | 0.77 (0.67-0.88) | 0.03 | 0.77 (0.68-0.87) | 0.93 | 0.84 (0.76-0.92) | 0.05 | |
| Combined model | APACHE + mFI | 0.89 (0.82-0.96) | 1 | 0.78 (0.68-0.88) | 0.84 | 0.83 (0.74-0.91) | 0.04 |
| APACHE + CFS | 0.89 (0.82-0.97) | 1 | 0.82 (0.73-0.91) | 0.10 | 0.83 (0.75-0.92) | 0.01 | |
AUROC: area under ROC curve; CFS: Clinical Frailty Scale; mFI: modified Frailty Index.
p*: significance of the DeLong test, comparing each model versus the reference (APACHE II).
With regard to mortality at 6 months, the combination of the two frailty scales was the model with the greatest discriminating capacity (AUC: 0.84; HL: 0.48), exceeding the predictive capacity of both the APACHE II scale and the combinations of APACHE II and frailty.
DiscussionThe results of the present study point to frailty as an important risk factor which isolatedly or in combination with the APACHE II score can improve the capacity to predict the outcomes of patients admitted to the ICU following gastrointestinal surgery.
Elderly patients represent a very heterogeneous population group in terms of physical condition, cognitive capacity, functional independence and socioeconomic circumstances. These differences allow us to subjectively estimate the biological age of the patient by adding or subtracting years from his/her true chronological age. Although such differences have always been taken into consideration in the clinical setting, only in the last decade have they been viewed more objectively thanks to the introduction of the concept of frailty.
At present, the concept of frailty has become very important, particularly on considering the increase in life expectancy and the gradual aging of the population. According to data corresponding to the year 2019 of the Spanish National Institute of Statistics (INE),20 19.1% of all Spaniards were 65 years old or older, and 6.1% were octogenarians. In turn, 55% of all hospital stays corresponded to individuals in this age range.
In the face of this situation, the evidence obtained in recent years points to frailty as an important risk factor, and identifies it as a tool that can help intensivists in decision making, thanks to its impact upon patient prognosis.21 In this regard, previous studies have postulated the use of mFI22 and CFS23 in elderly critical patients for predicting morbidity-mortality in the ICU and/or over the short term.24
In the present study we confirmed this association between frailty and mortality, both in the postoperative period in the ICU and in the in-hospital period, as well as at 6 months of follow-up. This association implies that frailty affords a mortality-predicting capacity that can complement the APACHE II scale, improving its prognostic capacity in patients of this kind.
In the present study we chose the APACHE II as a reference tool for assessing patient severity given its very widespread use in the intensive care setting throughout the world, having been validated in many scenarios and always in the critical patient setting – including elderly patients25,26 and individuals subjected to abdominal surgery.27,28 In 1985, when the APACHE II was designed, patient age was taken into account, but not so the level of frailty. However, and in accordance with the available evidence, we found the influence of frailty upon mortality to be independent of patient age. Thus, we are able to explain this complementarity between the APACHE II, which assesses patient severity, and the different frailty scales. In addition, Table 2 shows that more frail patients have higher APACHE II scores, in other words, in the presence of equivalent disease, frail patients are characterized by increased severity. This situation may be accounted for by the fact that frail individuals have a lesser physiological reserve; consequently, in the event of disease, the remaining reserve is exhausted, with early patient claudication – this in turn resulting in a higher APACHE II score.
On one hand, the APACHE II scale has shown excellent predictive capacity in relation to in-ICU mortality, since its AUROC 0.89 and good calibration outperform the frailty models. On the other hand, the combination of APACHE II with one of the frailty scales does not improve upon the predictions made by APACHE II isolatedly with respect to patient mortality.
However, on analyzing mortality over the longer term (6 months after surgery), the APACHE II loses in-ICU mortality predicting capacity, and this is when the frailty scales alone (i.e., not combined with the APACHE II) exhibit better predictive capacity. This possibly can be explained by the fact that frailty affords information on patient physiological reserve; this would justify the association between frailty and ICU stay, readmission to intensive care, the need for repeat surgery, and readmission in the first 6 months after surgery. Likewise, it must be taken into account that the APACHE II scale has not been designed to predict mortality 6 months after the event (i.e., after hospital discharge). Lastly, it has been shown that following the adoption of certain measures, frailty may improve over the middle term,29 and tends to be more stable over time than patient severity as assessed by APACHE II.
On considering in-hospital mortality, which in the strict sense is the event evaluated by the APACHE II score, which estimates the probability of death during hospital stay secondary to the cause placing patient life at risk,7 we found the model with the best predictive capacity to be the combination of APACHE II with CFS instead of APACHE II alone. This is because CSF isolatedly is characterized by an AUC similar to that of APACHE II, while the combination of both instruments increases the AUC to 0.82. Although this increase remains at the limit of statistical significance, the IDI is significant – indicating significant improvement of the discriminating capacity of APACHE II on adding frailty as a new predictor. This does not mean that APACHE II is not an adequate tool for our sample, since the observed differences between mortality as estimated by APACHE II and that recorded in the study are not statistically significant, i.e., calibration is good. However, the combined model also maintains good calibration and moreover offers greater discrimination capacity (APACHE II [AUC: 0.77] versus the combined model [AUC: 0.82]). In addition, we consider CSF to be very appropriate for estimating frailty in elderly critical patients, since it is based on clinical judgment, is simple to use, rapid and reproducible, and is used by different European intensive care societies.2,3,30 Furthermore, it is the scale proposed by the European Society of Intensive Care Medicine in the Very Old Intensive care Patients-2 study, an ongoing multicenter trial designed to develop a prognostic score for critical patients over 80 years of age.
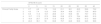
Tabulating the probability of in-hospital mortality estimated with this combined model yielded the results shown in Table 5. These probabilities are more closely adjusted to the mortality observed in our study than those estimated by the APACHE II alone. It would be interesting to conduct new studies seeking to calibrate this combined model in other populations of critical elderly patients.
Probability of in-hospital mortality estimated by the model combining APACHE II and CFS.
| APACHE II score | ||||||||||
|---|---|---|---|---|---|---|---|---|---|---|
| 0 | 5 | 10 | 15 | 20 | 25 | 30 | 35 | 40 | ||
| Clinical Frailty Scale | 1 | 2.7 | 4.6 | 7.9 | 13.2 | 21.1 | 32.1 | 45.5 | 59.6 | 72.2 |
| 2 | 4.3 | 7.4 | 12.3 | 19.9 | 30.4 | 43.6 | 57.7 | 70.6 | 80.9 | |
| 3 | 6.9 | 11.5 | 18.7 | 28.8 | 41.7 | 55.8 | 69 | 79.7 | 87.4 | |
| 4 | 10.7 | 17.5 | 27.2 | 39.8 | 53.8 | 67.3 | 78.4 | 86.5 | 91.9 | |
| 5 | 16.4 | 25.7 | 37.9 | 51.9 | 65.6 | 77.1 | 85.6 | 91.3 | 94.9 | |
| 6 | 24.3 | 36.1 | 50 | 63.8 | 75.7 | 84.6 | 90.6 | 94.5 | 96.8 | |
However, in seeking to establish a homogeneous sample of the population included in our study, the resulting sample size proved limited. In order to afford greater validity of this new model, it would be necessary to expand the evidence through more studies analyzing other disease conditions or including a larger number of patients. On the other hand, an evaluation could be made of the combination of the APACHE II scale or other severity scores with other validated frailty scales found in the literature, with the aim of developing other more precise models.
In conclusion, we consider it very important to consider frailty, and not only age, in the severity scales that predict in-hospital mortality, particularly when they are used in elderly patients. This would provide more precise information on the prognosis and in turn could contribute to therapeutic decision making.31
Authorship/collaboratorsAll authors have made a relevant contribution to the design and conduction of the study, have approved the manuscript submitted for publication, and accept responsibility for the contents of the study.
Conflicts of interestThe authors declare that they have no conflicts of interest.
Please cite this article as: Ruiz de Gopegui Miguelena P, Martínez Lamazares MT, Claraco Vega LM, Gurpegui Puente M, González Almárcegui I, Gutiérrez Ibañes P, et al. La evaluación de la fragilidad puede mejorar la predicción del APACHE II en pacientes ancianos ingresados en UCI tras cirugía digestiva. Med Intensiva. 2022;46:239–247.