


To analyze the variations in the parameters relative to active fixation electrodes at the time of implantation and over subsequent follow-up during 6 months of the acute phase of implantation.
DesignA descriptive, analytical, prospective, observational cohort study was made of consecutive cases over a period of 8 months (April–December 2010).
SettingPacing unit of an Intensive Care Unit.
Patients or participantsPatients undergoing permanent pacemaker implantation with active fixation electrodes, implanted in both atrium and ventricle. Interventions: Measurement of variables described with a threshold analyzer during electrode fixation and at different times during the study. Main compared variables: threshold, impedance and intrinsic activity (both atrial and ventricular) before and after fixation, at 48h, at one month and 6 months. Comparisons were made using the Student t-test for paired data, assuming significance for p<0.05, and ANOVA to analyze the successive changes over ambulatory follow-up.
ResultsWe analyzed 40 patients, with 19 atrial and 40 ventricular electrodes, In fixation, the electrodes showed significant variation in the impedance values of the atrial lead (1188.53±397.26 vs 610.69±326.30Ohms, p<0.0001) and ventricular lead (1512.93±718.07 vs 768.80±224.90Ohms, p>0.0001). In the first 48h it was coupled with a decrease in ventricular (0.86±0.35 vs 0.48±0.23V, p=0.0001) and atrial pacing threshold (1.10±0.39 vs 0.43±0.23V, p=0.0003), and P-wave sensing (3.61±2.25 vs 2.32±1.09mV, p=0.0463). Over follow-up, we found the parameters to be stable, with no significant changes.
ConclusionsAfter active lead fixation, a fall in impedance of the atrial and ventricular is expected. Over the next 48h improvement in atrial and ventricular threshold may occur, in contrast to the sensitivity of the intrinsic activity, which reached significance at the P wave measured after 48h. These values stabilize over patient follow-up and do not differ significantly in the studied acute patient course.
Analizar la variación de parámetros relativos al electrodo de fijación activa en el implante y seguimiento posterior durante 6 meses de fase aguda de implante.
DiseñoEstudio descriptivo, analítico, prospectivo, observacional sobre cohorte de casos suce-sivos durante 8 meses (abril-diciembre de 2010).
ÁmbitoUnidad de electro-estimulación cardiaca de un Servicio de Medicina Intensiva.
Pacientes o participantesPacientes sometidos a implante de marcapasos definitivo con elec-trodos de fijación activa, implantados en aurícula y ventrículo, Intervenciones: medición de variables descritas con analizador de umbrales durante la fijación de electrodo y en los dife-rentes momentos del estudio, Variables principales que se comparan; umbral, impedancia y actividad intrínseca tanto auricular como ventricular antes y después de la fijación del elec-trodo, a las 48 h, al mes y 6 meses de seguimiento, Se realizaron comparaciones utilizando test T-student para datos pareados; con significación si p<0,05 y un test ANOVA para analizar los cambios sucesivos del seguimiento ambulatorio.
ResultadosSe analizan 40 pacientes, 19 electrodos auriculares y 40 ventriculares, En la fijación del electrodo varía de forma significativa la impedancia del electrodo auricular (1,188,53±397,26 vs 610,69±326,30 ohmnios, p<0,0001) y ventricular (1,512,93±718,07 vs 768,80±224,90 ohmnios, p>0,0001), A las 48 h se suma una disminución del umbral de esti-mulación ventricular (0,86±0,35 vs 0,48±0,23 voltios, p=0,0001), auricular (1,10±0,39 vs 0,43±0,23 voltios, p=0,0003, onda P (3,61±2,25 vs 2,32±1,09mV, p=0,0463), En el segui-miento posterior los parámetros se estabilizan y varían de forma no significativa.
ConclusionesTras la fijación activa de electrodos es esperable una caída de impedancia del electrodo auricular y ventricular, A las 48 h pueden mejorar el umbral auricular, ventricular y en sentido contrario, la sensibilidad de la actividad intrínseca auricular. Estos valores en el seguimiento posterior ambulatorio se estabilizan y varían de forma no significativa en el periodo de evolución aguda estudiado.
Endocardial active fixation electrodes were designed in the 1980s. There is at least a patent (4311153) by Karel Smits (Medtronic), registered on 19 January 1982 and referred to retractable helix endocardial electrodes, in the United States patents office, configured as a bipolar system and including a pair of coaxial electrodes separated by an insulating layer with a helix shape at the extremity—its purpose being to secure fixation to the endocardium and reduce displacement. In this way the device was able to establish fixation positions favorable to the patient and which would not be stable with passive fixation electrodes.1,2 Over the following years, follow-up studies compared different active fixation electrodes that have demonstrated stability of the implantation parameters during prolonged periods of time, with the confirmation of equivalence among different electrode models.1,3
It is known that the pacemaker pacing impedance values afford information on the condition of the system. In this sense, a decrease in the impedance values generally may indicate a short circuit or insulation failure,4,5 while an increase can indicate fracture of the pacemaker electrode.6,7 An aspect much more closely related to the purpose of the present study is the relationship described between the impedance values and the level of fixation of the electrode in the endomyocardial tissue.8,9
It is generally accepted that changes in impedance associated to cardiac pacing are complex and multifactorial phenomena that largely reflect the conditions referred to interactions at the electrode–tissue interface. Descriptions have been made10 of the variations in impedance values registered in experimental studies in porcine and human hearts with different locations of the electrode and measurement methods. In this context, during implantation, different levels of fixation and penetration of the helix in the tissues are accompanied by variations in the levels of impedance. As a result, impedance value and variation can supply data complementing the information obtained from the current techniques (fluoroscopy, for example)—yielding data referred to fixation of the electrode.11,12 Other methods can also be incorporated to confirm good contact and fixation of the electrode, such as the injury current in the intracavitary electrogram.13 In the human heart, the tissue enveloping the electrode tip is associated to an increase in impedance, and it is more likely for this to happen in the right atrium, while penetration is more likely in the right ventricle, and manifests in the form of a decrease in measured impedance.8 During the electrode fixation process, impedance is the parameter showing the greatest variation, and this is inherent to the electrode design. Both the helix and ring are active parts of the circuit, and therefore when measurement is made only with the ring (retracted helix), the circuit is incompletely closed; as a result, the circuit has greater resistance or impedance, though the contact suffices to obtain valid threshold and sensing values. High impedance values before extracting the helix, and a decrease in impedance after extraction, are completely normal and expectable.
Patients and methodsA prospective, analytical, descriptive observational successive case cohort study was made covering a period of 8 months (April–December 2010).
Study subjects: Consecutive patients subjected to the implantation of a definitive pacemaker with active fixation electrodes implanted in the atrium and ventricle. The implanting team consisted of four intensivists in charge of all the activities related to cardiac electrostimulation.
The study was designed to determine whether there is significant variation in the active fixation electrode implantation parameters at the time of implantation and posteriorly during follow-up of the device both immediately and over the middle term after the acute implantation phase. The working hypothesis was that the only parameter to significantly change on an immediate basis in the electrode active fixation process is impedance, although the threshold undergoes variations in the first hours that usually coincide with improvement of the threshold as measured in the operating room after 48h.
The measured study variables were the electrode implantation parameters: A/V impedance, R/P wave and A/V threshold. These parameters were measured when it was considered that the fluoroscopic position of the electrode was adequate. We recorded the mean of two consecutive values for each variable. If the parameters were found to be optimum, the electrode was fixed by rotating the distal tip of the electrode as many times as had been previously found to be necessary to extract the distal helix. Following the fixation procedure, in one same location we again measured all the parameters to check their variation and obtain information referred to correct positioning. These variables, with the corresponding external programmer, were again measured 48h after implantation, generally coinciding with patient discharge home or discharge to the hospital ward, and after one and 6 months of follow-up, in order to evaluate the stability of the parameters. The electrodes used were Flextend® model 4087 and 4088, manufactured by Guidant Corporation®; Tendril® model 1888TC, manufactured by St. Jude Medical Inc.®; and Capsurefix Novus® model 5076, manufactured by Medtronic Inc®.
A descriptive study was made of the patient population, including age, gender, location of the generator and pacing mode. The variables were expressed as numbers and percentages, and means were reported with the corresponding standard deviation—statistical significance being considered for p<0.05, with the corresponding 95% confidence interval (95%CI). An analytical study was made of the differences in parameters during the fixation procedure in the operating room, comparing the means of these values with the Student t-test for paired samples. The variables were contrasted before and after fixation at the time of implantation, as well as before fixation and after 48h. Posteriorly, and in order to analyze the evolution of the parameters during follow-up, analysis of variance (ANOVA) was performed among the post-fixation times after 48h, at one month and after 6 months.
ResultsForty patients were analyzed, with a mean age of 80.16±9.27 years. Twenty-one were males (52.5%). The generator was most often located in the left prepectoral position (33 cases, 82.5%). The generator pacing mode was DDDR in 19 cases (47.5) and VVIR in 21 cases (52.5%). The most frequent symptoms were heart failure (13 cases, 32.5%) and dizziness with syncope (12 cases, 30%). The most common electrocardiographic finding was complete atrioventricular (AV) block (12 cases, 30%). The atrial electrodes were located in the appendage (17 cases) and in the atrial free wall (2 cases). The ventricular electrodes were located in the septum in three cases, the right ventricle (RV) wall in 12 cases, and in the apex of the RV in 25 cases.
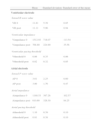
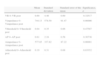
Table 1 shows the values corresponding to the period prior to fixation (“variable 0”) and after fixation (“variable post”) of the respective parameters measured at implantation, and which therefore offer direct information on the fixation process. Table 2 in turn shows the result of the comparison of the means of these variables. As can be seen, there was significant variation in the impedance values of the atrial electrode (time 0: 1188.53±397.26 vs time post-fixation 610.69±326.30Ohms, p<0.0001), as well as of the ventricular electrode (time 0: 1512.93±718.07 vs time post-fixation 768.80±224.90Ohms, p>0.0001). Significant variation of the atrial threshold value was also recorded, although to a lesser degree than in the case of impedance (time 0: 1.10±0.39 vs time post-fixation 0.91±0.38V, p<0.033).
Pre- and post-fixation electrode values.
| Mean | Standard deviation | Standard error of the mean | |
| Ventricular electrode | |||
| Sensed R wave value | |||
| VR 0 | 11.81 | 5.39 | 0.85 |
| VR post | 11.11 | 5.96 | 0.94 |
| Ventricular impedance | |||
| Vimpedance 0 | 1512.93 | 718.07 | 113.54 |
| Vimpedance post | 768.80 | 224.90 | 35.56 |
| Ventricular pacing threshold | |||
| Vthreshold 0 | 0.86 | 0.35 | 0.06 |
| Vthreshold post | 0.82 | 0.32 | 0.05 |
| Atrial electrode | |||
| Sensed P wave value | |||
| AP 0 | 3.61 | 2.25 | 0.60 |
| AP post | 3.00 | 1.76 | 0.47 |
| Atrial impedance | |||
| Aimpedance 0 | 1188.53 | 397.26 | 102.57 |
| Aimpedance post | 610.69 | 326.30 | 84.25 |
| Atrial pacing threshold | |||
| Athreshold 0 | 1.10 | 0.39 | 0.10 |
| Athreshold post | 0.91 | 0.38 | 0.10 |
Units: impedance (Ω), threshold (V), sensed intrinsic activity (mV).
0: at time 0; A: atrial chamber; AP: sensed intrinsic activity value, P measured in atrium; post: post-fixation; VR sensed intrinsic activity value, R measured in ventricle; V: ventricular chamber.
Pre- and post-fixation data comparison.
| Mean | Standard deviation | Standard error of the mean | Significance, p | |
| VR 0–VR post | 0.69 | 4.40 | 0.69 | 0.32517 |
| Vimpedance 0–Vimpedance post | 744.13 | 578.50 | 91.47 | 0.00000 |
| Vthreshold 0–Vthreshold post | 0.04 | 0.35 | 0.06 | 0.47587 |
| AP 0–AP post | 0.61 | 2.16 | 0.58 | 0.30736 |
| Aimpedance 0–Aimpedance post | 577.85 | 337.82 | 87.22 | 0.00001 |
| Athreshold 0–Athreshold post | 0.19 | 0.31 | 0.08 | 0.03352 |
Units: impedance (Ω), threshold (V), sensed intrinsic activity (mV).
0: at time 0; A: atrial chamber; AP: sensed intrinsic activity value, P measured in atrium; post: post-fixation; VR sensed intrinsic activity value, R measured in ventricle; V: ventricular chamber.
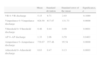
We next established comparisons between the mean values measured before fixation (“variable 0”) and at discharge from the unit (“variable discharge”), approximately 48h after implantation, thereby obtaining evolutive data referred to the first hours post-implantation. Table 3 reports the measured data, while Table 4 shows the comparative study.
Electrode values before fixation (pre-fixation) and at patient discharge from the unit.
| Mean | Standard deviation | Standard error of the mean | |
| Ventricular electrode | |||
| Sensed R wave value | |||
| VR 0 | 11.81 | 5.39 | 0.85 |
| VR discharge | 8.93 | 6.29 | 1.90 |
| Ventricular impedance | |||
| Vimpedance 0 | 1512.93 | 718.07 | 113.54 |
| Vimpedance discharge | 617.14 | 144.83 | 30.88 |
| Ventricular pacing threshold | |||
| Vthreshold 0 | 0.86 | 0.35 | 0.06 |
| Vthreshold discharge | 0.48 | 0.23 | 0.05 |
| Atrial electrode | |||
| Sensed P wave value | |||
| AP 0 | 3.61 | 2.25 | 0.60 |
| AP discharge | 2.32 | 1.09 | 0.31 |
| Atrial impedance | |||
| Aimpedance 0 | 1188.53 | 397.26 | 102.57 |
| Aimpedance discharge | 471.43 | 121.26 | 32.41 |
| Atrial pacing threshold | |||
| Athreshold 0 | 1.10 | 0.39 | 0.10 |
| Athreshold discharge | 0.43 | 0.23 | 0.06 |
Units: impedance (Ω), threshold (V), sensed intrinsic activity (mV).
0: at time 0; A: atrial chamber; AP: sensed intrinsic activity value, P measured in atrium; post: post-fixation; VR sensed intrinsic activity value, R measured in ventricle; V: ventricular chamber; Variable discharge: measurement at discharge (48h after implantation).
Comparison of electrode data before fixation (pre-fixation) and at patient discharge from the unit.
| Mean | Standard deviation | Standard error of the mean | Significance, p | |
| VR 0–VR discharge | 5.15 | 9.71 | 2.93 | 0.1089 |
| Vimpedance 0–Vimpedance discharge | 928.50 | 617.87 | 131.73 | 0.0000 |
| Vthreshold 0–Vthreshold discharge | 0.46 | 0.44 | 0.09 | 0.0001 |
| AP 0–AP discharge | 1.33 | 2.06 | 0.59 | 0.0463 |
| Aimpedance 0–Aimpedance discharge | 739.07 | 357.46 | 95.54 | 0.0000 |
| Athreshold 0–Athreshold discharge | 0.63 | 0.47 | 0.13 | 0.0003 |
Units: impedance (Ω), threshold (V), sensed intrinsic activity (mV).
0: at time 0; A: atrial chamber; AP: sensed intrinsic activity value, P measured in atrium; post: post-fixation; VR sensed intrinsic activity value, R measured in ventricle; V: ventricular chamber; Variable discharge: measurement at discharge (48h after implantation).
Of note is the significant differences recorded between ventricular electrode impedance Vimpedance 0–Vimpedance discharge (1512.93±718.07 vs 617.14±144.83Ohms, p<0.0001), ventricular pacing threshold Vthreshold 0–Vthreshold discharge (0.86±0.35 vs 0.48±0.23V, p=0.0001), sensed P wave AP0–AP discharge (3.61±2.25 vs 2.32±1.09mV, p=0.0463), atrial electrode impedance Aimpedance 0–Aimpedance discharge (1188.53±397.26 vs 471.43±121.26Ohms, p<0.0001), and atrial pacing threshold Athreshold 0–Athreshold discharge (1.10±0.39 vs 0.43±0.23V, p=0.0003).
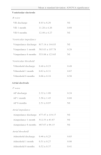
On analyzing the situation during posterior follow-up, the parameters were found to stabilize, with no significant variations. This can be seen in Table 5, where comparisons are established for each of the variables by means of the ANOVA test. Although no significant variations were observed, this might be explained by the small sample size involved in some of the cases. The evolution of the impedances is graphically reflected in Fig. 1.
Comparison of electrode data over post-implantation follow-up.
| Mean±standard deviation | ANOVA significance | |
| Ventricular electrode | ||
| R wave | ||
| VR discharge | 8.93±6.29 | NI |
| VR 1 month | 11.28±4.26 | 0.69 |
| VR 6 months | 12.49±4.27 | NI |
| Ventricular impedance | ||
| Vimpedance discharge | 617.14±144.83 | NI |
| Vimpedance 1 month | 563.03±107.78 | 0.29 |
| Vimpedance 6 months | 553.88±123.65 | NI |
| Ventricular threshold | ||
| Vthreshold discharge | 0.48±0.23 | 0.49 |
| Vthreshold 1 month | 0.63±0.31 | 0.67 |
| Vthreshold 6 months | 0.66±0.18 | 0.50 |
| Atrial electrode | ||
| P wave | ||
| AP discharge | 2.32±1.09 | 0.24 |
| AP 1 month | 3.56±1.45 | 0.88 |
| AP 6 months | 2.51±0.97 | NI |
| Atrial impedance | ||
| Aimpedance discharge | 477.47±119.17 | NI |
| Aimpedance 1 month | 512.53±83.67 | NI |
| Aimpedance 6 months | 467.67±94.15 | NI |
| Atrial threshold | ||
| Athreshold discharge | 0.46±0.25 | 0.85 |
| Athreshold 1 month | 0.51±0.27 | 0.08 |
| Athreshold 6 months | 0.52±0.37 | 0.41 |
Units: impedance (Ω), threshold (V), sensed intrinsic activity (mV).
The first letter V/A means ventricular or atrial chamber, respectively.
0: at time 0; A: atrial chamber; AP: sensed intrinsic activity value, P measured in atrium; post: post-fixation; VR sensed intrinsic activity value, R measured in ventricle; V: ventricular chamber; Variable discharge: measurement at discharge (48h after implantation); Variable 1 month: outpatient follow-up after 1 month; Variable 6 months: outpatient follow-up after 6 months.

In a long-term follow-up study with a duration of two years, Kistler et al.3 found the threshold in the ventricular electrodes to increase significantly between day 1 (0.7±0.2V) and month 1 (0.9±0.6V, p<0.01), after which it remained stable. The four instances in which the threshold had increased to above 2V all occurred between day 1 and month 3. The impedance decreased significantly from day 1 (879±184Ohms) to month 1 (677±122Ohms, p<0.01), after which it remained stable without significant variations during the analyzed period. In our study the behavior of the variations in the parameters was a little different, since the changes in relation to impedance, sensing and threshold occurred early (within the first 48h) and then remained stable over the subsequent 6 months. We consider our findings to be interesting, since they inform us that the parameters which we measure in the operating room, and which serve to decide the suitability of a given location for fixation, undergo changes in the first 48h after completion of the procedure—probably due to the normal phenomena secondary and intrinsic to fixation with the induction of local endomyocardial damage. This variation is observed immediately in the operating room as a result of penetration of the helix in the tissues, affecting mainly electrode impedance (as can be seen in Table 1) and the atrial threshold (though to a less significant degree). The only parameter which we initially might expect to vary would be impedance, as a result of the penetration of the helix in the tissues, but we have also observed an immediate change in the atrial threshold. Other authors have also reported variations of other parameters such as the pacing threshold after active fixation, in a short period of time. In this sense Kistler et al.14 reported that an initial threshold of 2V should be momentarily accepted and tested again after four minutes. These authors recommend repositioning of the electrode only if an elevated threshold persists after this period of time. However, other studies have described a significant percentage of elevated thresholds during patient follow-up that makes reprogramming necessary; i.e., this parameter shows greater variability15 than others. On analyzing the variations between the values prior to fixation and those recorded after 48h, the latter are seen to be greater, and improvement of the thresholds is obtained—not only of the already evidenced trial thresholds but also of the ventricular thresholds, thus affording a certain margin in relation to the values of the parameters demanded at the time of implantation. As suggested by Kistler, on obtaining a threshold of 2V at implantation, and provided the position is radiologically good, we probably can wait a few minutes before measuring again to check whether the values have improved. The sensitivity values in the ventricle (R value) and atrium (P value) experience changes, though in opposite directions, evolving towards lesser values for both parameters. This may require us to be demanding in relation to the sensitivity values at the time of implantation, since the values probably will decrease over the next 48h. Once we have confirmed that the parameters remain favorable in the subsequent 48-h period, they probably will not vary during the next 6 months, as we observed in the comparative study of the mean values at discharge and after one and 6 months.
Regarding the limitations of our study, it must be taken into account that in some cases comparison could not be made because of the small sample size involved. In effect, of the global 40 patients, the values corresponding to the atrial electrode are only referred to 19 cases in which a two-chamber device was implanted. It is also important to mention that the parameters measured in the operating room are obtained with the electrodes exposed, using an analyzer-programmer that may be different to the programmers used later on when the patient is no longer in the operating room with the electrodes exposed.
The successive follow-up measurements are made through the connection with a generator and different specific programmers—not through direct connection with the electrodes. The measurements of impedance therefore may contain artifacts, though not upon comparing between time 0 and post-fixation, or on comparing the values at discharge and those during posterior follow-up. There are no data in the literature indicating that measurement through a generator introduces artifacts in values such as the pacing threshold.
This limitation cannot be overcome with the current procedures, and constitutes standard practice for the assessment and follow-up of patients with pacemakers. We therefore consider it interesting to share our experience, despite the limitations involved.
It, therefore, can be concluded that in the active fixation of definitive pacemaker electrodes, after the electrode helix extraction process, we can expect a significant drop in impedance both in the atrial electrode and in the ventricular electrode. This drop should be regarded as normal. However, particularly notorious decreases accompanied by variations in the pacing and/or sensing threshold values may indicate progression of the electrode, and even electrode penetration or perforation of the myocardium. It is less common for the rest of parameters to experience variations in the fixation process—the changes in our series being limited to variation in the atrial threshold.
After 48h we recorded significant variations in other values such as the ventricular and atrial pacing thresholds, with improvement of these parameters; a new decrease in impedance that could contain artifacts due to the different ways of recording the values through the generator, or to local endomyocardial lesion phenomena16; and a decrease in the intrinsic activity values. Posteriorly, the values are seen to stabilize and show a more linear behavior over the long term than in the first few days.
Although it may appear obvious, it is advisable to perform measurement of the electrode parameters 48h after implantation, prior to patient discharge. This will allow correct evolutive assessment during outpatient follow-up, and moreover will make it possible to detect early complications such as microdislocation or penetration of the electrode in the myocardium. Regarding the pacing threshold, at implant we also can consider margins of optimum values higher than those considered in the case of passive fixation. If the threshold we measure at a good RV positioning point is slightly elevated, with values of 2V or slightly higher, some authors consider that a waiting time of four minutes suffices to detect improvement towards values which are regarded as optimum. Moreover, according to our findings, it is usual for the values to improve significantly over the next 48h. However, the intrinsic activity sensing values must be favorable at implantation—accepting R wave values of ≥5mV and P wave values of ≥2mV,17 since in our series these values subsequently worsened (even to a significant degree in the case of the atrium)—sufficient margin therefore being needed in order to continue with safe programming.
Conflicts of interestThe authors declare no conflicts of interest.
Thanks are due to all the colleagues who have participated in collection of the data and who are likewise involved in the patient care activities of our department.
We also wish to thank the patients and their relatives, as they represent the origin of our driving force and dedication to the struggle against disease and suffering, and inspire us to seek constant improvement in our work.
Please cite this article as: Canabal A, et al. Variación esperable de parámetros medidos en el implante y seguimiento de electrodos de fijación activa de marcapasos definitivos. Med Intensiva. 2012;36:270–6.

