
to compare the different evolution of conventional laboratory parameters between three severe trauma phenotypes.
DesignObservational study of a prospectively collected cohort of severe trauma patients, with retrospective database completion, studied between 2012 and 2022.
SettingA trauma intensive care unit (ICU).
PatientsSevere trauma patients were defined by an Abbreviated Injury Scale of ≥ 3 in at least one aspect. Three groups were stablished according to hemodynamic status and Glasgow coma scale (GCS), and they were subsequently subdivided in prematurely deceased and survivors after > 72 h (h). Laboratory parameters were followed up to 96 h, statistical analysis between groups and subgroups was performed at 0 and 24 h.
InterventionsNone.
Main variables of interestPrehospital, clinical variables on admission, prognostic variables (prospective gathering); blood count, biochemistry, coagulation, blood gas analysis (retrospectively collected).
Results1631 patients were included, 8% prematurely deceased. Initial leukocytosis and hyperglycemia were common in all groups. Hemodynamically stable patients with a GCS < 14 stood out due to a high neutrophil-to-lymphocyte ratio (NLR) and hypernatremia, both of them at 24 h, together with initial coagulopathy in the prematurely deceased. Hemodynamically unstable patients exhibited an initial pattern of lactic acidosis, coagulopathy, and decreased platelet-to-lymphocyte ratio, hemoglobin, albumin and calcium, all these changes being most prominent in the prematurely deceased. A 24 h peak in NLR was found in both the hemodynamically unstable and GCS < 14 groups.
ConclusionEvolution of laboratory parameters differ according to the patient’s phenotype. They complete the initial severity evaluation and in hemodynamically stable patients they act as a warning for potential neurological damage.
Comparar la evolución de parámetros convencionales de laboratorio en tres fenotipos de pacientes con trauma grave.
DiseñoEstudio sobre cohorte recogida prospectivamente entre 2012 y 2022 y completada retrospectivamente con valores analíticos.
ÁmbitoUnidad de cuidados intensivos especializada en trauma.
PacientesPacientes con trauma grave definidos por Abbreviated Injury Scale de ≥ 3 en al menos un área. Clasificados en tres grupos según situación hemodinámica (HD) y escala de coma de Glasgow (GCS); después subdivididos en fallecidos precozmente y supervivientes tras 72 horas (h). Se siguieron los valores analíticos 4 días y se compararon a las 0 y 24 h entre grupos y subgrupos.
IntervencionesNinguna.
Variables de interés principalesPrehospitalarias, variables clínicas al ingreso, variables pronósticas (recogida prospectiva); hemograma, bioquímica, coagulación, gasometría (retrospectivamente).
ResultadosSe incluyeron 1631 pacientes, 8% fallecieron precozmente. Leucocitosis e hiperglucemia iniciales ocurrieron en todos los grupos. Pacientes estables HD con GCS < 14 destacaron por un ratio neutófilo-linfocito (NLR) elevado e hipernatremia ambos a las 24 h, así como por coagulopatía inicial en fallecidos precozmente. Pacientes inestables HD mostraron un patrón inicial de acidosis láctica, coagulopatía, y disminución de ratio plaqueta-linfocito, hemoglobina, albúmina y calcio, todos estos cambios siendo más marcados en los precozmente fallecidos. El pico de NLR a las 24 h se encontró tanto en inestables HD como en aquellos con GCS < 14.
ConclusionesEl patrón analítico difiere en cada fenotipo de paciente. Completa la valoración inicial de la gravedad y en pacientes con estabilidad hemodinámica puede alertar sobre una posible lesión neurológica.
Severe trauma carries a great burden of morbidity and mortality worldwide.1–3 Injury due to trauma can affect the body in various ways depending on mechanism of injury and patient characteristics. What ultimately leads to disability and mortality are three main pathological components: hypoperfusion due to shock, direct tissue injury, and direct central nervous system injury.4,5
Initial management requires combining demographic, physiological, anatomical6–8 and laboratory data.9–12 The Berlin definition of polytrauma13 focuses on these factors because they have an effect in mortality: Abbreviated injury scale (AIS) of ≥ 3 in two or more different anatomic AIS regions and one of the following: hypotension, coma, base deficit of ≥ 6 mmol/L, coagulopathy or age >70 years. Many of these key factors influence one another, and to extract the independent contribution of each one to patient severity and predicted morbidity is very challenging.14
We hypothesized that some laboratory parameters offer differential information regarding patient severity and short term mortality in three frequent scenarios of severe trauma: hemodynamic (HD) instability, HD stability with an altered level of consciousness, or none of the two. We classified patients according to these elements because they have proved to be two of the top main determinants of patient prognosis after severe trauma,15,16 taking Glasgow coma scale (GCS) score as a surrogate for the presence of traumatic brain injury in hemodynamically stable patients. We defined early death as patient death in the intensive care unit (ICU) during the first 72 h of admission, as it included three quarters of patients deceased in the ICU and the definition of short term mortality after trauma is not clearly defined between the time points of 24, 48 and 72 h after admission.17,18
Our primary objectives were to compare the patterns of conventional laboratory parameters in the three study groups built according to hemodynamic status and GCS score, then to explore them for further additional value comparing them between survivors and the early deceased at the time points 0 and 24 h after ICU admission. Our secondary objective was to follow the evolution of those parameters in study subgroups in those patients who were still in the ICU after 96 h.
Patients and methodsThis observational analytical study was conducted in a trauma ICU. We included patients with traumatic injury between 2012 and 2022, who fulfilled the following criteria inspired by the Berlin definition: AIS score ≥ 3 in at least one anatomical area. This definition can be found elsewhere and is one of the most inclusive of Injury Severity Score (ISS) cut-offs in the heterogeneous landscape of severe trauma definitions.19 It differs from the current Berlin definition (AIS ≥ 3 for ≥ 2 different body areas + 1 altered physiologic parameter), as the altered physiological parameters were removed from the definition in order to be analyzed in this study, and to include isolated traumatic brain injury (TBI) patients.20
We excluded patients with non-hemorrhagic mechanisms of trauma (burns, electrocution, smoke inhalation, heat stroke, hypothermia, near drowning), those transferred from another center, those without available laboratory parameters and those younger than 14 years old.
Included patients were classified into three groups according to hemodynamic status and GCS score on admission. Hemodynamic instability was defined as the need for vasopressors within the first hour after arrival in order to maintain a systolic blood pressure of > 85 mmHg. GCS between 3 and 13 was used as a surrogate for the presence of TBI in stable patients. Patient groups were labeled “Stable and alert”, “Stable with GCS < 14”, and “Hemodynamically unstable”. Within each subgroup, a further division was made between early deceased (patients who died in the ≤72 h period), and survivors at >72 h.
For each patient, the following data had been collected prospectively: age, sex, and injury mechanism, prehospital clinical parameters, clinical status on arrival, transfusion, AIS area categorization, emergency surgery or angioembolization, and evolution data such as multiorgan dysfunction syndrome development, days of ICU stay, ICU mortality and cause of ICU death.
Laboratory data was recollected at different time points: on arrival and daily up to 96 h. If a patient died or was transferred out of the ICU before the 96 h period, laboratory data ceased to be available after either of those events occurred. Laboratory variables were the complete blood count, blood gas analysis, basic serum biochemistry and conventional coagulation parameters.
Statistical analysisAfter data anonymization and approval from the ethics committee, data was merged in a unified database. Qualitative variables were expressed as absolute count and relative frequency. Clinical quantitative variables that followed a normal distribution were displayed as mean and standard deviation, those which did not follow it were shown as median and interquartile range (IQR). Variables with ≥ 50% missing values were not used. Many parameters had an inevitable proportion of missing data between the 72–96 h time points due to early ICU discharges and early deaths, so statistical analysis was only performed in time points 0 and 24 h. Laboratory parameter comparison was first realized between study groups, then across study groups between survivors and early deceased, both comparisons are described in the main text and the latter is detailed in the supplementary material. Laboratory value distribution is usually skewed due to outliers, however, as it is frequently done in similar studies about laboratory values,10,21 mean and standard deviation were used as measures of central tendency and dispersion since they are able to integrate the information of these relevant outliers, often very sick patients. Mean values of laboratory data were plotted, classified by study group, for the 0 and 24 h time points in early deceased and for the 0–96 timeline for survivors at >72 h. For the contrast hypothesis of quantitative variables against categorical variables, analysis of variance (ANOVA) and Tukey’ tests were used for the normally distributed variables, keeping Mann-Whitney and Dunn’s test for the non-parametric context. All statistical analysis was performed in R software, version “RStudio/2023.12.1 + 402”.
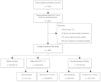
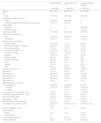
ResultsGlobal descriptionPatient flow diagram can be seen in Fig. 1. Out of 3724 trauma patients admitted on the ICU, 2877 had one or more body regions with an AIS ≥ 3. After applying exclusion criteria, a total of 1631 patients were finally included for the analysis. Patient characteristics are reported on Table 1, classified by the three patient groups according to presence of hemodynamic instability and level of consciousness, the same can be found for subgroups on Table S1. Most important differences are summarized below.

Patient flow diagram.
Flow chart depicting patient inclusion in this study after applying exclusion and inclusion criteria. Non-hemorrhagic mechanisms include lesions due to smoke inhalation, burns, hypothermia, and electrocution.
ICU: intensive care unit, AIS: Abbreviated Injury Scale, GCS: Glasgow coma scale.
Baseline patient characteristics for each study group.
| Stable and alert | Stable with GCS < 14 | Hemodynamically unstable | |
|---|---|---|---|
| n = 855 (52) | n = 449 (28) | n = 327 (20) | |
| Age (yr) | 44.3 (18.3) | 46.8 (18.7) | 44.2 (18.0) |
| Sex | |||
| Male | 677 (79.2) | 354 (78.8) | 245 (74.9) |
| Hemodynamic status on arrival | |||
| Stable | 743 (86.9) | 389 (86.6) | 0 |
| Transient instability that responds to initial volume administration | 112 (13.1) | 60 (13.4) | 0 |
| Unstable | 0 | 0 | 295 (90.2) |
| Refractory shock | 0 | 0 | 32 (9.8) |
| ISS (median, [IQR]) | 17 [13–22] | 25 [17–33] | 34 [25−45] |
| Global trauma mechanism | |||
| Blunt | 721 (84.3) | 443 (98.7) | 277 (84.7) |
| Penetrating | 134 (15.7) | 6 (1.3) | 50 (15.3) |
| Specific trauma mechanism | |||
| Fall from height | 169 (19.8) | 77 (17) | 83 (25) |
| Road traffic accident - motorcycle | 160 (18.7) | 43 (10) | 41 (13) |
| Run-over pedestrian | 81 (9.5) | 78 (17) | 48 (15) |
| Road traffic accident - car | 114 (13.3) | 48 (11) | 45 (14) |
| Fall from low height | 74 (8.7) | 110 (24) | 18 (6) |
| Stabbing | 123 (14.4) | 3 (1) | 43 (13) |
| Bicycle accident | 42 (4.9) | 29 (6) | 6 (2) |
| Hit with blunt object | 24 (2.8) | 30 (7) | 8 (2) |
| Crush | 23 (2.7) | 6 (1) | 7 (2) |
| Firearm | 13 (1.5) | 3 (1) | 43 (13) |
| Other | 32 (3.7) | 20 (4) | 18 (6) |
| AIS Head and Neck ≥ 3 | 215 (25) | 391 (87) | 166 (51) |
| AIS Face ≥ 3 | 15 (1.8) | 26 (6) | 24 (7) |
| AIS Thoracic ≥ 3 | 363 (42.5) | 125 (28) | 222 (68) |
| AIS Abdominal ≥ 3 | 127 (14.9) | 24 (5) | 118 (36) |
| AIS Extremity ≥ 3 | 283 (33.1) | 70 (16) | 157 (48) |
| AIS External ≥ 3 | 2 (0.2) | 4 (1) | 5 (2) |
| pRBC transfusion in first 24 h | |||
| No transfusion | 740 (86.5) | 386 (86.0) | 53 (16.2) |
| 1−9 pRBC | 110 (12.9) | 59 (13.1) | 155 (47.4) |
| ≥ 10 pRBC | 0 | 0 (0) | 118 (36.1) |
| Torso damage control surgery < 24 h | 73 (8.5) | 6 (1.3) | 113 (34.6) |
| Therapeutic angioembolization < 24 h | 37 (4.3) | 6 (1.3) | 46 (14.1) |
| ICP neuromonitorization | 12 (1.4) | 150 (33.4) | 46 (14.1) |
| Neurosurgery < 24 h | 14 (1.6) | 71 (15.8) | 19 (5.8) |
| Multiorgan dysfunction syndrome | 12 (1.4) | 6 (1.3) | 81 (24.8) |
| ICU length of stay (median, [IQR]) | 1.97 [1.03–3.20] | 3.95 [1.74−12.7] | 5.45 [1.85−16.2] |
| Early ICU Mortality (≤72 h) | 4 (<1) | 51 (11) | 80 (24) |
| Cause of death | |||
| MODS | 2 (<1) | 3 (<1) | 14 (4) |
| Exsanguination | 0 | 1 | 32 (10) |
| Neurological damage | 6 (7) | 67 (15) | 61 (19) |
| Total ICU Mortality | 8 (0.9) | 71 (15.8) | 107 (32.7) |
Clinical patient characteristics at baseline and during ICU admission, classified by main study groups. Categorical variables are described with absolute number followed by percentage between parentheses. Continuous variables are described with mean followed by standard deviation, or median followed by [interquartile range] if specified. AIS per anatomical area are shown as absolute number and percentage of patients with a score equal or greater than 3 in each are.
TBI: traumatic brain injury, yr: year, AIS: Abbreviated Injury Scale, pRBC: packed red blood cell, ISS: Injury Severity Score, ICU: intensive care unit, MODS: multiorgan dysfunction syndrome.
Stable and alert group represents roughly 50% of patients, and it was not further divided into early deceased and survivors because only 4 patients (<1%) died in the first 72 h. In this group median ISS was 17, most patients were not transfused, length of stay and mortality were very low. Stable with GCS < 14 group accounts for approximately 30% of patients and one out of ten was early deceased; nearly all patients in this group died due to intracranial hypertension or withdrawal of life support owing to a catastrophic neurological prognosis. Almost all patients suffered from a blunt mechanism the most frequent being fall from low heights and run-over pedestrian. Most patients had severe TBI as their main lesion, one third received invasive intracranial pressure (ICP) monitoring and 15% urgent neurosurgery. Hemodynamically unstable group represents 20% of patients and one out of four suffered from an early death (50% due neurological damage and 35% due to catastrophic bleeding). Most frequent mechanism was fall from high altitude while stab wound, gunshot wound, run-over pedestrian and motor vehicle accidents were all of similar frequency in this group. Most patients received early blood cell transfusion, around 40% received massive transfusion. Most frequent severe trauma lesions were thoracic, TBI, extremities including pelvis, and abdominal. One third received torso damage control surgery and 14% therapeutic angioembolization. Incidence of multiorgan dysfunction syndrome was high at 25% and ICU mortality was 33%, length of stay was highest.
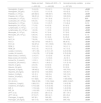
Laboratory data analysisPhosphoremia and monocyte distribution width data were not included in analysis because of >50% missing values in our sample. Included laboratory values are shown in Tables 2, S2 and S3, and plotted in Figs. 2A–D. We provide a statistical comparison between the early values of the three patient groups in Table 2, with post-hoc testing in Table S4. The in-group analysis between survivors at > 72 h and early deceased is shown in Tables S2 and S3. Sample sizes for each data point gradually decrease over time, mostly due to discharges in the group that survives > 72 h, and to very early deaths in the early deceased group. Detailed sample sizes are provided in the footnote of Fig. 2. Next described in text are the statistically significant and most clinically relevant differences shown in the analysis.
Laboratory mean values at 0 and 24 h time points for the three study groups, and statistical comparison.
| Stable and alert | Stable with GCS < 14 | Hemodynamically unstable | p value | |
|---|---|---|---|---|
| n = 855 (52) | n = 449 (28) | n = 327 (20) | ||
| Hemoglobin_0 (g/dL) | 13.4 (2.0) | 13.0 (2.1) | 10.7 (2.8) | <0.001 |
| Hemoglobin_24 (g/dL) | 11.2 (2.0) | 11.3 (1.9) | 10.9 (2.3) | 0.072 |
| Platelets_0 (.103/μL) | 220 (62.5) | 199 (64.7) | 186 (76.0) | <0.001 |
| Platelets_24 (.103/μL) | 168 (51.2) | 164 (53.1) | 129 (53.3) | <0.001 |
| Leukocytes_0 (.103/μL) | 14.3 (5.7) | 14.1 (6.4) | 15.4 (7.1) | 0.01 |
| Leukocytes_24 (.103/μL) | 9.9 (3.4) | 11.4 (4.2) | 10.7 (4.9) | <0.001 |
| Neutrophils_0 (.103/μL) | 11.2 (5.4) | 11.3 (5.7) | 11.9 (6.4) | 0.218 |
| Neutrophils_24 (.103/μL) | 7.7 (3.2) | 9.4 (3.9) | 9.0 (4.5) | <0.001 |
| Lymphocytes_0 (.103/μL) | 2.1 (1.2) | 1.9 (1.3) | 2.6 (1.6) | <0.001 |
| Lymphocytes_24 (.103/μL) | 1.2 (0.6) | 1.1 (0.5) | 0.9 (0.5) | <0.001 |
| Monocytes_0 (.103/μL) | 0.8 (0.4) | 0.7 (0.4) | 0.7 (0.5) | <0.001 |
| Monocytes_24 (.103/μL) | 0.8 (0.4) | 0.8 (0.4) | 0.8 (0.5) | 0.116 |
| NLR_0 | 7.8 (8.4) | 8.1 (6.2) | 6.4 (5.2) | <0.001 |
| NLR_24 | 7.9 (6.6) | 11.5 (8.3) | 12.4 (8.9) | <0.001 |
| PLR_0 | 142 (107.8) | 140 (91.7) | 98 (81.5) | <0.001 |
| PLR_24 | 164 (97.2) | 191 (109.9) | 182 (120.4) | <0.001 |
| RDW_0 | 13.8 (1.3) | 14.0 (1.4) | 14.0 (1.1) | <0.001 |
| RDW_24 | 14.0 (1.3) | 14.2 (1.5) | 14.7 (1.0) | <0.001 |
| Lactate_0 (mmol/L) | 1.97 (1.50) | 2.15 (1.47) | 4.23 (3.58) | <0.001 |
| Lactate_24 (mmol/L) | 1.19 (0.76) | 1.37 (0.99) | 2.78 (2.28) | <0.001 |
| Base excess_0 (mmol/L) | −2.4 (3.7) | −3.3 (3.9) | −6.3 (5.8) | <0.001 |
| Base excess_24 (mmol/L) | −1.0 (3.1) | −1.2 (3.2) | −2.2 (4.1) | <0.001 |
| Ionized Ca_0 (mmol/L) | 1.10 0.1) | 1.06 (0.1) | 1.02 (0.12) | <0.001 |
| Ionized Ca_24 (mmol/L) | 1.09 (0.1) | 1.06 (0.1) | 1.01 (0.10) | <0.001 |
| Albumin_0 (g/dL) | 4.0 (0.5) | 3.8 (0.6) | 2.9 (0.8) | <0.001 |
| Albumin_24 (g/dL) | 3.4 (0.4) | 3.3 (0.5) | 3.0 (0.5) | <0.001 |
| Glycemia_0 (mg/dL) | 138 (42.2) | 147 (52.2) | 195 (76.3) | <0.001 |
| Glycemia_24 (mg/dL) | 122 (31.6) | 133 (36.9) | 140 (40.7) | <0.001 |
| Sodium_0 (mEq/L) | 141 (3.1) | 142 (5.4) | 145 (10.0) | <0.001 |
| Sodium_24 (mEq/L) | 140 (3.2) | 143 (5.4) | 148 (7.0) | <0.001 |
| CK_0 (U/L) | 517 (923) | 471 (481) | 1186 (5345) | <0.001 |
| CK_24 (U/L) | 1564 (2126) | 1152 (1644) | 4962 (10,647) | <0.001 |
| Creatinine_0 (mg/dL) | 0.88 (0.31) | 0.85 (0.58) | 1.04 (0.38) | <0.001 |
| Creatinine_24 (mg/dL) | 0.75 (0.28) | 0.72 (0.45) | 1.00 (0.43) | <0.001 |
| INR_0 | 1.15 (0.44) | 1.21 (0.56) | 1.43 (0.59) | <0.001 |
| INR_24 | 1.16 (0.20) | 1.18 (0.19) | 1.22 (0.18) | <0.001 |
| aPTT_0 (s) | 27.2 (6.4) | 28.4 (7.2) | 36.1 (19.1) | <0.001 |
| aPTT_24 (s) | 27.5 (3.7) | 28.5 (4.1) | 29.3 (5.2) | <0.001 |
| Fibrinogen_0 (mg/dL) | 347 (81) | 340 (92) | 302 (81) | <0.001 |
| Fibrinogen_24 (mg/dL) | 437 (110) | 436 (107) | 399 (105) | <0.001 |
Mean value and standard deviation of different laboratory values at the time points 0 h and 24 h after ICU admission, classified by study group. ANOVA or Kruskal-Wallis tests were performed, where appropriate, for each parameter and time point to report statistically significant differences between study groups. Significant p values < 0.05 are in bold. “_0” and “_24” accounts for time point 0 h and 24 h after ICU admission, respectively.
Abbreviations: /μL: cell count per microliter, s: seconds, NLR: neutrophil-to-lymphocyte ratio, PLR: platelet-to-lymphocyte ratio, RDW: red cell distribution width, Ca: calcium, INR: international normalized ratio; aPTT: activated Partial Thromboplastin Time, CK: creatine-kinase, ANOVA: analysis of variance, h: hour.


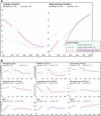
Admission and further evolution of laboratory parameters between time 0 and 96 h, in patient groups and subgroups. (A) Acid-base, (B) Blood Count, (C) Basic biochemistry, (D) Conventional coagulation tests.
Evolution of the mean value of different laboratory values on different time points. In the early deceased subgroups, values are shown at ICU admission (0 h), and at 24 h. In the rest of patients, values are shown at time points 0, 24, 48, 72 and 96 h after admission. Kind of parameter and its unit of measure is indicated in each individual graph. In each graph, one line is traced per study subgroup (green pointed line is stable and alert, blue dashed line is stable with GCS < 14, pink line is hemodynamically unstable). In the group that survives > 72 h, values at 0 h are extracted from a sample size of n = 1400 patients, which progressively decreases approximately to n = 500 at 96 h. In the early deceased group, values at 0 h are extracted form a sample size of n = 100 patients, and fall to n = 60 patients at 24 h. Figure A: blood gas values. Figures B and C: blood count values and basic biochemistry, respectively. Figure D: conventional coagulation parameters.
Abbreviations: /μL: cell count per microliter, s: seconds, NLR: neutrophil-to-lymphocyte ratio, PLR: platelet-to-lymphocyte ratio, RDW: red cell distribution width, U/L (unit per liter), INR: international normalized ratio; aPTT: activated partial thromboplastin time, h: hour.
On arrival, main blood counts are normal in these patients, such as hemoglobin > 13 g/dL and platelets > 200.103/μL. Leukocytosis and hyperglycemia are the most prominent changes seen even in these less severe patients, usually resolved at 24 h. As it can be seen in Fig. 2A–D, most parameters are not altered on arrival in these groups: ionized calcium keeps around 1.10 mmol/L, and no important variation is seen for albumin, creatine-kinase (CK), creatinine, and coagulation parameters. During the following days, hemoglobin falls reaching nadir at 72−96 h, platelets also descend and plateau at 48 h. Some values become different than those of a healthy population, such as lower albumin, hemoglobin and lymphocyte count, higher CK (mean of 2000 U/L) or higher fibrinogen. Most other minimal alterations resolve rapidly.
Stable with GCS < 14 patientsOn arrival, altered parameters are leukocytosis due to neutrophil rise, slight hyperglycemia, low platelet count, slightly elevated lactate and negative base excess, as well as lower ionized calcium. Some pathological alterations on arrival are only seen in early deceased, such as higher international normalized ratio (INR) > 1.4, higher activated partial thromboplastin time (aPTT) of 35 s; hyperglycemia is higher nearing 200 mg/dL. During the following days, the most salient alterations are the 24 h neutrophil-to-lymphocyte ratio (NLR) elevation to a mean of 20 in early deceased (elevated but less prominently in survivors), and sodium elevation to a mean of nearly 150 mEq/L mostly in early deceased. Most other alterations of surviving patients plateau at 48−72 h.
Hemodynamically unstable patientsProminent changes on arrival in this group are numerous. Mean hemoglobin of 10−11 g/dL, low platelets, high lactate and negative base excess, high INR and aPTT, low ionized calcium, albumin and hyperglycemia, hypernatremia and creatinine rise are added to the leukocytosis already seen in the other groups. Among the early deceased these initial changes values are very profound, such as the following means: platelet count 150.103/μL, platelet-to-lymphocyte ratio (PLR) of 69, lactate of 6 that only clears to 4.8 mmol/L at 24 h, base excess of −8 that only clears to −6 mmol/L at 24 h, and very high mean values of INR 1.6 and nearly 50 aPTT. At 24 h, it is worth noting the hemoglobin rise only in early deceased, the NLR rise which is also highest on early deceased, and the low lactate clearance. During the following days, parameters worth following due to salient changes are the rise and fall of CK which peaks at 48 h, the rise of fibrinogen which is similar with the one seen on the other groups, and hemoglobin and platelets which show an specially low plateau of 8.5 g/dL and 100.103/ μL, respectively at 72 h.
DiscussionIn this study we show the evolution of common serum laboratory values during the first days after severe traumatic injury, highlighting different behaviors according to a clinical classification. This partition according to hemodynamic status and neurological involvement was selected as two of the top causes of death after trauma are TBI and exanguination22; phenotype classification seemed adequate due to the syndromic and heterogeneous nature of severe trauma.23
Inflammatory response is expected after traumatic injury in every patientAfter severe trauma, a complex multilevel response (immune, metabolic, hormonal) is activated within minutes of initial injury.24 A response originated by tissue disruption, so even in patients without shock, biomarker changes show that some degree of inflammation is inevitable after a significant mechanical injury. Our results reflect this mild response on arrival in leukocytosis, mild hyperglycemia and mild acidosis, and during the following days in the 24 h lymphocyte fall, hemoglobin fall, rising levels of CK and fibrinogen. Some laboratory alterations are probably due to clinician intervention (hemodilution) such as those seen in albumin and hemoglobin in all study groups.
Laboratory changes in shockThis study strived to show the laboratory picture available to most trauma teams, thus it only describes common laboratory parameters. Stress mediated immune activation will cause changes in leukocyte formula,25 sympathoadrenergic pathways and local release of damage-associated molecular patterns will cause metabolic changes such as stress hyperglycemia, acidosis and lactate production.26 These patients with shock showed a greatly altered biochemical profile as can be seen on Fig. 2, Tables 2 and 3, with emphasis in lactate, base deficit, hemoglobin, leukocyte formula, and hemostasis parameters (platelets, calcium, INR and aPTT). Biochemical analysis of shock has rooted itself in clinical practice as an estimator of patient severity and as an endpoint of resuscitation.27,28 Lactate, its clearance and base deficit measurement is recommended in a prominent trauma guideline,29 they are included in many predictive scores of massive blood transfusion protocol activation30 and they may reflect presence of shock and necessity of operative intervention even better than vital signs.10,11
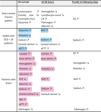
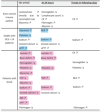
Overall picture of most salient laboratory value changes between study groups.

Schematic depiction of elevated and low laboratory values among two study groups (stable with GCS < 14 and those with shock), and parameters altered in all patients. North east arrow means “high” and South east arrow means “low” laboratory values. Columns depict laboratory changes over time.
Highlighted text in pink or blue expresses that the parameter alteration is only present or more salient in the early deceased subgroup, compared with the survivors at 72h group.
Abbreviations: NLR: neutrophil-to-lymphocyte ratio, PLR: platelet-to-lymphocyte ratio, INR: international normalized ratio; aPTT: activated Partial Thromboplastin Time, CK: creatine-kinase, GCS: Glasgow coma scale.
Results on the leukocyte formula adds to the numerous scientific body of knowledge on this area in trauma patients.25,31,32 On admission, leukocytosis arises due mostly to neutrophil counts, reaching higher numbers in the unstable groups. Platelet and PLR decrease on arrival is maximal on unstable groups, and lowest in the early deceased among the unstable patients.33 At 24 h, lymphocyte count drops markedly in the sickest groups, and the rise of the NLR begins to convey information. This rise is shown both in unstable patients and in patients stable with GCS < 14 h, and highest in the early deceased of both these groups. High NLR acts as a sensitive biomarker of a global critical state,21 as it rises with shock severity and also with isolated major central nervous system injury. Persistent low lymphocytes after 48 h have been associated with the development of multiorgan dysfunction in trauma patients,34 this may be extended to a persistent high NLR after 48 h.
Trauma induced coagulopathy (TIC) is a condition related to tissue injury and hemorrhagic shock, and is one of the pillars of trauma resuscitation.5 Significant elevation of admission mean INR > 1.4 and aPTT > 30 s was only seen in the unstable group of patients and the early deceased of the stable with GCS < 14 group, this may reflect that detectable TIC by conventional coagulation tests on arrival is only seen in the most severe patients either due to profound shock, devastating cerebral injury, or both.
The degree of impact of clinician intervention (transfusion, crystalloids) in platelet, calcium, INR, aPTT and fibrinogen levels is difficult to assess. Hemodilution is probably contributing to the decline of some parameters over the days, such as albumin, and hemoglobin. The peak in 24 h hemoglobin in unstable early deceased is probably due to overtransfusion, and it is noteworthy that this subgroup had the lowest initial hemoglobin.
Changes due to the presence of major TBIThe NLR rise of the 24 h is highest in the early deceased of this subgroup. This study shows how much the NLR diagnostic value for patients with major TBI can be confounded by concomitant shock. The value of this item may be maximal on stable HD, comatose patients, such as stable HD patients with diffuse axonal injury and a normal initial computerized tomography of the head and the spine.35
Other studies have shown that isolated TBI can cause profound alterations in conventional coagulation studies even on arrival.36 In Table 3 we can see how conventional laboratory alterations strictly specific to this subgroup do not exist, although a pattern could be drawn, since for instance 24 h NLR is high but there is no lactic acidosis. Sodium elevation is probably due to clinician intervention (hypertonic saline administration). Specific central nervous system biomarkers will probably be needed to further assess the extent of isolated TBI, such as proteins S100 calcium-binding protein B (S100B), glial fibrillary acidic protein (GFAP) or ubiquitin carboxy-terminal hydrolase L1 (UCH-L1).37
LimitationsThis study carries limitations, such as the retrospective nature of laboratory value recollection from a single center. The definitions for patient groups are not universally accepted, such as our hemodynamic instability definition which is bound to select more severe patients as it does not include those with a systolic blood pressure < 85 mmHg that improve with volume administration. The use of GCS < 14 as a surrogate to select patients with major TBI is limited by intoxication and sedation; profound shock would be another confounder but it was excluded in this subgroup. Laboratory values were missing notably in the 48−72 and 96 h time points, mostly due to early ICU discharges and also patient early deaths, limiting the value of our depiction of their natural evolution through time. Finally, at the 24 h time point some of the sickest patients had already died, the evolution of their parameters was not shown at intermediate moments for the sake of figure clarity.
In conclusion, this study depicts the early evolution of conventional laboratory values usually measured in ICU trauma patients and shows how a different pattern arises within each patient phenotype. It also provides a frame of reference for those highly altered laboratory values in patients of extreme severity, within the spectrum of unstable patients or those with isolated low level of consciousness. This could lead to a better patient categorization and prognosis estimation through further studies and patient modeling, as well as to a more efficient laboratory workup protocol for the first 5 days of admission.
CRediT authorship contribution statementAll authors contributed to study design conception. GF was in charge of prospectively acquired data collection, CF.C and CB of retrospectively acquired laboratory data gathering. MM, VF, BM and CF.M contributed to analysis, MM was responsible for manuscript preparation and writing. BM, CF.M, VF and L were in charge of manuscript drafts revision. All authors read and approved the final version of the manuscript prior to submission.
Declaration of Generative AI and AI-assisted technologies in the writing processNo artificial intelligence (AI) tools were used during the preparation and writing of this work.
FundingThis work was supported by Plan Nacional de I+D+I 2013-2016 and Instituto de Salud Carlos III. The first author holds a clinical research contract Río Hortega (CM24/00108).
The authors declare that the study was conducted with absence of competing interest or commercial relationship of any kind.
We would like to thank all the colleagues of the Intensive Care Department who took care of the patients included in this study and their families, also to the colleagues of the Biochemistry and Hematology Department who collected and analyzed all the laboratory samples.
The following is Supplementary data to this article: