


To analyse which variables associated with ICU admission for COVID-19 were linked to higher hospital costs according to the APR-DRG classification.
DesignRetrospective, observational, and analytical study.
SettingCOVID-19 ICU in a tertiary hospital.
PatientsAdults (>18 years) with a confirmed diagnosis of SARS-CoV-2 infection.
InterventionsPredictive models using multiple logistic regression.
Main variables of interestHospital cost, APR-DRG, mechanical ventilation.
ResultsA total of 799 patients were analyzed and categorized into tertiles based on hospital stay costs, resulting in three groups: 266 patients with lower costs (median €6160 [p25: 3962–p75: 6160]), 314 with intermediate costs (median €16,446 [p25: 10,653–p75: 18,274]), and 219 with higher costs (median €26,085 [p25: 26,085–p75: 51,523]). The best predictive model, with an AIC of 490.09 and an R2 of 0.32, identified the following factors as significantly associated with higher hospital costs: ICU length of stay (OR: 1.05; 95% CI: 1.03–1.07; p < 0.01), development of VAT/VAP (OR: 4.72; 95% CI: 2.83–7.85; p < 0.01), OXA-48 infection (OR: 2.65; 95% CI: 1.25–5.61; p = 0.01), pulmonary embolism (OR: 6.42; 95% CI: 2.17–19.26; p < 0.01), smoking history (OR: 2.22; 95% CI: 1.49–3.74; p < 0.01), and vasopressor requirement (OR: 1.79; 95% CI: 1.22–2.86; p = 0.01). The area under the curve (AUC) was 0.866 (p < 0.01).
ConclusionsProlonged ICU stay, infectious and thromboembolic complications, smoking history, and vasopressor requirement were significantly associated with higher hospital costs.
Analizar qué variables asociadas al ingreso en UCI-COVID-19 se asociaron con pacientes que generaron un mayor coste hospitalario según el APR-GRD.
DiseñoEstudio retrospectivo, observacional y analítico.
ÁmbitoUCI-COVID de hospital terciario.
PacientesMayores de 18 años, con diagnóstico confirmado de enfermedad por SARS-CoV-2.
IntervencionesModelos predictivos mediante regresión logística múltiple.
Variables de interés principalesCoste hospitalario, APR-GRD, ventilación mecánica.
ResultadosSe analizaron 799 pacientes, categorizados por terciles según el coste de su estancia hospitalaria, obteniendo 3 grupos: 266 enfermos con menor coste (mediana de 6.160€ (p25: 3.962-p75: 6.160)); 314 que generaron un coste intermedio (mediana de 16.446€ (p25:10.653-p75:18.274)), y 219 con mayor coste hospitalario (mediana de 26.085€ (p25: 26.085-p75:51.523)). El mejor modelo predictivo, con un AIC de 490,09 y un R2 de 0,32, identificó como factores asociados a un mayor coste hospitalario la estancia en UCI (OR: 1,05; IC95%: 1,03-1,07; p < 0,01), el desarrollo de TAVM/NAVM (OR: 4,72; IC95%: 2,83-7,85; p < 0,01), la infección por OXA-48 (OR: 2,65; IC95%: 1,25-5,61; p = 0,01), el tromboembolismo pulmonar (OR: 6,42; IC95%: 2,17-19,26; p < 0,01), el hábito tabáquico (OR: 2,22; IC95%: 1,49-3,74; p < 0,01) y la necesidad de vasopresores (OR: 1,79; IC95%: 1,22-2,86; p = 0,01). El área bajo la curva (AUC) obtenida de 0,866, con un valor de p < 0,01.
ConclusionesLa estancia prolongada en UCI, las complicaciones infecciosas y tromboembólicas, el hábito tabáquico y la necesidad de vasopresores se asociaron significativamente con un mayor coste hospitalario.
During the COVID-19 pandemic, strategies such as expanding beds and implementing specific units for patients with the virus (i.e, dedicated SARS-CoV-2 ICU [“COVID-ICU”]) led to an extraordinary increase in healthcare spending.1
Although studies have examined hospital costs associated with the pandemic, little is known about which specific factors within the context of a COVID-ICU admission are associated with higher healthcare costs. Research on this subject shows that spending results are heterogeneous depending on the available resources, the study method used to calculate spending, and the sociosanitary level of the region studied.1–4
In this context, Diagnosis-Related Groups (DRGs) constitute a classification system for inpatient care that groups the cases treated according to the costs required for their treatment while maintaining a certain clinical coherence within the established groups. The All-Patient Refined-DRG (APR-DRG) introduces two new primary criteria for classification: severity and mortality risk.5,6 However, some authors have questioned whether this approach adequately considers the impact of different factors and derived variables on hospital costs during admission to a Department of Intensive Care Medicine (DICM).7
Additionally, it should be borne in mind that some cost-benefit studies may be methodologically complex or subject to bias, making them difficult to interpret and apply in clinical practice. Nevertheless, it is crucial to determine the impact of the variables identified by healthcare professionals in daily care that can potentially influence the hospital costs. Identifying and precisely quantifying these factors would optimize resource allocation and improve efficiency in clinical-level healthcare management.
The present study aimed to analyse which admission-to-the-COVID-ICU variables, including clinical and demographic factors, comorbidities, therapeutic strategies, clinical course, and complications, are associated with patients who generate higher hospital costs according to the APR-DRG.
MethodA retrospective cohort study was conducted at the DICM of an 850-bed tertiary university hospital with an assigned population of nearly 300,000. The study included adult patients admitted to the DCIM’s dedicated COVID-ICU between March 2020 and March 2022 with a confirmed SARS-CoV-2 infection diagnosis via polymerase chain reaction (PCR) testing of respiratory tract cells.
Data were collected from the DICM’s registry of patients with COVID-19 infection. The registry was created after receiving approval from the local Research Ethics Committee (local reference code 2020.250) and obtaining informed consent from patients or their legal representatives (in writing and/or by telephone) to enter their data into the registry. Subsequently, some data that were not initially collected were completed retrospectively.
The inclusion criteria were age greater than or equal to 18 years, a confirmed SARS-CoV-2 diagnosis within the first 24 h of hospital admission, and the need for admission to the COVID-ICU. Details of the recorded variables are provided in Appendix A, Supplementary material. Patients who showed inconsistencies in the variables or lacked basic data when the database was filtered; patients who were readmitted to the ICU during the same hospital episode (i.e., with more than one admission); and patients who were transferred to other centers for reasons unrelated to the medical decision to discharge were excluded from the analysis.
The APR-DRG, as well as the type of discharge, the diagnoses and procedures coded at hospital discharge, disease severity according to APR-DRG, and mortality risk, were obtained from the Minimum Basic Data Set of hospital discharges, which was provided by the Admissions and Clinical Documentation Service of the center. Public prices per process, and their identification with each hospital process via the APR-DRG were obtained from the Order that establishes the amounts of public prices for health services provided by the health service of Cantabria (Spain) (Servicio Cántabro de Salud).8
Patients were categorized into tertiles according to the hospital costs derived from the APR-DRG. Three hospital cost groups were obtained: first, a low-cost group, second, an intermediate cost group, and third, a high-cost group.
Patients were followed up on for 90 days from ICU admission until hospital discharge or death, whichever occurred first. Costs were considered for patients until hospital discharge or until death during hospitalization.
A descriptive analysis of the sample was performed. Categorical variables were presented as absolute frequencies and percentages. Continuous quantitative variables were reported as medians, and 25th and 75th percentiles (p25−75). The chi-square test was used to compare proportions between groups. Analysis of variance (ANOVA) was used to compare means between groups for variables with a normal distribution. For variables that did not follow a normal distribution, the Kruskal–Wallis test was used. If significant differences were obtained, pairwise comparisons were made between the hospital cost tertile groups using Dunn's test with Bonferroni correction to adjust for type I error due to multiple comparisons. A significance level of p α = 0.05 was used.
A bivariate logistic regression analysis was performed to evaluate the association between the different potentially prognostic variables and high hospital costs (third cost tertile). The variables that reached statistical significance in this analysis were then included in predictive models via multiple logistic regression analysis. To select the optimal model, the Akaike information criterion (AIC) and Bayesian information criterion (BIC) were used to identify the model with the best predictive capacity and fit.
Multicollinearity diagnostics revealed that all the included variables had tolerances greater than 0.80 and variance inflation factors less than 1.3, indicating no concerning collinearity.
Data analysis was performed using the JASP version 0.19.3 package (The Netherlands).
ResultsDuring the analyzed period, a total of 911 patients were admitted to the COVID-ICU. Of those, 799 who met the inclusion criteria were finally analyzed (see the flow chart in Fig. 1).

The 799 patients were categorized by tertile according to their hospital costs, resulting in three groups: 266 patients with low costs (median 6160 € [p25: 3962–p75: 6160]); 314 patients with intermediate costs (median 16,446 € [p25: 10,653–p75: 18,274]), and 219 patients with high costs (median 26,085 € [p25: 26,085–p75: 51,523]).
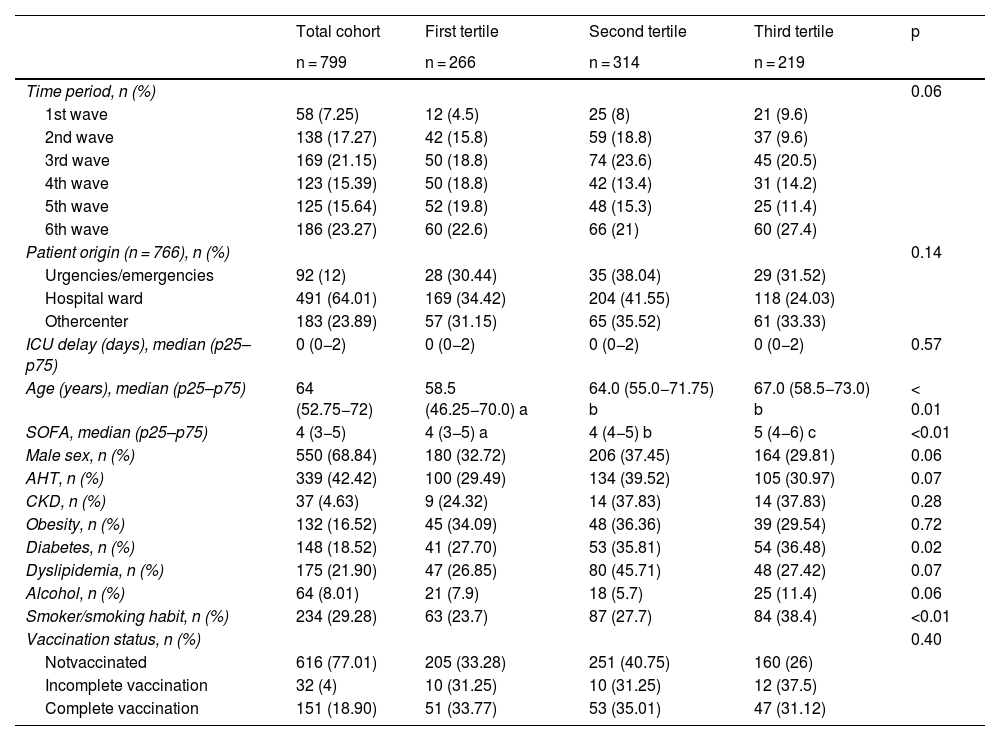
Within the total cohort of 799 patients, the distribution across the six pandemic waves revealed a higher incidence of admissions in the sixth wave (23.27%). There were significant differences in patient age (p < 0.01), with a median of 58.5 years in the first tertile and 67 years in the third. The Sequential Organ Failure Assessment (SOFA) score also increased progressively between tertiles (p < 0.01). Among the comorbidities, diabetes (p = 0.02) and smoking were more prevalent in the third cost tertile (p < 0.01) (Table 1).
Demographic and clinical characteristics of the patients in the analyzed cohort and differences according to hospital cost tertile.
| Total cohort | First tertile | Second tertile | Third tertile | p | |
|---|---|---|---|---|---|
| n = 799 | n = 266 | n = 314 | n = 219 | ||
| Time period, n (%) | 0.06 | ||||
| 1st wave | 58 (7.25) | 12 (4.5) | 25 (8) | 21 (9.6) | |
| 2nd wave | 138 (17.27) | 42 (15.8) | 59 (18.8) | 37 (9.6) | |
| 3rd wave | 169 (21.15) | 50 (18.8) | 74 (23.6) | 45 (20.5) | |
| 4th wave | 123 (15.39) | 50 (18.8) | 42 (13.4) | 31 (14.2) | |
| 5th wave | 125 (15.64) | 52 (19.8) | 48 (15.3) | 25 (11.4) | |
| 6th wave | 186 (23.27) | 60 (22.6) | 66 (21) | 60 (27.4) | |
| Patient origin (n = 766), n (%) | 0.14 | ||||
| Urgencies/emergencies | 92 (12) | 28 (30.44) | 35 (38.04) | 29 (31.52) | |
| Hospital ward | 491 (64.01) | 169 (34.42) | 204 (41.55) | 118 (24.03) | |
| Othercenter | 183 (23.89) | 57 (31.15) | 65 (35.52) | 61 (33.33) | |
| ICU delay (days), median (p25–p75) | 0 (0−2) | 0 (0−2) | 0 (0−2) | 0 (0−2) | 0.57 |
| Age (years), median (p25–p75) | 64 (52.75−72) | 58.5 (46.25−70.0) a | 64.0 (55.0−71.75) b | 67.0 (58.5−73.0) b | < 0.01 |
| SOFA, median (p25–p75) | 4 (3−5) | 4 (3−5) a | 4 (4−5) b | 5 (4−6) c | <0.01 |
| Male sex, n (%) | 550 (68.84) | 180 (32.72) | 206 (37.45) | 164 (29.81) | 0.06 |
| AHT, n (%) | 339 (42.42) | 100 (29.49) | 134 (39.52) | 105 (30.97) | 0.07 |
| CKD, n (%) | 37 (4.63) | 9 (24.32) | 14 (37.83) | 14 (37.83) | 0.28 |
| Obesity, n (%) | 132 (16.52) | 45 (34.09) | 48 (36.36) | 39 (29.54) | 0.72 |
| Diabetes, n (%) | 148 (18.52) | 41 (27.70) | 53 (35.81) | 54 (36.48) | 0.02 |
| Dyslipidemia, n (%) | 175 (21.90) | 47 (26.85) | 80 (45.71) | 48 (27.42) | 0.07 |
| Alcohol, n (%) | 64 (8.01) | 21 (7.9) | 18 (5.7) | 25 (11.4) | 0.06 |
| Smoker/smoking habit, n (%) | 234 (29.28) | 63 (23.7) | 87 (27.7) | 84 (38.4) | <0.01 |
| Vaccination status, n (%) | 0.40 | ||||
| Notvaccinated | 616 (77.01) | 205 (33.28) | 251 (40.75) | 160 (26) | |
| Incomplete vaccination | 32 (4) | 10 (31.25) | 10 (31.25) | 12 (37.5) | |
| Complete vaccination | 151 (18.90) | 51 (33.77) | 53 (35.01) | 47 (31.12) | |
The percentages of variables in the total cohort are shown over the total cohort: column percentage. The percentages of variables by cost tertile are shown over the percentage of each variable studied: row percentage. a, b, c: values with different letters indicate significant differences between groups (p < 0.01) in the post hoc comparison with Bonferroni correction.
CKD: chronic kidney disease; AHT: arterial hypertension; SOFA: Sequential Organ Failure Assessment score; ICU: Intensive Care Unit.
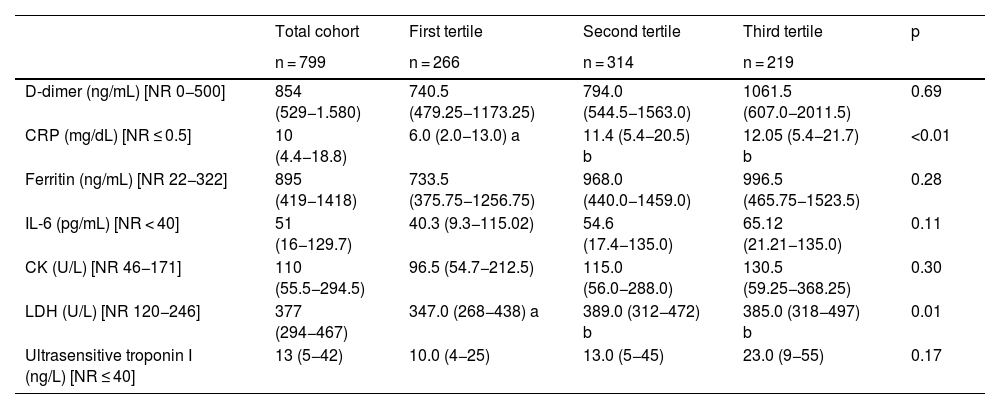
Regarding biomarkers, significant differences were observed in terms of C-reactive protein (CRP) (p < 0.01) and lactate dehydrogenase (LDH) (p = 0.01) (Table 2).
Inflammatory and tissue injury biomarkers in the analyzed cohort and according to hospital cost tertile.
| Total cohort | First tertile | Second tertile | Third tertile | p | |
|---|---|---|---|---|---|
| n = 799 | n = 266 | n = 314 | n = 219 | ||
| D-dimer (ng/mL) [NR 0−500] | 854 (529−1.580) | 740.5 (479.25−1173.25) | 794.0 (544.5−1563.0) | 1061.5 (607.0−2011.5) | 0.69 |
| CRP (mg/dL) [NR ≤ 0.5] | 10 (4.4−18.8) | 6.0 (2.0−13.0) a | 11.4 (5.4−20.5) b | 12.05 (5.4−21.7) b | <0.01 |
| Ferritin (ng/mL) [NR 22−322] | 895 (419−1418) | 733.5 (375.75−1256.75) | 968.0 (440.0−1459.0) | 996.5 (465.75−1523.5) | 0.28 |
| IL-6 (pg/mL) [NR < 40] | 51 (16−129.7) | 40.3 (9.3−115.02) | 54.6 (17.4−135.0) | 65.12 (21.21−135.0) | 0.11 |
| CK (U/L) [NR 46−171] | 110 (55.5−294.5) | 96.5 (54.7−212.5) | 115.0 (56.0−288.0) | 130.5 (59.25−368.25) | 0.30 |
| LDH (U/L) [NR 120−246] | 377 (294−467) | 347.0 (268−438) a | 389.0 (312−472) b | 385.0 (318−497) b | 0.01 |
| Ultrasensitive troponin I (ng/L) [NR ≤ 40] | 13 (5−42) | 10.0 (4−25) | 13.0 (5−45) | 23.0 (9−55) | 0.17 |
Data are expressed as median (p25–p75). a, b, c: values with different letters indicate significant differences between groups (p < 0.05) in the post hoc comparison with Bonferroni correction.
CK: creatine kinase; IL-6: interleukin-6; LDH: lactate dehydrogenase; CRP: C-reactive protein; NR: normal reference range.
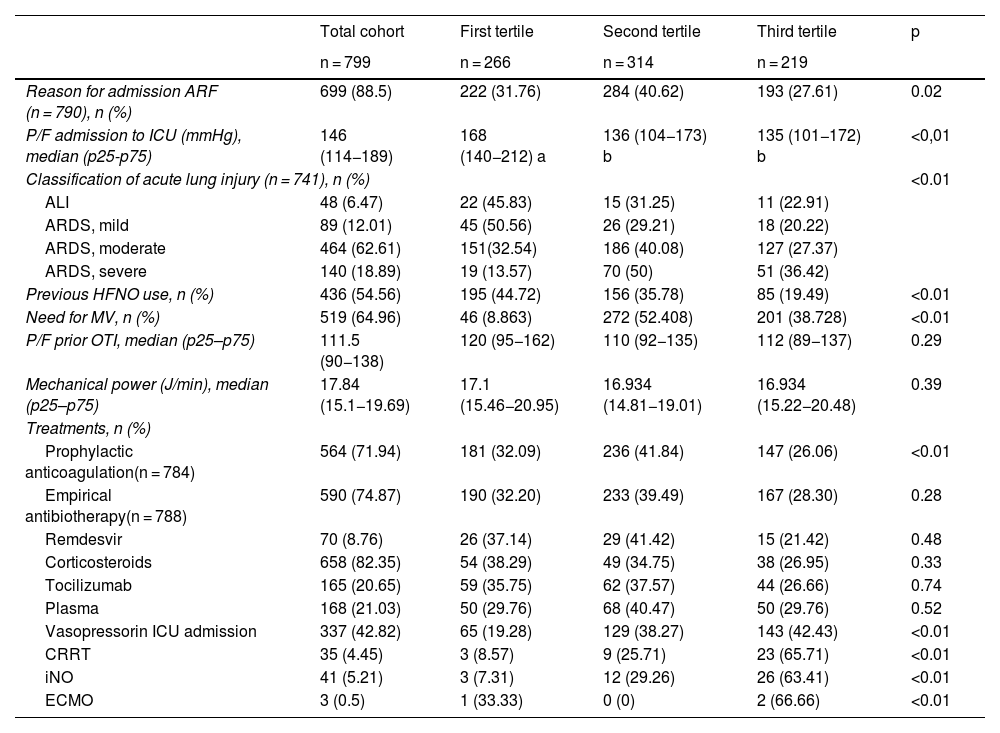
The primary reason for ICU admission was acute respiratory failure (88.5%), with significant differences observed between the tertiles (p = 0.02). The arterial oxygen pressure/fraction of inspired oxygen index at admission was lower in the second and third tertiles than in the first (p < 0.01). Most patients presented with moderate acute respiratory distress syndrome (ARDS) (62.61%), with increasing severity in the upper tertiles (p < 0.01). The use of high-flow nasal oxygen during admission to the COVID-ICU was more frequent in the first tertile (44.72%), decreasing progressively in the following tertiles (p < 0.01). The need for mechanical ventilation (MV) (64.96%) showed significant differences between the tertiles (p < 0.01) and was greater in the second and third tertiles (Table 3).
Main variables related to respiratory failure and the treatments used during COVID-ICU admission in the cohort analyzed and according to hospital cost tertile.
| Total cohort | First tertile | Second tertile | Third tertile | p | |
|---|---|---|---|---|---|
| n = 799 | n = 266 | n = 314 | n = 219 | ||
| Reason for admission ARF (n = 790), n (%) | 699 (88.5) | 222 (31.76) | 284 (40.62) | 193 (27.61) | 0.02 |
| P/F admission to ICU (mmHg), median (p25-p75) | 146 (114−189) | 168 (140−212) a | 136 (104−173) b | 135 (101−172) b | <0,01 |
| Classification of acute lung injury (n = 741), n (%) | <0.01 | ||||
| ALI | 48 (6.47) | 22 (45.83) | 15 (31.25) | 11 (22.91) | |
| ARDS, mild | 89 (12.01) | 45 (50.56) | 26 (29.21) | 18 (20.22) | |
| ARDS, moderate | 464 (62.61) | 151(32.54) | 186 (40.08) | 127 (27.37) | |
| ARDS, severe | 140 (18.89) | 19 (13.57) | 70 (50) | 51 (36.42) | |
| Previous HFNO use, n (%) | 436 (54.56) | 195 (44.72) | 156 (35.78) | 85 (19.49) | <0.01 |
| Need for MV, n (%) | 519 (64.96) | 46 (8.863) | 272 (52.408) | 201 (38.728) | <0.01 |
| P/F prior OTI, median (p25–p75) | 111.5 (90−138) | 120 (95−162) | 110 (92−135) | 112 (89−137) | 0.29 |
| Mechanical power (J/min), median (p25–p75) | 17.84 (15.1−19.69) | 17.1 (15.46−20.95) | 16.934 (14.81−19.01) | 16.934 (15.22−20.48) | 0.39 |
| Treatments, n (%) | |||||
| Prophylactic anticoagulation(n = 784) | 564 (71.94) | 181 (32.09) | 236 (41.84) | 147 (26.06) | <0.01 |
| Empirical antibiotherapy(n = 788) | 590 (74.87) | 190 (32.20) | 233 (39.49) | 167 (28.30) | 0.28 |
| Remdesvir | 70 (8.76) | 26 (37.14) | 29 (41.42) | 15 (21.42) | 0.48 |
| Corticosteroids | 658 (82.35) | 54 (38.29) | 49 (34.75) | 38 (26.95) | 0.33 |
| Tocilizumab | 165 (20.65) | 59 (35.75) | 62 (37.57) | 44 (26.66) | 0.74 |
| Plasma | 168 (21.03) | 50 (29.76) | 68 (40.47) | 50 (29.76) | 0.52 |
| Vasopressorin ICU admission | 337 (42.82) | 65 (19.28) | 129 (38.27) | 143 (42.43) | <0.01 |
| CRRT | 35 (4.45) | 3 (8.57) | 9 (25.71) | 23 (65.71) | <0.01 |
| iNO | 41 (5.21) | 3 (7.31) | 12 (29.26) | 26 (63.41) | <0.01 |
| ECMO | 3 (0.5) | 1 (33.33) | 0 (0) | 2 (66.66) | <0.01 |
The percentages of variables in the total cohort are shown over the total cohort: column percentage. The percentages of variables by cost tertile are shown over the percentage of each variable studied: row percentage. a, b, c: values with different letters indicate significant differences between groups (p < 0.05) in the post hoc comparison with Bonferroni correction.
ALI: acute lung injury; HFNO: high-flow nasal oxygen; ECMO: extracorporeal membrane oxygenation; iNO: inhaled nitric oxide; OTI: orotracheal intubation; ARF: acute respiratory failure; P/F: arterial oxygen pressure/fraction of inspired oxygen ratio; ARDS: acute respiratory distress syndrome; CRRT: continuous renal replacement therapy; ICU: Intensive Care Unit; MV: mechanical ventilation.
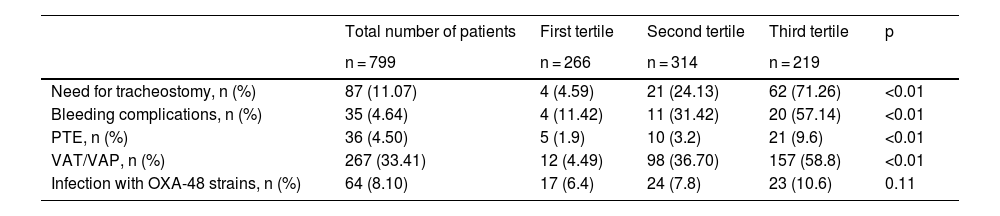
Prophylactic anticoagulation was administered in 71.94% of the patients, with differences between tertiles (p < 0.01); however, empirical antibiotherapy showed no significant differences. The use of vasopressors at admission was more frequent in the third tertile (p < 0.01). Advanced treatments, such as continuous renal replacement therapy, inhaled nitric oxide, and extracorporeal membrane oxygenation (ECMO), were used more frequently in patients in the third cost tertile, with significant differences (p < 0.01) (Table 3).
Table 4 shows the main adverse effects during admission to the COVID-ICU of the analyzed cohort, categorized by hospital cost tertile.
Main adverse effects during admission to the COVID-ICU of the analyzed cohort and according to categorization by hospital cost tertiles.
| Total number of patients | First tertile | Second tertile | Third tertile | p | |
|---|---|---|---|---|---|
| n = 799 | n = 266 | n = 314 | n = 219 | ||
| Need for tracheostomy, n (%) | 87 (11.07) | 4 (4.59) | 21 (24.13) | 62 (71.26) | <0.01 |
| Bleeding complications, n (%) | 35 (4.64) | 4 (11.42) | 11 (31.42) | 20 (57.14) | <0.01 |
| PTE, n (%) | 36 (4.50) | 5 (1.9) | 10 (3.2) | 21 (9.6) | <0.01 |
| VAT/VAP, n (%) | 267 (33.41) | 12 (4.49) | 98 (36.70) | 157 (58.8) | <0.01 |
| Infection with OXA-48 strains, n (%) | 64 (8.10) | 17 (6.4) | 24 (7.8) | 23 (10.6) | 0.11 |
The percentages of variables in the total cohort are shown over the total cohort: column percentage. The percentages of variables by cost tertile are shown over the percentage of each variable studied: row percentage.
OXA-48: oxacillinase-48; VAT/VAP: ventilator-associated tracheobronchitis/pneumonia; PTE: pulmonary thromboembolism.
A significant increase in MV days was also observed as the cost tertiles progressed, with a median of 2 days (p25–p75: 0–7) in the first tertile, 7 days (p25–p75: 4–11) in the second, and 16 days (p25–p75: 10−29.25) in the third tertile (p < 0.01). The median length of stay in COVID-ICU for patients with a diagnosis of SARS-CoV-2 infection also increased progressively, with medians of 4 days (p25–p75: 2–6), 9 days (p25–p75: 6–13), and 20 days (p25–p75: 14–35) in the respective cost tertiles (p < 0.01). Similarly, the total hospital stays increased significantly, with medians of 11 days (p25–p75: 9–15), 17 days (p25–p75: 13–24), and 28 days (p25–p75: 22–41) in the respective cost tertiles (p < 0.01).
In terms of mortality, patients in the first tertile had considerably lower mortality compared to the other groups. Twenty-eight-day mortality was 9.46% in the first tertile, compared to 47.30% in the second and 43.24% in the third (p < 0.01). This trend continued with mortality rates at 60 days (7.00%, 40.00% and 53.00%, respectively; p < 0.01) and 90 days (6.93%, 39.60% and 53.47%, respectively; p < 0.01).
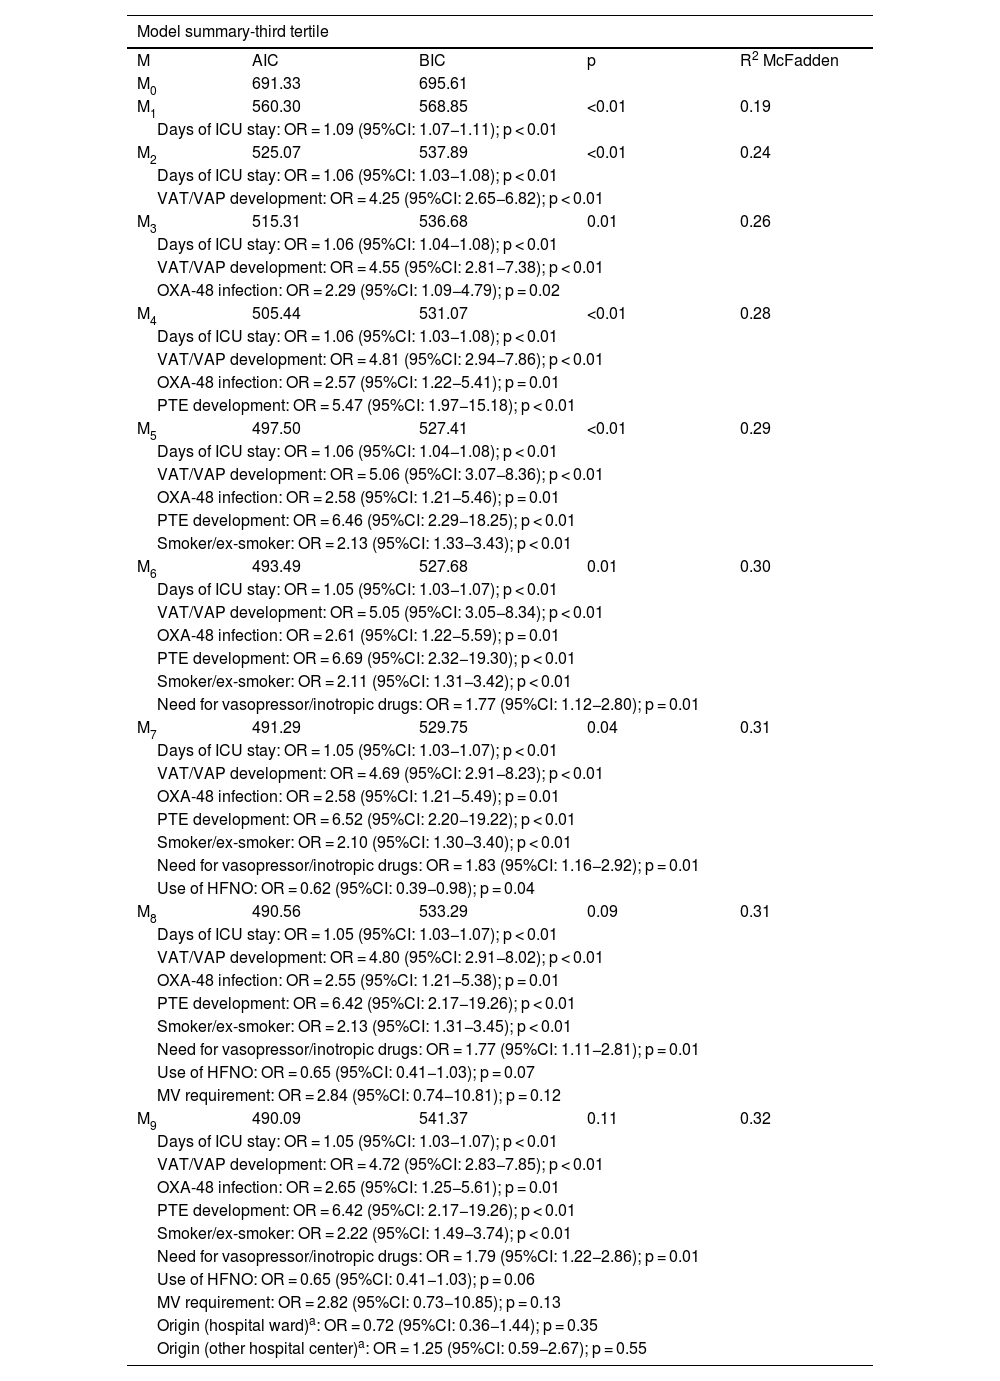
Logistic regression modelsAfter adding ICU days of stay (M1), the AIC decreased to 560.30, and the BIC decreased to 568.85 (p < 0.01). McFadden's R2 increased to 0.19, with an OR of 1.09 (95%CI: 1.07−1.11; p < 0.01). In M2, on also including the development of ventilator-associated tracheobronchitis/pneumonia (VAT/VAP), AIC decreased to 525.07, BIC to 537.89 (p < 0.01), and R2 increased to 0.24. The ORs were 1.06 (95%CI: 1.03−1.08; p < 0.01) for ICU stay and 4.25 (95%CI: 2.65−6.82; p < 0.01) for VAT/VAP. With the addition of OXA-48 infection in M3, AIC was 515.31 and BIC was 536.68 (p = 0.01; R2 = 0.26), yielding an OR of 1.06 (95%CI: 1.04−1.08; p < 0.01) for stay, 4.55 (95%CI: 2.81−7.38; p < 0.01) for VAT/VAP, and 2.29 (95%CI: 1.09−4.79; p = 0.02) for OXA-48. On incorporating the development of pulmonary thromboembolism (PTE) in M4, AIC dropped to 505.44 and BIC to 531.07 (p < 0.01; R2 = 0.28), yielding an OR of 1.06 (95%CI: 1.03−1.08; p < 0.01) for stay, 4.81 (95%CI: 2.94−7.86; p < 0.01) for VAT/VAP, 2.57 (95%CI: 1.22−5.41; p = 0.01) for OXA-48 infection, and 5.47 (95CI: 1.97−15.18; p < 0.01) for PTE. The inclusion of smoking in M5 further reduced AIC to 497.50 and BIC to 527.41 (p < 0.01; R2 = 0.29), adding an OR of 2.13 (95%CI: 1.33−3.43; p < 0.01). On summing the need for vasopressor/inotropic drugs in M6, AIC was 493.49 and BIC was 527.68 (p = 0.01; R2 = 0.30), with an OR of 1.77 (95%CI: 1.12−2.80; p = 0.01). In M7, we incorporated the use of high-flow nasal oxygen, obtaining an AIC of 491.29, a BIC of 529.75 (p = 0.04; R2 = 0.31), and an OR of 0.62 (95%CI: 0.39−0.98; p = 0.04). Finally, addition of the need for MV in M8 (AIC = 490.56; BIC = 533.29; p = 0.09; R2 = 0.31) and of the origin of admission (ward or other center) in M9 (AIC = 490.09; BIC = 541.37; p = 0.11; R2 = 0.32) did not provide significant improvements or additional relevant predictors (Table 5).
Logistic regression models.
| Model summary-third tertile | ||||
|---|---|---|---|---|
| M | AIC | BIC | p | R2 McFadden |
| M0 | 691.33 | 695.61 | ||
| M1 | 560.30 | 568.85 | <0.01 | 0.19 |
| Days of ICU stay: OR = 1.09 (95%CI: 1.07−1.11); p < 0.01 | ||||
| M2 | 525.07 | 537.89 | <0.01 | 0.24 |
| Days of ICU stay: OR = 1.06 (95%CI: 1.03−1.08); p < 0.01 | ||||
| VAT/VAP development: OR = 4.25 (95%CI: 2.65−6.82); p < 0.01 | ||||
| M3 | 515.31 | 536.68 | 0.01 | 0.26 |
| Days of ICU stay: OR = 1.06 (95%CI: 1.04−1.08); p < 0.01 | ||||
| VAT/VAP development: OR = 4.55 (95%CI: 2.81−7.38); p < 0.01 | ||||
| OXA-48 infection: OR = 2.29 (95%CI: 1.09−4.79); p = 0.02 | ||||
| M4 | 505.44 | 531.07 | <0.01 | 0.28 |
| Days of ICU stay: OR = 1.06 (95%CI: 1.03−1.08); p < 0.01 | ||||
| VAT/VAP development: OR = 4.81 (95%CI: 2.94−7.86); p < 0.01 | ||||
| OXA-48 infection: OR = 2.57 (95%CI: 1.22−5.41); p = 0.01 | ||||
| PTE development: OR = 5.47 (95%CI: 1.97−15.18); p < 0.01 | ||||
| M5 | 497.50 | 527.41 | <0.01 | 0.29 |
| Days of ICU stay: OR = 1.06 (95%CI: 1.04−1.08); p < 0.01 | ||||
| VAT/VAP development: OR = 5.06 (95%CI: 3.07−8.36); p < 0.01 | ||||
| OXA-48 infection: OR = 2.58 (95%CI: 1.21−5.46); p = 0.01 | ||||
| PTE development: OR = 6.46 (95%CI: 2.29−18.25); p < 0.01 | ||||
| Smoker/ex-smoker: OR = 2.13 (95%CI: 1.33−3.43); p < 0.01 | ||||
| M6 | 493.49 | 527.68 | 0.01 | 0.30 |
| Days of ICU stay: OR = 1.05 (95%CI: 1.03−1.07); p < 0.01 | ||||
| VAT/VAP development: OR = 5.05 (95%CI: 3.05−8.34); p < 0.01 | ||||
| OXA-48 infection: OR = 2.61 (95%CI: 1.22−5.59); p = 0.01 | ||||
| PTE development: OR = 6.69 (95%CI: 2.32−19.30); p < 0.01 | ||||
| Smoker/ex-smoker: OR = 2.11 (95%CI: 1.31−3.42); p < 0.01 | ||||
| Need for vasopressor/inotropic drugs: OR = 1.77 (95%CI: 1.12−2.80); p = 0.01 | ||||
| M7 | 491.29 | 529.75 | 0.04 | 0.31 |
| Days of ICU stay: OR = 1.05 (95%CI: 1.03−1.07); p < 0.01 | ||||
| VAT/VAP development: OR = 4.69 (95%CI: 2.91−8.23); p < 0.01 | ||||
| OXA-48 infection: OR = 2.58 (95%CI: 1.21−5.49); p = 0.01 | ||||
| PTE development: OR = 6.52 (95%CI: 2.20−19.22); p < 0.01 | ||||
| Smoker/ex-smoker: OR = 2.10 (95%CI: 1.30−3.40); p < 0.01 | ||||
| Need for vasopressor/inotropic drugs: OR = 1.83 (95%CI: 1.16−2.92); p = 0.01 | ||||
| Use of HFNO: OR = 0.62 (95%CI: 0.39−0.98); p = 0.04 | ||||
| M8 | 490.56 | 533.29 | 0.09 | 0.31 |
| Days of ICU stay: OR = 1.05 (95%CI: 1.03−1.07); p < 0.01 | ||||
| VAT/VAP development: OR = 4.80 (95%CI: 2.91−8.02); p < 0.01 | ||||
| OXA-48 infection: OR = 2.55 (95%CI: 1.21−5.38); p = 0.01 | ||||
| PTE development: OR = 6.42 (95%CI: 2.17−19.26); p < 0.01 | ||||
| Smoker/ex-smoker: OR = 2.13 (95%CI: 1.31−3.45); p < 0.01 | ||||
| Need for vasopressor/inotropic drugs: OR = 1.77 (95%CI: 1.11−2.81); p = 0.01 | ||||
| Use of HFNO: OR = 0.65 (95%CI: 0.41−1.03); p = 0.07 | ||||
| MV requirement: OR = 2.84 (95%CI: 0.74−10.81); p = 0.12 | ||||
| M9 | 490.09 | 541.37 | 0.11 | 0.32 |
| Days of ICU stay: OR = 1.05 (95%CI: 1.03−1.07); p < 0.01 | ||||
| VAT/VAP development: OR = 4.72 (95%CI: 2.83−7.85); p < 0.01 | ||||
| OXA-48 infection: OR = 2.65 (95%CI: 1.25−5.61); p = 0.01 | ||||
| PTE development: OR = 6.42 (95%CI: 2.17−19.26); p < 0.01 | ||||
| Smoker/ex-smoker: OR = 2.22 (95%CI: 1.49−3.74); p < 0.01 | ||||
| Need for vasopressor/inotropic drugs: OR = 1.79 (95%CI: 1.22−2.86); p = 0.01 | ||||
| Use of HFNO: OR = 0.65 (95%CI: 0.41−1.03); p = 0.06 | ||||
| MV requirement: OR = 2.82 (95%CI: 0.73−10.85); p = 0.13 | ||||
| Origin (hospital ward)a: OR = 0.72 (95%CI: 0.36−1.44); p = 0.35 | ||||
| Origin (other hospital center)a: OR = 1.25 (95%CI: 0.59−2.67); p = 0.55 | ||||
AIC: Akaike information criterion; BIC: Bayesian information criterion; HFNO: high-flow nasal oxygen; 95%CI: 95% confidence interval; OR: odds ratio; OXA-48: oxacillinase-48; VAT/VAP: ventilator-associated tracheobronchitis/pneumonia; PTE: pulmonary thromboembolism; ICU: Intensive Care Unit; MV: mechanical ventilation.
The area under the curve (AUC) obtained was 0.866, with p < 0.01 (Fig. 2).
Discussion
Despite the significant healthcare costs associated with critical care, relatively few cost studies have been published in this field (an average of 4.6 studies per year). The current trend is to use hypothetical cohorts and modeling scenarios without proven clinical data.9
The present study identifies a set of admission-to-a-COVID-ICU variables that are independently associated with higher hospital costs. These variables include length of ICU stay, the development of VAT/VAP, OXA-48 infection, the presence of PTE, a history of smoking, and the need for vasopressor or inotropic drugs.
Our analysis provides evidence that, while predictable, is nonetheless relevant and may generate an interesting debate. One clear example is the relationship between the length of stay in a COVID-ICU and hospital costs. It is a well-documented fact that ICU hospital days are an independent predictor of higher costs, given that the required resources (including staffing, drug use, and diagnostic procedures) account for approximately 20% of total hospital expenditures.10 A French study conducted before the pandemic had already identified the length of ICU stay as an independent determinant of hospital cost (r = 0.716; p < 0.0001).11 In this context, it is important to note that European studies in countries such as France and Germany have shown that up to 62% of ICU costs are directly related to staffing and the hospital level involved.12
On the other hand, in order to understand the estimation of incremental costs due to an increased length of stay because of adverse events (VAT/VAP, PTE, and OXA-48 infection) during an ICU stay, it is crucial to understand exposure as a time-varying factor. This will help us avoid temporal bias, which occurs when we implicitly assume that the conditions are present from the time of admission. This leads to an overestimation of the incremental effect. In this regard, Bluhmki et al. recognized this issue and correctly estimated the excess hospital stay associated with VAP using multistate models that account for the temporal dynamics of ventilatory status and VAP occurrence. They also considered that ignoring the time dependence of VAP would result in an overestimation of 15 days, substantially higher than the more accurate estimate of 3.52 days. The same could occur in studies such as ours. Although cost data are available, omitting the time dependence of exposure could lead to a significant overestimation of the real effect.13,14
Results from previous studies highlight MV as a major driver of ICU costs (an increase of nearly 30%), though they demonstrate significant variability in costs associated with different underlying diseases and adverse events in ICU settings.15,16 In the case of acute respiratory distress syndrome, small reductions in ICU length of stay may benefit patients, but do not lead to significant reductions in overall hospital costs. Early discharge to post-acute care facilities may reduce hospital costs but is unlikely to significantly reduce the total cost of an illness episode.17
PTE was a complication closely related to COVID-19 disease, standing out as a differential factor in the pathophysiology of acute respiratory distress syndrome associated with the virus. This characteristic influenced not only the severity and clinical course of the patients but also their therapeutic management. In the pre-pandemic literature, PTE is described as a condition in which nursing costs are the most significant component, far exceeding pharmacy and radiology costs, which are comparable. However, two other important considerations are that the treatment costs during the first year after hospital discharge are high, and on the other hand, that an increasing burden of comorbid diseases is strongly associated with an increase in the real cost of caring for hospitalized patients with PTE.18–20
From a health economics perspective, infections caused by OXA-48-producing bacteria are part of the broader challenge of multidrug-resistant pathogen infections. Several studies have shown that the cost of care for patients with infections caused by resistant bacteria is significantly higher than for those with infections caused by susceptible pathogens. This increase is attributed to a longer duration of illness, the need for additional diagnostic tests, prolonged hospital stays, the use of high-cost antimicrobials, and a higher mortality rate.21 The magnitude of the problem is considerable. Infections caused by resistant microorganisms could result in a 1.1% reduction in global gross domestic product. In a low-impact scenario, these infections could cause economic losses exceeding $1 trillion per year after 2030. In this context, accurately estimating the burden of these infections is essential for designing effective prevention and control strategies and allocating healthcare resources rationally. Solid evidence from the literature shows that certain interventions, such as implementing antimicrobial use management programs, are effective in improving compliance with rational prescribing and reducing both the use and duration of antibiotic therapy, thereby leading to a decrease in hospital stays and costs.21,22
Regarding smoking, a study conducted from the start of the pandemic until July 15, 2020, at a Spanish hospital revealed that smokers experienced a higher incidence of complications during their hospital stay, particularly respiratory and cardiac issues. These patients were also associated with a poorer prognosis in terms of the need for ICU admission and mortality, which increased the cost of managing smokers with COVID-19 by 14.72%.23 Other studies have also shown that being a smoker or ex-smoker is associated with higher daily costs.24
This study has several limitations. First, the retrospective and single-center design may limit the generalizability of the findings to other hospitals with different cost structures and clinical management protocols. Furthermore, although APR-DRG is a widely used tool for hospital cost categorization, it might not capture all the particularities of resource consumption in the ICU for patients with COVID. Likewise, social or environmental factors that could influence the length of stay and costs were not considered. Finally, the presence of residual confounding factors not included in the model cannot be ruled out.
CRediT authorship contribution statementAlejandro González-Castro: ideation, preparation, and drafting of the manuscript.
Carmen Huertas: text ideation, database filtering, data collection.
Trinidad Dierssen-Soto: statistical analysis.
Elena Cuenca-Fito: data collection.
Yhivian Peñasco: manuscript elaboration and proofreading.
Reinhard Wallmann: data collection.
Raquel Ferrero-Franco: database filtering.
Juan Carlos Rodríguez-Borregán: manuscript elaboration and proofreading.
Source of financingThe present study has not received funding from any source.
Declaration of Generative AI and AI-assisted technologies in the writing processTo support the structuring of the text and improve its clarity and coherence, we used artificial intelligence to assist in the writing and synthesis of this manuscript. Specifically, we used ChatGPT. The authors developed the interpretation of the data, critical analysis, and conclusions of the study entirely on their own.
The authors declare that they have no conflicts of interest in this work.
The following is Supplementary data to this article:

