

Edited by: Rosario Amaya Villar - Unidad de Cuidados Intensivos, Hospital Universitario Virgen del Rocio, Sevilla, España
Last update: January 2025
More infoIt has been proposed that SARS CoV2 patients who require invasive mechanical ventilation (MV) might represent a particular type of ARDS with a different ventilatory profile. On the other hand, they may also present with a distinct physiopathology element, consisting of a blunted hypoxic pulmonary vasoconstriction (HPV).1
Two SARS-Cov2 ARDS phenotypes have been described by Gattinoni et al. The majority of these patients represent Type L, characterized by higher compliance, and for which lower pressure ventilation is recommended because they don’t have an extensive recruitable area and higher PEEP levels could negatively impact the right ventricle (RV).2 Therefore, we might expect a specific hemodynamic profile, with less prevalence of RV failure. Hemodynamic profile of COVID-19 patients based on echocardiographic features have been previously described.3,4
The main objective of our study was to describe how MV (FiO2 and PEEP) in patients with ARDS caused by SARS-CoV2 affects hemodynamics. Hemodynamic response was evaluated by conventional monitoring (invasive blood pressure monitoring) as well as echocardiography.
During the first and second wave of the COVID-19 pandemic we performed a single-centre, prospective, observational study, which included consecutive patients with a diagnosis of ARDS caused by SARS-CoV2 who required treatment with invasive MV. Inclusion criteria stated that patients were >18 y.o, had no previous cardiac nor respiratory chronic condition and were in the first 72 h of MV. The patients were treated with a protective ventilatory strategy, following the ARDSnet ventilation approach.
Study variable were hemodynamic parameters, echocardiographic biventricular function and respiratory mechanics.
Two transthoracic echocardiograms separated by an interval of 30 min, were performed during the first 72 h after initiation of MV. All patients were managed with a low PEEP high FiO2 strategy which was the ventilatory approach of our unit, to keep a SaO2 > 90%. The first echocardiogram (baseline) was done with ventilatory parameters set by the attending physician, without any additional intervention. The second echocardiogram was performed after a period of 30 min, either increasing the PEEP 2–4 cmH2O if a FiO2 > 60% was necessary to reach the SaO2 goal or increasing the FiO2 to 100% if the SaO2 goal were reached with a lower FiO2, observe the hemodynamic response. After this maneuver, the patient was treated with the baseline ventilator settings.
Previously to the realization of the echocardiogram, arterial blood gas analysis was performed.
We included 20 patients, with moderate ARDS (baseline PaO2/FiO2 162,69 ± 58.80). Respiratory and hemodynamic variables are shown in Table 1. Except for one patient who needed low dose norepinephrine support, all patients showed hemodynamic stability with a mean arterial pressure (MAP) of 84.52 ± 13.09.
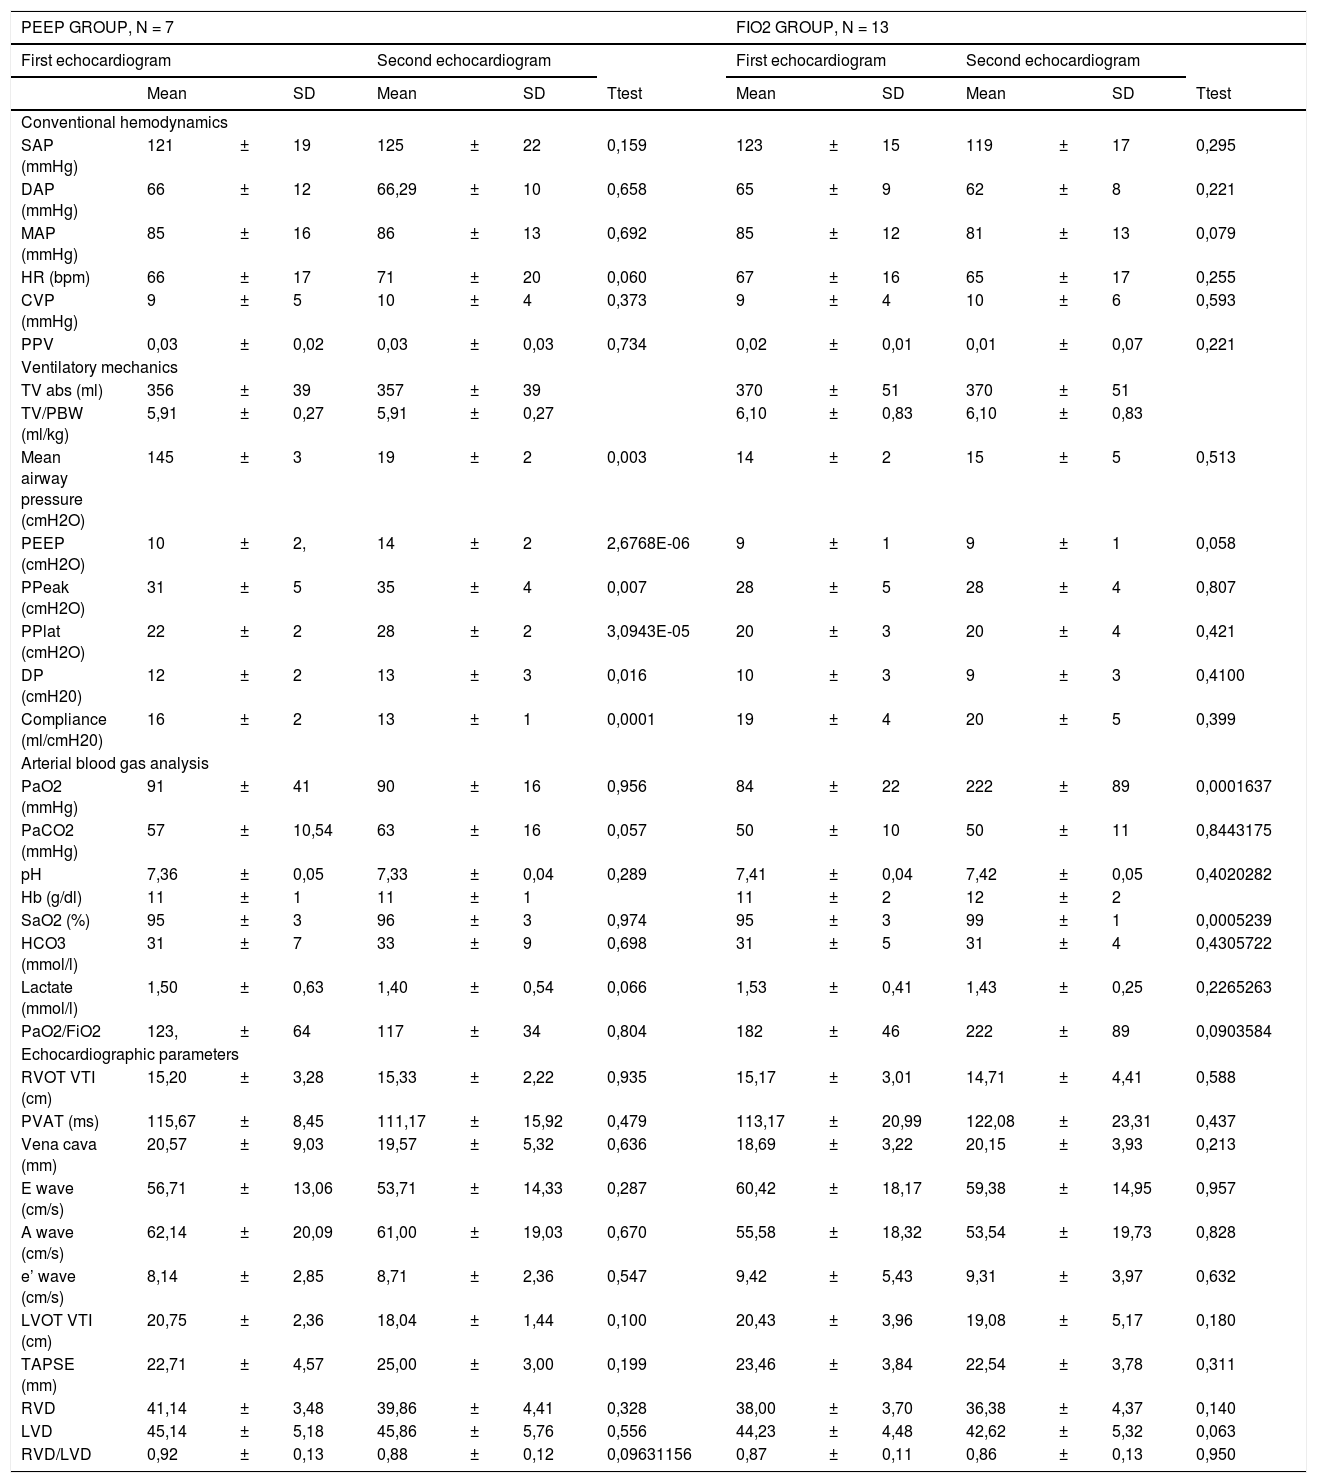
Study variables are shown: conventional hemodynamics, ventilatory mechanics, arterial blood gas analysis and echocardiographic parameters. The two groups PEEP and FiO2 were created depending on the Fi02 requirements in order to maintain SaO2 > 90%, as described in the text. The first echocardiogram was performed with mechanical ventilation set by the attending physician. The second echocardiogram was performed after mechanical ventilation changes described in the text.
| PEEP GROUP, N = 7 | FIO2 GROUP, N = 13 | |||||||||||||
|---|---|---|---|---|---|---|---|---|---|---|---|---|---|---|
| First echocardiogram | Second echocardiogram | First echocardiogram | Second echocardiogram | |||||||||||
| Mean | SD | Mean | SD | Ttest | Mean | SD | Mean | SD | Ttest | |||||
| Conventional hemodynamics | ||||||||||||||
| SAP (mmHg) | 121 | ± | 19 | 125 | ± | 22 | 0,159 | 123 | ± | 15 | 119 | ± | 17 | 0,295 |
| DAP (mmHg) | 66 | ± | 12 | 66,29 | ± | 10 | 0,658 | 65 | ± | 9 | 62 | ± | 8 | 0,221 |
| MAP (mmHg) | 85 | ± | 16 | 86 | ± | 13 | 0,692 | 85 | ± | 12 | 81 | ± | 13 | 0,079 |
| HR (bpm) | 66 | ± | 17 | 71 | ± | 20 | 0,060 | 67 | ± | 16 | 65 | ± | 17 | 0,255 |
| CVP (mmHg) | 9 | ± | 5 | 10 | ± | 4 | 0,373 | 9 | ± | 4 | 10 | ± | 6 | 0,593 |
| PPV | 0,03 | ± | 0,02 | 0,03 | ± | 0,03 | 0,734 | 0,02 | ± | 0,01 | 0,01 | ± | 0,07 | 0,221 |
| Ventilatory mechanics | ||||||||||||||
| TV abs (ml) | 356 | ± | 39 | 357 | ± | 39 | 370 | ± | 51 | 370 | ± | 51 | ||
| TV/PBW (ml/kg) | 5,91 | ± | 0,27 | 5,91 | ± | 0,27 | 6,10 | ± | 0,83 | 6,10 | ± | 0,83 | ||
| Mean airway pressure (cmH2O) | 145 | ± | 3 | 19 | ± | 2 | 0,003 | 14 | ± | 2 | 15 | ± | 5 | 0,513 |
| PEEP (cmH2O) | 10 | ± | 2, | 14 | ± | 2 | 2,6768E-06 | 9 | ± | 1 | 9 | ± | 1 | 0,058 |
| PPeak (cmH2O) | 31 | ± | 5 | 35 | ± | 4 | 0,007 | 28 | ± | 5 | 28 | ± | 4 | 0,807 |
| PPlat (cmH2O) | 22 | ± | 2 | 28 | ± | 2 | 3,0943E-05 | 20 | ± | 3 | 20 | ± | 4 | 0,421 |
| DP (cmH20) | 12 | ± | 2 | 13 | ± | 3 | 0,016 | 10 | ± | 3 | 9 | ± | 3 | 0,4100 |
| Compliance (ml/cmH20) | 16 | ± | 2 | 13 | ± | 1 | 0,0001 | 19 | ± | 4 | 20 | ± | 5 | 0,399 |
| Arterial blood gas analysis | ||||||||||||||
| PaO2 (mmHg) | 91 | ± | 41 | 90 | ± | 16 | 0,956 | 84 | ± | 22 | 222 | ± | 89 | 0,0001637 |
| PaCO2 (mmHg) | 57 | ± | 10,54 | 63 | ± | 16 | 0,057 | 50 | ± | 10 | 50 | ± | 11 | 0,8443175 |
| pH | 7,36 | ± | 0,05 | 7,33 | ± | 0,04 | 0,289 | 7,41 | ± | 0,04 | 7,42 | ± | 0,05 | 0,4020282 |
| Hb (g/dl) | 11 | ± | 1 | 11 | ± | 1 | 11 | ± | 2 | 12 | ± | 2 | ||
| SaO2 (%) | 95 | ± | 3 | 96 | ± | 3 | 0,974 | 95 | ± | 3 | 99 | ± | 1 | 0,0005239 |
| HCO3 (mmol/l) | 31 | ± | 7 | 33 | ± | 9 | 0,698 | 31 | ± | 5 | 31 | ± | 4 | 0,4305722 |
| Lactate (mmol/l) | 1,50 | ± | 0,63 | 1,40 | ± | 0,54 | 0,066 | 1,53 | ± | 0,41 | 1,43 | ± | 0,25 | 0,2265263 |
| PaO2/FiO2 | 123, | ± | 64 | 117 | ± | 34 | 0,804 | 182 | ± | 46 | 222 | ± | 89 | 0,0903584 |
| Echocardiographic parameters | ||||||||||||||
| RVOT VTI (cm) | 15,20 | ± | 3,28 | 15,33 | ± | 2,22 | 0,935 | 15,17 | ± | 3,01 | 14,71 | ± | 4,41 | 0,588 |
| PVAT (ms) | 115,67 | ± | 8,45 | 111,17 | ± | 15,92 | 0,479 | 113,17 | ± | 20,99 | 122,08 | ± | 23,31 | 0,437 |
| Vena cava (mm) | 20,57 | ± | 9,03 | 19,57 | ± | 5,32 | 0,636 | 18,69 | ± | 3,22 | 20,15 | ± | 3,93 | 0,213 |
| E wave (cm/s) | 56,71 | ± | 13,06 | 53,71 | ± | 14,33 | 0,287 | 60,42 | ± | 18,17 | 59,38 | ± | 14,95 | 0,957 |
| A wave (cm/s) | 62,14 | ± | 20,09 | 61,00 | ± | 19,03 | 0,670 | 55,58 | ± | 18,32 | 53,54 | ± | 19,73 | 0,828 |
| e’ wave (cm/s) | 8,14 | ± | 2,85 | 8,71 | ± | 2,36 | 0,547 | 9,42 | ± | 5,43 | 9,31 | ± | 3,97 | 0,632 |
| LVOT VTI (cm) | 20,75 | ± | 2,36 | 18,04 | ± | 1,44 | 0,100 | 20,43 | ± | 3,96 | 19,08 | ± | 5,17 | 0,180 |
| TAPSE (mm) | 22,71 | ± | 4,57 | 25,00 | ± | 3,00 | 0,199 | 23,46 | ± | 3,84 | 22,54 | ± | 3,78 | 0,311 |
| RVD | 41,14 | ± | 3,48 | 39,86 | ± | 4,41 | 0,328 | 38,00 | ± | 3,70 | 36,38 | ± | 4,37 | 0,140 |
| LVD | 45,14 | ± | 5,18 | 45,86 | ± | 5,76 | 0,556 | 44,23 | ± | 4,48 | 42,62 | ± | 5,32 | 0,063 |
| RVD/LVD | 0,92 | ± | 0,13 | 0,88 | ± | 0,12 | 0,09631156 | 0,87 | ± | 0,11 | 0,86 | ± | 0,13 | 0,950 |
SAP - Systolic Arterial Pressure, DAP - Dyastolic Arterial Pressure, MAP - Mean Arterial Pressure, HR - Heart Rate, CVP - Central Venous Pressure, PPV - Pulse Pressure Variation, RA - right atrium PPlat – Plateau Pressure, PPeak – peak pressure, FiO2 - Fraction of inspired oxygen, PaO2 - Partial Pressure of Oxygen, PaCO2 - Partial Pressure of Carbon Dioxide, Hb – Hemoglobin, SaO2 - Oxygen Saturation, LVOT VTI - Left Ventricular Outflow Tract Velocity Time Integral, RVOT VTI - Right Ventricular Outflow Tract Velocity Time Integral, PVAT - Pulmonary Velocity Acceleration Time, TAPSE - Tricuspid Annular Plane Systolic Excursion, RVD - Right Ventricular Diameter, LVD - Left Ventricular Diameter, SD - standard deviation, DP - driving pressure, PBW - predicted body weight.
We observed that in both groups, ventilatory changes did not have a significant effect on hemodynamics except for a trend to a decrease in pulmonary acceleration time in the PEEP group (115,67 ± 8,45 ms baseline vs 111,17 ± 15.91 ms, P = .47).
All patients had preserved both left and right ventricular ejection fraction. None of the patients developed RV failure.
In the PEEP group, the slight increase in PEEP worsened pulmonary compliance but this was not followed by a hemodynamic worsening.
Despite the low oxygenation levels, this cohort of patients with SARS CoV2 shows that MV caused a low impact on hemodynamics. We obtained two groups of patients in which we observe that despite the differences in oxygenation (ratio of arterial partial pressure of oxygen to fraction of inspired oxygen PaO2/FiO2 (116,98 ± 34,10 in PEEP group vs 222,46 ± 88,96 in FiO2 group, P = ,001) the hemodynamic behavior is similar. All patients except one showed hemodynamic stability and they all presented a preserved RV function.
Despite that the most frequently observed phenotype was Type L, our cohort consists entirely of patients with phenotype H. However, the patients in our study present low systemic hemodynamic compromise, low right and left ventricular impact because of the changes in MV (PEEP and FiO2). A possible explanation could be the described abolition of the HPV. This circumstance would avoid the increment in pulmonary vascular resistance and RV compromise, despite low alveolar O2 pressure and collapse. Moreover, given the use of low PEEP in our patients, the creation of overdistension areas could be avoided, along with capillary collapse and RV overload. Given the low RV compromise, we would probably trigger low LV compromise due to septal interdependence, which would explain at least in part the low systemic compromise, at least in our series. Regarding the low impact of the changes in MV, this could be explained by 1) due to the lack of hypothetical HPV, there would be little vasoreactivity to the O2 changes (there wouldn’t be any vasoconstriction relief when increasing the FiO2) therefore no changes are observed in theFiO2 change group) although it is highly probable that the monitoring techniques we used are not sensitive enough to detect the changes. 2) In the PEEP change group although an overdistention trend was observed, a possible explanation of the observed low hemodynamic impact could be precisely the low PEEP that was used, probably starting at low transpulmonary pressure and low end expiratory volumes. The increment in these two last variables, as a consequence of PEEP increment, could have not resulted in an excessively unfavourable situation for the relation between the pulmonary volume and pulmonary vascular resistance.
Our study is concordant with the hemodynamic findings mentioned by Evrard et al.,4 the size of the cohort being similar. However, in our sample, as mentioned, no patient showed ventricular dysfunction.
An increase in PEEP tended to worsen pulmonary mechanics but without an enormous impact in hemodynamics.
The main limitation of the study is the small sample size which does not allow to draw more generalized conclusions regarding the objective of our research. Another limitation of our study is that the hemodynamic monitoring did not include advanced techniques that are able to detect cardiovascular change with high sensitivity.
Our result regarding the impact of MV on hemodynamics may be relevant at the time of choosing the best management strategy for this kind of patients.
In memoriam
In memoriam of our dear friend, Juan Martinez-Milla MD, PhD, who will always belong to the heart of our team.