


The COVID-19 pandemic has threatened to collapse hospital and ICU services, and it has affected the care programs for non-COVID patients. The objective was to develop a mathematical model designed to optimize predictions related to the need for hospitalization and ICU admission by COVID-19 patients.
DesignProspective study.
SettingProvince of Granada (Spain).
PopulationCOVID-19 patients hospitalized, admitted to ICU, recovered and died from March 15 to September 22, 2020.
Study variablesThe number of patients infected with SARS-CoV-2 and hospitalized or admitted to ICU for COVID-19.
ResultsThe data reported by hospitals was used to develop a mathematical model that reflects the flow of the population among the different interest groups in relation to COVID-19. This tool allows to analyse different scenarios based on socio-health restriction measures, and to forecast the number of people infected, hospitalized and admitted to the ICU.
ConclusionsThe mathematical model is capable of providing predictions on the evolution of the COVID-19 sufficiently in advance as to anticipate the peaks of prevalence and hospital and ICU care demands, and also the appearance of periods in which the care for non-COVID patients could be intensified.
La pandemia de la COVID-19 ha supuesto una amenaza de colapso de los servicios hospitalarios y de unidades de cuidado intensivo (UCI), así como una reducción de la dinámica asistencial de pacientes afectados por otras patologías. El objetivo fue desarrollar un modelo matemático diseñado para optimizar las predicciones relacionadas con las necesidades de hospitalización e ingresos en UCI por la COVID-19.
DiseñoEstudio prospectivo.
ÁmbitoProvincia de Granada (España).
PacientesPacientes de COVID-19 hospitalizados, ingresados en UCI, recuperados y fallecidos desde el 15 de marzo hasta el 22 de septiembre del 2020.
IntervencionesDesarrollo de un modelo matemático tipo susceptible, expuesto, infectado y recuperado (SEIR) capaz de predecir la evolución de la pandemia, considerando las medidas de salud pública establecidas.
Variables de interésNúmero de pacientes infectados por SARS-CoV-2, hospitalizados e ingresados en UCI por la COVID-19.
ResultadosA partir de los datos registrados, hemos podido desarrollar un modelo matemático que refleja el flujo de la población entre los diferentes grupos de interés en relación con la COVID-19. Esta herramienta permite analizar diferentes escenarios basados en medidas de restricción socio-sanitarias y pronosticar el número de infectados, hospitalizados e ingresados en UCI.
ConclusionesEl modelo matemático es capaz de proporcionar predicciones sobre la evolución de la COVID-19 con suficiente antelación como para poder conjugar los picos de prevalencia y de necesidades de asistencia hospitalaria y de UCI, con la aparición de ventanas temporales que posibiliten la atención de enfermos no-COVID.
Coronaviruses cause respiratory and intestinal diseases in many animal species. In humans, four of these viruses produce upper airway infections (OC43, HKU1, 229E and NL63) and two can cause severe respiratory syndromes (SARS-CoV-1 and MERS-CoV).1 However, in December 2019, the Chinese authorities reported several cases of respiratory syndrome in Wuhan that were subsequently attributed to infections caused by the new severe acute respiratory syndrome coronavirus-2 (SARS-CoV-2), the agent producing coronavirus disease 2019 (COVID-19).2,3 From the declaration of the pandemic by the World Health Organization (WHO) and up until 27 January 2021, a total of 99,363,697 cases have been confirmed, with 2,135,959 deaths throughout the world.4
The application of non-pharmacological measures such as social distancing, the wearing of face masks, the improvement of hygiene measures, lockdowns, home confinement, the closing down of non-essential services, mobility restrictions, etc., is particularly important, since they have a direct impact upon the speed with which the disease spreads.5–7 In fact, the indicators on the evolution of COVID-19 improved noticeably in Spain two weeks after the official national lockdown declaration of 14 March 2020, and moreover showed that regions in the early stages of the pandemic at the start of lockdown (such as Ceuta and Melilla) had mortality rates far lower than regions starting with more widespread transmission, such as Catalonia. The above reflects the important differential effect of the adopted measures, provided they are introduced early.8 In relation to the consequences derived from the population impact of COVID-19, the pandemic causes a very important decrease in the care dynamics of patients suffering from other kinds of illnesses.
In order to secure adequate planning, it is necessary to use tools that can predict the evolution of COVID-19 in accordance to the starting situation and the non-pharmacological and public healthcare measures introduced in each moment in time, and which can alert us to the possible transmission scenarios. Such tools should allow the application and timing of measures sufficiently in advance to coordinate the peaks in prevalence and the hospital and Intensive Care Unit (ICU) needs due to COVID-19, with the definition of time windows allowing for the care of non-COVID-19 patients.
The present study describes a mathematical model designed to predict the transmission dynamics of COVID-19 and the requirements referred to hospitalization and admission to the ICU. The model has been calibrated and validated using data provided by the hospitals of the province of Granada (Spain), which jointly provide healthcare for a population of 914,678 inhabitants.9 In addition, we present estimates referred to three scenarios based on different sociosanitary containment programs.
Patients and methodsPatientsThe study data were compiled from the following hospitals in the province of Granada: H.U. Virgen de las Nieves, H.U. Clínico San Cecilio, H.U. Santa Ana en Motril, H.U. de Baza, H. de San Rafael and H.L.A. Inmaculada. Approval was obtained from the Biomedical Research Ethics Committee of the province of Granada, dependent upon the health authorities of the Government of Andalusia. We documented the number of hospitalized patients, the admissions to intensive care, and the number of survivors and non-survivors.
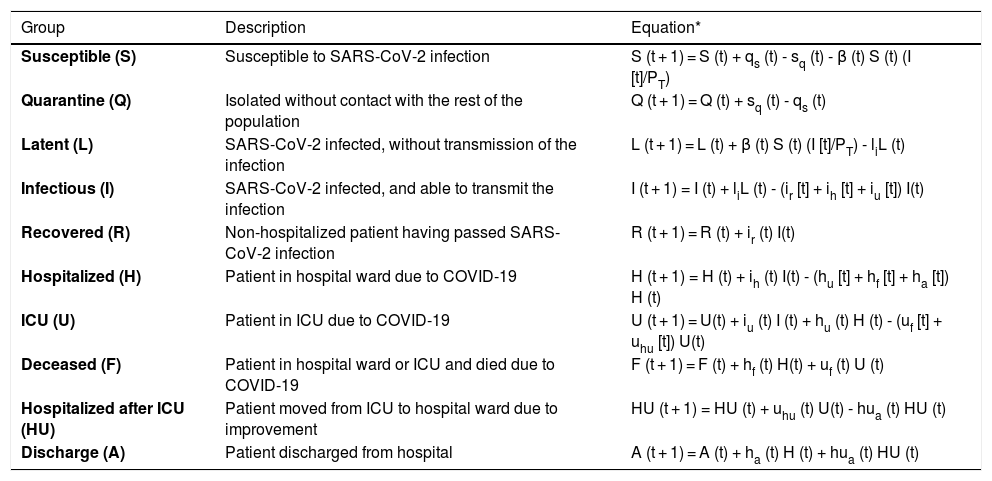
Mathematical model, calibration and validationWe implemented a susceptible, exposed, infected recovery (SEIR) model specifically designed to describe the dynamics of the pandemic at population level and at hospital circuit level in relation to patients with COVID-19 (hospital ward and ICU admissions), since this is the most limiting aspect when having to deal with the pandemic, given the material and human resources required (Fig. 1). Table 1 shows the different groups into which the population can be divided with respect to infection and the hospital circuit, together with the difference equations that describe the dynamics of each group over time.

Diagram of the SEIR model implemented for the prediction of COVID-19 transmission. Each box represents one of the different groups into which the population can be divided according to the infection and disease. The arrow parameters represent the transmission rates between the linked groups.
A: Discharge; F: Deceased; H: Hospitalized; HU: Hospitalized after ICU; I:Infectious; L: Latent; Q: Quarantine; R: Recovered; S: Susceptible; U: ICU.
Population groups in relation to SARS-CoV-2 infection and the evolution of the COVID-19 pandemic, and equations predicting the quantification of each group in each moment in time.
| Group | Description | Equation* |
|---|---|---|
| Susceptible (S) | Susceptible to SARS-CoV-2 infection | S (t + 1) = S (t) + qs (t) - sq (t) - β (t) S (t) (I [t]/PT) |
| Quarantine (Q) | Isolated without contact with the rest of the population | Q (t + 1) = Q (t) + sq (t) - qs (t) |
| Latent (L) | SARS-CoV-2 infected, without transmission of the infection | L (t + 1) = L (t) + β (t) S (t) (I [t]/PT) - liL (t) |
| Infectious (I) | SARS-CoV-2 infected, and able to transmit the infection | I (t + 1) = I (t) + liL (t) - (ir [t] + ih [t] + iu [t]) I(t) |
| Recovered (R) | Non-hospitalized patient having passed SARS-CoV-2 infection | R (t + 1) = R (t) + ir (t) I(t) |
| Hospitalized (H) | Patient in hospital ward due to COVID-19 | H (t + 1) = H (t) + ih (t) I(t) - (hu [t] + hf [t] + ha [t]) H (t) |
| ICU (U) | Patient in ICU due to COVID-19 | U (t + 1) = U(t) + iu (t) I (t) + hu (t) H (t) - (uf [t] + uhu [t]) U(t) |
| Deceased (F) | Patient in hospital ward or ICU and died due to COVID-19 | F (t + 1) = F (t) + hf (t) H(t) + uf (t) U (t) |
| Hospitalized after ICU (HU) | Patient moved from ICU to hospital ward due to improvement | HU (t + 1) = HU (t) + uhu (t) U(t) - hua (t) HU (t) |
| Discharge (A) | Patient discharged from hospital | A (t + 1) = A (t) + ha (t) H (t) + hua (t) HU (t) |
The transition between groups of subject / patients is determined by the transition rates qs, sq, li, ir, ih, iu, hu, hf, ha, uf, uhu, hf and hua. In this regard, β is the transmission rate between susceptible (S) and infected (I), and its value is proportional to the magnitude of the basic reproduction number R0, according to the expression: R0 = β/(ir + ih + iu). PTis the population of the province of Granada (Spain).
The transition between groups is determined by the transition rates qs, sq, li, ir, ih, iu, hu, hf, ha, uf, uhu, hf and hua. In this regard, β is the transmission rate between susceptible (S) and infected (I), and its value is proportional to the magnitude of the basic reproduction number R0, according to the expression: R0 = β/(ir + ih + iu). During the model calibration process, and drawing upon the hospital records, we were able to determine the value of the different transition rates and of the transmission rate (β) required for the model to be capable of describing the specific situation of the province of Granada, using the Novelty Swarm optimization algorithm implemented in Python3 for this purpose.10 The value of sq and qs is established based on the changes in displacement flows contemplated in the Local Mobility Report on COVID-19, from Google,11 in the home lockdown period decreed by the Spanish government on 14 March 2020.12 The calibration was made using records corresponding to patients admitted to the hospital and to the ICU, comprising survivors and non-survivors, between 15 March and 22 September 2020, yielding a total sample size of 1064 cases. Since the model also takes into account those subjects who have not been diagnosed, use was made of the data from the seroprevalence study of the Spanish provinces for Granada in order to calibrate the number of infected individuals.13
To obtain robust values of the parameters, we performed 600 calibration processes that yielded the corresponding 600 sets of parameters describing the specific epidemiological situation of the province of Granada up until 22 September 2020. Based on the 600 estimations, we obtained the mean and 95% confidence interval (95%CI) of both the parameters and the predictions. After completing the calibration, we validated the model, comparing the predicted data against those recorded between 23 September and 7 November 2020, totaling 956 patients.
Predictions provided by the modelThree scenarios were generated, contemplating non-pharmacological measures to simulate the most probable evolution of the pandemic, and to determine the most favorable conditions to conjugate the peaks and troughs referred to prevalence and to the hospitalization and ICU admission needs. The initial scenario represents the predicted evolution, taking into account the restrictions that were established for the province of Granada when it was in level 4 phase 2 of the state of alarm – this implying the temporary closing down of non-essential services, the restriction of commercial opening hours and mobility, and perimeter lockdown.14 These measures were implemented for two weeks from 10 November 2020. In our simulations, we considered that these measures would have an impact which, in the best of cases, could equal the Rtrecorded in Catalonia following the application of similar measures established on 30 October 2020, with a value of approximately 0.8.15 The other two scenarios were chosen from among many simulations, since they allowed us to analyze the effects of the dilatation in time of the containment measures and the establishing of different periods of restrictions. The model was programmed to quantify in each scenario the daily expected value in each group (S, quarantine [Q], discharge [A], deceased [F], hospitalized [H], hospitalized after ICU [HU], I, latent [L], recovered [R], ICU [U]), along with the corresponding 95%CI (percentiles 2.5 to 97.5).
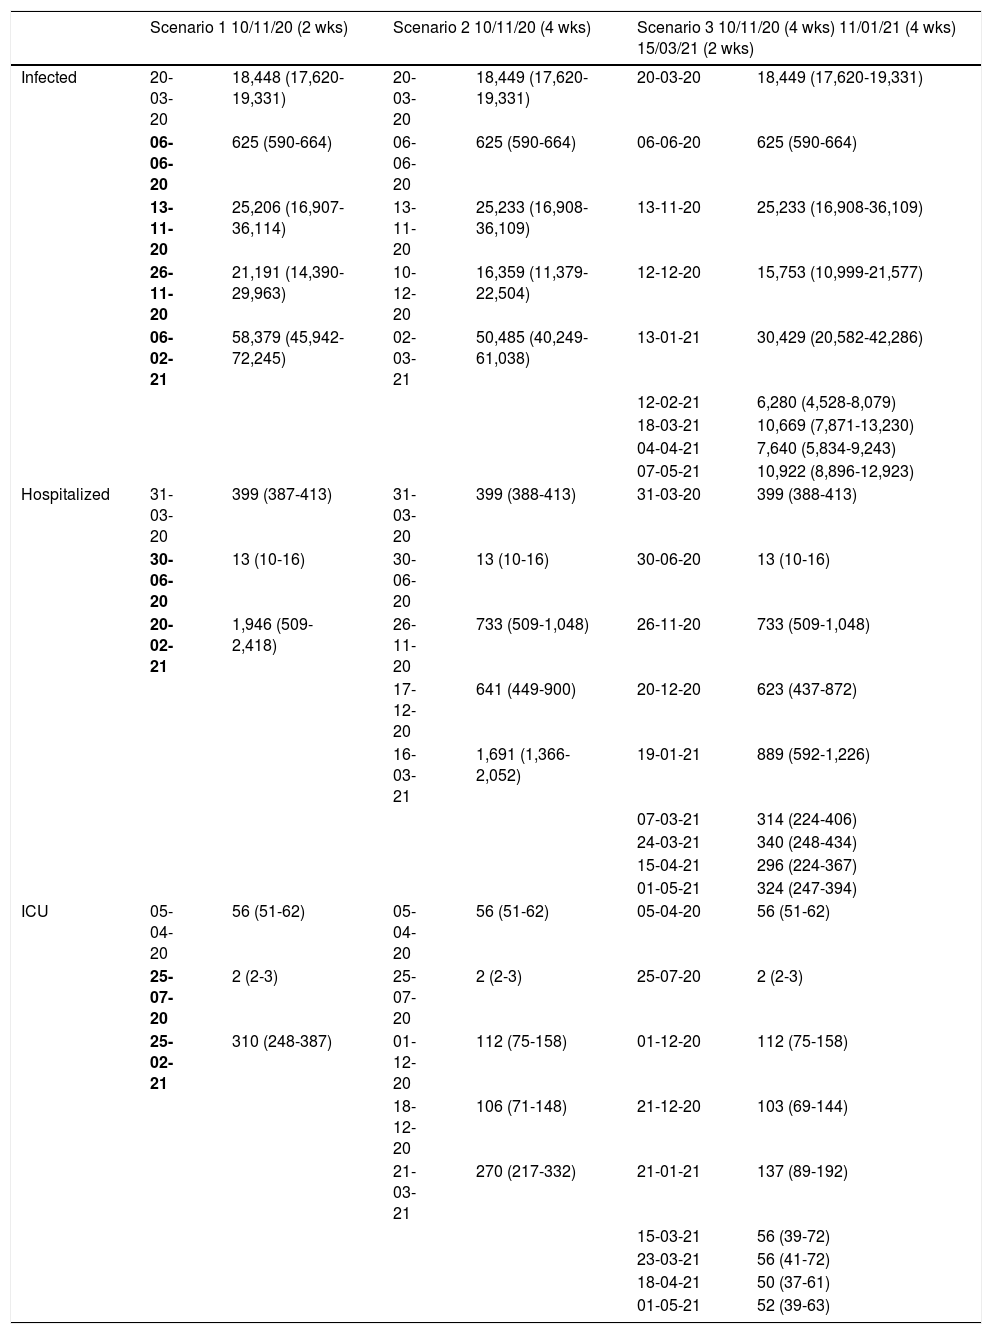
ResultsThe developed model allowed us to establish different scenarios referred to the application of restriction measures and to foresee the evolution of the number of infected subjects, and the admissions to hospital and the ICU (Table 2), considering an R0of 0.8. The calibration and validation phase of the model confirmed the validity of the predictions provided after comparing the expected and registered cases of hospitalizations and admissions to the ICU during the period between 23 September and 7 November 2020. Fig. 2 shows that although not all the counts were within the confidence interval, the growth of both curves was very similar in shape. Consequently, the model may be able to define a clear trend of the evolution of the hospital circuit, allowing for qualitative assessment of the evolution of the pandemic. A summary is provided below of the predicted evolution in the three scenarios modeled on 10 November 2020, in which all the numerical references represent the result of the mean offered by the model.
Number of patients infected with SARS-CoV-2, hospitalized and admitted to the ICU predicted by the mathematical model on 10 November 2020 for three scenarios that differ in the calendar and duration of the application of restriction measures for the province of Granada (Spain).
| Scenario 1 10/11/20 (2 wks) | Scenario 2 10/11/20 (4 wks) | Scenario 3 10/11/20 (4 wks) 11/01/21 (4 wks) 15/03/21 (2 wks) | ||||
|---|---|---|---|---|---|---|
| Infected | 20-03-20 | 18,448 (17,620-19,331) | 20-03-20 | 18,449 (17,620-19,331) | 20-03-20 | 18,449 (17,620-19,331) |
| 06-06-20 | 625 (590-664) | 06-06-20 | 625 (590-664) | 06-06-20 | 625 (590-664) | |
| 13-11-20 | 25,206 (16,907-36,114) | 13-11-20 | 25,233 (16,908-36,109) | 13-11-20 | 25,233 (16,908-36,109) | |
| 26-11-20 | 21,191 (14,390-29,963) | 10-12-20 | 16,359 (11,379-22,504) | 12-12-20 | 15,753 (10,999-21,577) | |
| 06-02-21 | 58,379 (45,942-72,245) | 02-03-21 | 50,485 (40,249-61,038) | 13-01-21 | 30,429 (20,582-42,286) | |
| 12-02-21 | 6,280 (4,528-8,079) | |||||
| 18-03-21 | 10,669 (7,871-13,230) | |||||
| 04-04-21 | 7,640 (5,834-9,243) | |||||
| 07-05-21 | 10,922 (8,896-12,923) | |||||
| Hospitalized | 31-03-20 | 399 (387-413) | 31-03-20 | 399 (388-413) | 31-03-20 | 399 (388-413) |
| 30-06-20 | 13 (10-16) | 30-06-20 | 13 (10-16) | 30-06-20 | 13 (10-16) | |
| 20-02-21 | 1,946 (509-2,418) | 26-11-20 | 733 (509-1,048) | 26-11-20 | 733 (509-1,048) | |
| 17-12-20 | 641 (449-900) | 20-12-20 | 623 (437-872) | |||
| 16-03-21 | 1,691 (1,366-2,052) | 19-01-21 | 889 (592-1,226) | |||
| 07-03-21 | 314 (224-406) | |||||
| 24-03-21 | 340 (248-434) | |||||
| 15-04-21 | 296 (224-367) | |||||
| 01-05-21 | 324 (247-394) | |||||
| ICU | 05-04-20 | 56 (51-62) | 05-04-20 | 56 (51-62) | 05-04-20 | 56 (51-62) |
| 25-07-20 | 2 (2-3) | 25-07-20 | 2 (2-3) | 25-07-20 | 2 (2-3) | |
| 25-02-21 | 310 (248-387) | 01-12-20 | 112 (75-158) | 01-12-20 | 112 (75-158) | |
| 18-12-20 | 106 (71-148) | 21-12-20 | 103 (69-144) | |||
| 21-03-21 | 270 (217-332) | 21-01-21 | 137 (89-192) | |||
| 15-03-21 | 56 (39-72) | |||||
| 23-03-21 | 56 (41-72) | |||||
| 18-04-21 | 50 (37-61) | |||||
| 01-05-21 | 52 (39-63) | |||||
*The date of implementation and the duration of the restriction measures for each of the three scenarios are shown, together with the date and number and confidence interval of the patients infected, hospitalized or in the ICU, corresponding to the points of inflexion, peak (maximum) or trough (minimum), appearing in the course of the prediction.
wks: weeks; ICU: Intensive Care Unit.
 and patients admitted to the ICU (B) in the hospitals of the province of Granada (Spain) during the period from 23 September to 7 November 2020 (red dots), with respect to the mean and confidence interval predicted by the model for that period.")
Validation of the mathematical model, comparing the number of hospitalized subjects (A) and patients admitted to the ICU (B) in the hospitals of the province of Granada (Spain) during the period from 23 September to 7 November 2020 (red dots), with respect to the mean and confidence interval predicted by the model for that period.
Scenario 1 would correspond to a situation characterized by sociosanitary restrictions similar to those that were established during two weeks from 10 November 2020 in Granada. In this context, group I would have reached a peak of 58,379 affected individuals on 6 February 2021 – a prevalence that is over three times greater than that recorded during the peak which appeared in March (18,448 on 20 March 2020). We would only see a brief reduction of the trend towards an increase in the number of infected subjects in late October (26 October 2020), before again experiencing an exponential rise in cases. With regard to groups H and U, the two-week restrictions measure would not be able to generate a trough capable of reducing hospital pressure, and a peak of 1946 (20 February 2021) and 310 (25 February 2021) cases, respectively, would appear. This volume would greatly exceed the number of patients admitted to hospital and to the ICU seen in the past period of March to April 2020 (Fig. 3). It should be noted that although hospital pressure during the first wave of the pandemic was high, the hospital services of the province did not reach the saturation point, since home lockdown was decreed when prevalence in the province was still in its early stages.13
, considering two weeks of restrictions of non-essential services from 10 November 2020 (scenario 1). The number of infected subjects (A), hospitalizations (B) and patients admitted to ICU (C) over time are represented.")
Predictions of the prevalence of individuals infected with SARS-CoV-2, hospitalized and admitted to the ICU for the province of Granada (Spain), considering two weeks of restrictions of non-essential services from 10 November 2020 (scenario 1). The number of infected subjects (A), hospitalizations (B) and patients admitted to ICU (C) over time are represented.
On considering scenario 2, with dilatation of the restrictions to a total of four weeks from 10 November 2020, the number of affected individuals would decrease during the period between 13 November and 10 December 2020, from 25,233 to 16,359 cases. However, we would find a high prevalence peak of 50,485 cases at a later date with respect to the peak estimated for the previous scenario (2 March 2021). With regard to groups H and U, similar behavior would be observed, with a marked decrease in the number of cases in the periods from 26 November to 17 December 2020, from 733 (95%CI 509 to 1048) to 641 (95%CI 449 to 900) cases, and from 1 December to 18 December 2020, from 112 (95%CI 75 to 158) to 106 (95%CI 71 to 148) cases, respectively. In both groups, we would observe a peak in March 2021 that would exceed by more than four-fold the number of patients admitted to hospital and to the ICU observed in the past period of March to April 2020 (Fig. 4).
, considering four weeks of restrictions of non-essential services from 10 November 2020 (scenario 2). The number of infected subjects (A), hospitalizations (B) and patients admitted to ICU (C) over time are represented.")
Predictions of the prevalence of individuals infected with SARS-CoV-2, hospitalized and admitted to the ICU for the province of Granada (Spain), considering four weeks of restrictions of non-essential services from 10 November 2020 (scenario 2). The number of infected subjects (A), hospitalizations (B) and patients admitted to ICU (C) over time are represented.
Scenario 3 presents the evolution of cases considering a schedule for the application of sociosanitary restriction measures by phases, and which was chosen after analyzing many possible scenarios. This context would contemplate three periods: four weeks from 10 November 2020 of restrictions applied to non-essential services; four weeks from 11 January 2021 with 70% population lockdown; and two weeks from 15 March 2021 of restrictions applied to non-essential services. For this scenario, the model showed a growing and milder evolution than the others up until January, with 30,429 cases in group I (13 January 2021), 889 in group H (19 January 2021) and 137 in group U (21 January 2021) at this point in time. In addition, in December we would observe a relevant decrease in cases in all three groups, which would be more manifest in group I, decreasing from 25,233 cases on 13 November 2020 to 15,753 cases on 12 December 2020. Starting in January, the number of cases would decrease, with alternating peaks and troughs until May, when there would be 10,922 cases in group I (7 May 2021), 324 in group H (1 May 2021) and 52 in group U (1 May 2021) (Fig. 5).
, considering: four weeks from 10 November 2020 of restrictions of non-essential services; four weeks from 11 January 2021 with 70% population lockdown; and two weeks from 15 March 2021 of restrictions of non-essential services (scenario 3). The number of infected subjects (A), hospitalizations (B) and patients admitted to ICU (C) over time are represented.")
Predictions of the prevalence of individuals infected with SARS-CoV-2, hospitalized and admitted to the ICU for the province of Granada (Spain), considering: four weeks from 10 November 2020 of restrictions of non-essential services; four weeks from 11 January 2021 with 70% population lockdown; and two weeks from 15 March 2021 of restrictions of non-essential services (scenario 3). The number of infected subjects (A), hospitalizations (B) and patients admitted to ICU (C) over time are represented.
The complex healthcare situation due to the current COVID-19 pandemic is further compounded by the important impact upon the normal functioning of medical and hospital care,16–18 and by the high opportunity cost generated in relation to many serious disease conditions that have not been properly managed because of the pandemic. The adequate treatment and follow-up of certain groups of patients infected with SARS-CoV-2 takes on particular importance, since they present comorbidities that appear to be correlated to the need for hospital and ICU admission in the context of COVID-19, such as arterial hypertension, chronic heart diseases, diabetes, chronic lung diseases and obesity.19
The control of the first wave of the COVID-19 pandemic in Spain was implemented through strict population restrictions under the coverage of the national state of alarm decreed on 14 March 2020.13 The established measures included 7 weeks of home lockdown, followed by four deconfinement phases until the so-called “new normality” status was reached on 21 June 2020.20 During this period there was a reorganization of the healthcare systems to accommodate the priority care of patients with COVID-19, greatly exceeding the strategic and operational limits of these systems, and largely setting aside the management of the rest of both serious and non-serious disease conditions that are characteristically seen in our healthcare centers – in the same way as in other countries of our setting.21–25
The presence of SARS-CoV-2 in our setting has remained constant after the end of the first wave of the pandemic in Spain.26 As a consequence of this, the endemization of the disease in Europe is clear, with the alternation of periods presenting a minimum incidence of the infection and other phases characterized by an exponential epidemic outbreak.27 This epidemiological pattern, which describes the dynamics of the COVID-19 pandemic over time, will most likely be maintained until the vaccination campaigns have been sufficiently consolidated28 and/or appropriate population immunity has developed.29
Due to the above, it is necessary to establish a joint public health strategy that should contemplate two fundamental aspects. On one hand, a COVID-19 care circuit must be developed to ensure adequate management of these patients both on an ambulatory basis and in the context of admission to the hospital or the ICU. On the other hand, a non-COVID-19 care circuit also must be established seeking to maximally reduce the opportunity cost referred to the rest of serious disease conditions, in order to curb the substantial increase in associated morbidity-mortality.30–32
The cumulative opportunity cost of the rest of serious disease conditions during the period corresponding to the first two waves of the COVID-19 pandemic, and the healthcare institution recovery / normalization phase, evidenced the impossibility of maintaining adequate population care outside the overwhelming COVID-19 scenario. This impossibility to maintain both circuits (COVID-19 / non-COVID), even with reinforcement of the healthcare structures, is reflected by the percentage of resources directed to patients with COVID-19.33 In addition, the ethical problem derived from polarization of the system towards management of the pandemic has constituted an important focus of debate.34–36
The identification of the populational behavior of the virus - characterized by peaks and troughs - is of particular relevance for correct planning. Logically, and preserving quality care for urgent / emergent cases of patients with different serious disease conditions, healthcare can be organized as alternating periods of care focalization.37,38 Thus, during the peaks of the pandemic, attention to COVID-19 would be intensified, reducing the care of stable patients with other diseases in proportion to the magnitude of the peaks of the pandemic. In contrast, during the trough periods, clinical activity targeted to non-COVID-19 disease would be intensified to above standard levels – taking full advantage of the window of opportunity provided.
In this sense, the mathematical model presented in this study could make an important contribution to decision-making related to the application of different measures and their timelines. The model facilitates planning, analyzing the scenarios which the different control strategies can generate. The model has been designed to optimize the predictions related to hospitalization and ICU admission needs, as the more limiting aspects facing patient care in the COVID-19 and non-COVID circuits.
In addition, the model has a modular construction, making it possible to incorporate other groups with the appearance of new factors that exert an important influence upon the dynamics of viral transmission, such as a SARS-CoV-2 vaccination campaign,39 and its associated percentage efficacy. Community or herd immunity would be defined as 1 – (1 / R0).40 Taking into account the contagion rates obtained through calibration of the model, without the application of drastic containment measures but using face masks and social distancing, the percentage of the population that should have passed the disease would be between 28-42%, which is far from the percentage of people that have transited the disease according to the seroprevalence study13 and the evolution of the model. This percentage of immune individuals could be reached with subjects that have suffered the disease or with vaccinated individuals, provided the healthcare protection measures are maintained over time. Nevertheless, it will be necessary to increase the percentage vaccination of the population in order to be able to include this variable in the presented model.
The epidemiological predictive model we contemplate allows us to evaluate the impact of the different population restriction measures against the COVID-19 pandemic, considering its duration, intensity and the basal context referred to incidence and prevalence, as well as to predict the level of healthcare pressure or burden in relation to the number of patients hospitalized or admitted to the ICU. All this defines our model as a valuable tool well suited for designing intervention and care plans over the middle term, with the possibility of chronologically incorporating the containment measures to determine the duration and importance of the trough periods of lesser COVID-19 healthcare pressure that could be taken advantage of for the care of non-COVID-19 patients. Furthermore, our model can be adapted to other population nuclei, performing a new calibration based on the corresponding demographic data, the local evolution of the pandemic and the applied healthcare policy measures. In this regard, the model should be revised over time according to the modifications that occur in relation to the above.
Limitations of the modelThe proposed model is a classical difference equations system. In constructing the system, we assumed the usual hypothesis of a homogeneous population, whereby any individual of the population is able to infect another. We did not consider the clinical characteristics of the patients different from those of the classification according to Table 1, or age groups, even though the transmission, hospitalization and mortality rates may vary according to age. Likewise, we consider quarantine to only apply to the susceptible population, when in fact latent, asymptomatic infected and recovered individuals are also under isolation. Lastly, the model does not take into account those COVID-19 death occurring outside the hospital circuit.
Contribution of the authorsStudy design: José Manuel Garrido, David Martínez-Rodríguez, Fernando Rodríguez-Serrano and Rafael Jacinto Villanueva.
Patient flow design: José Manuel Garrido, David Martínez-Rodríguez, Fernando Rodríguez-Serrano and Rafael Jacinto Villanueva.
Data compilation: José Manuel Garrido, Fernando Rodríguez-Serrano, José Miguel Pérez-Villares, Andrea Ferreiro-Marzal and María del Mar Jiménez-Quintana.
Programming of the model: David Martínez-Rodríguez and Rafael Jacinto Villanueva.
Design of containment scenarios: José Manuel Garrido, David Martínez-Rodríguez, Fernando Rodríguez-Serrano, José Miguel Pérez-Villares, Andrea Ferreiro-Marzal, María del Mar Jiménez-Quintana and Rafael Jacinto Villanueva.
Analysis of results: José Manuel Garrido, David Martínez-Rodríguez, Fernando Rodríguez-Serrano, José Miguel Pérez-Villares, Andrea Ferreiro-Marzal, María del Mar Jiménez-Quintana and Rafael Jacinto Villanueva.
Writing of the manuscript: José Manuel Garrido and Fernando Rodríguez-Serrano.
Review of the manuscript: José Manuel Garrido, David Martínez-Rodríguez, Fernando Rodríguez-Serrano, José Miguel Pérez-Villares, Andrea Ferreiro-Marzal, María del Mar Jiménez-Quintana and Rafael Jacinto Villanueva.
Financial supportThis study has been financed by the Spanish Ministry of Economics, Industry and Competitiveness, the State Research Agency, and the European Regional Development Fund (MTM2017-89664-P), the European Union through the Regional Development Fund / European Social Fund program and the Valencian Community (GJIDI/2018/A/010 and GJIDI/2018/A/009), and the Fundación Ramón Areces, Madrid, Spain (CIVP18A3920).
Conflicts of interestThe authors declare that they have no conflicts of interest.
Study Group COVID-19_Granada: José Manuel Garrido Jiménez, Antonio Cansino Osuna, Juan Carlos Carrillo Santos, Cristina Carvajal Pedrosa, María Angeles García Rescalvo, Francisco José Guerrero García, Sebastián Manzanares Galán, Francisco Marti Jiménez, Manuel Enrique Reyes Nadal, Pedro Manuel Ruiz Lorenzo, José Luis Salcedo Lagullón, Indalecio Sánchez-Montesinos García, Fernando Rodríguez-Serrano.
Please cite this article as: Garrido JM, Martínez-Rodríguez D, Rodríguez-Serrano F, Pérez-Villares JM, Ferreiro-Marzal A, Jiménez-Quintana MM, et al. Modelo matemático optimizado para la predicción y planificación de la asistencia sanitaria por la COVID-19. Med Intensiva. 2022;46:248–258.

