


This study explored the link between the TG/HDL ratio and mortality in obese sepsis patients using the eICU database.
DesignRetrospective observational study.
SettingIntensive Care Medicine.
PatientsAccording to Sepsis 3.0 criteria, sepsis is diagnosed with infection and a SOFA score ≥2. This study included adults (age ≥18) with ICU stays ≥48 h to ensure data stability. Patients with diabetes, acute pancreatitis, or those on lipid-lowering or antidiabetic treatments were excluded due to their impact on lipid and glucose metabolism, which could bias the analysis of the TG/HDL ratio and all-cause mortality.
Interventions938 obese sepsis patients were selected, and statistical methods (variable assessment, difference test, regression model, curve fitting, subgroup analysis) were used. The study was carried out using R 4.3.2 software.
Main variables of interestTG/HDL.
ResultsThe TG/HDL ratio varied across quartiles and was significantly linked to mortality in obese sepsis patients. Regression and curve fitting showed a U-shaped relationship for TG/HDL < 8, with an inflection point at 3.59. The K–M curve confirmed this U-shaped pattern, and subgroup analysis revealed a significant interaction with hypertension.
ConclusionsA U-shaped relationship exists between TG/HDL and mortality in obese sepsis patients, with both low and high levels increasing death risk.
Este estudio exploró la relación entre la razón TG/HDL y la mortalidad en pacientes obesos con sepsis utilizando la base de datos eICU.
DiseñoEstudio observacional retrospectivo.
ÁmbitoMedicina de Cuidados Intensivos.
PacientesSegún Sepsis 3.0, la sepsis se diagnostica con infección y SOFA ≥ 2. Se incluyeron adultos en UCI ≥ 48 horas, excluyendo a pacientes con diabetes, pancreatitis aguda o tratamientos que afecten lípidos y glucosa para evitar sesgos.
IntervencionesSe seleccionaron 938 pacientes obesos con sepsis, y se utilizaron métodos estadísticos (evaluación de variables, prueba de diferencias, modelo de regresión, ajuste de curvas, análisis de subgrupos). El estudio se realizó utilizando el software R 4.3.2.
Variables de interés principalesTG/HDL.
ResultadosLa razón TG/HDL varió entre cuartiles y se asoció significativamente con la mortalidad en pacientes obesos con sepsis. El análisis mostró una relación en forma de U para TG/HDL < 8, con un punto de inflexión en 3.59. La curva K-M y el análisis de subgrupos confirmaron este patrón, destacando una interacción con la hipertensión.
ConclusionesExiste una relación en forma de U entre el TG/HDL y la mortalidad en pacientes obesos con sepsis, siendo los niveles tanto bajos como altos los que aumentan el riesgo de muerte.
Sepsis is a severe systemic infectious disease. Clinically, it has a relatively high incidence and mortality rate, which seriously endangers the lives of patients.1,2 Despite significant advancements in the diagnosis and treatment of sepsis in modern medicine, the prognosis of patients remains unsatisfactory and the mortality rate remains high.3 In current clinical practice, there is a lack of specific and effective prognostic indicators to guide treatment and assess the development of the disease condition. This is an urgent problem to be solved in the field of sepsis research.4
Obesity is a global public health issue and is relatively common among sepsis patients. Multiple studies have shown that there is a complex relationship between obesity and the prognosis of sepsis patients.5,6 On the one hand, the changes of fat cells in obese patients will promote the secretion of a large number of inflammatory factors, such as tumor necrosis factor - α (TNF - α), interleukin - 6 (IL - 6) and C - reactive protein (CRP).7 These inflammatory factors interact with each other to activate the inflammatory signaling pathways, exacerbate the systemic inflammatory response, and worsen the condition of sepsis.8 On the other hand, some studies have also found that in some cases, sepsis patients with a relatively high Body Mass Index (BMI) may have a better prognosis.9 This phenomenon may be related to the fact that obese patients have stored more energy and nutrients before falling ill. However, this "obesity paradox" phenomenon has not been fully understood yet, and more research is still needed to deeply analyze its underlying mechanisms.10,11 In the field of medical research, the TG/HDL ratio has been linked to metabolic dysfunction in critical illness, but its role in obese sepsis patients remains unclear. Through preliminary exploration, we have found that the TG/HDL ratio seems to have a stronger association with the all-cause mortality of obese sepsis patients, which provides a new direction for research.
In conclusion, this study contributes critical insights into sepsis management, particularly regarding the prognostic significance of lipid metabolism abnormalities in obese sepsis patients, an area that remains incompletely understood. Our primary objective was to assess the independent prognostic value of the TG/HDL ratio for all-cause mortality in obese sepsis patients. By addressing these evidence-based knowledge gaps, our findings offer novel insights for optimizing risk stratification strategies in obese sepsis populations while advancing our understanding of lipid metabolism pathophysiology in critical illness.
Materials and methodsData sourcesThe data for this study is sourced from the public eICU database (https://physionet.org/content/eicu-crd/2.0/), which is jointly constructed by Philips Healthcare and the Laboratory for Computational Physiology at the Massachusetts Institute of Technology and is widely used in medical research. The data it contains includes basic demographic information of patients (age, gender, ethnicity, etc.), admission diagnoses (primary diagnosis and concurrent diseases), treatment process (various treatment methods and adjustments), laboratory test results (routine and biochemical tests, etc.), and prognosis (length of hospital stay, discharge outcome, all-cause mortality, etc.), providing a solid foundation for the research. According to the rules and statements of the database, after following the academic norms to indicate the data source and cite this study, the data can be used for secondary analysis. The use of data in this study complies with the authorization license. Since the data has been anonymized, there is no risk of privacy leakage, and no additional ethical approval and patient consent are required. The retrospective collection of data does not require a formal consent procedure, thus ensuring that the existing data can be legally and compliantly used to conduct research on the correlation between TG/HDL and all-cause mortality in obese sepsis patients while respecting the rights and interests of patients.
Inclusion and exclusion criteriaInclusion criteria: According to the Sepsis 3.0 diagnostic criteria, sepsis is diagnosed when there is an infection, BMI ≥ 28 and a SOFA score≥2, with participants aged ≥18 years to ensure the adult study population and exclude age-related interference and an ICU length of stay ≥48 h to ensure representative and stable data. Exclusion criteria: Patients with diabetes or acute pancreatitis are excluded because they respectively interfere with glucose and lipid metabolism and pancreatic enzyme secretion, affecting lipid metabolism and interfering with the analysis of the relationship between TG/HDL and all-cause mortality. Patients receiving lipid-lowering drugs and antidiabetic treatment also need to be excluded because they directly and indirectly affect the levels of TG and HDL and glucose metabolism respectively, causing bias in the research results.
The definition of obesity refers to the Chinese Obesity Prevention and Control Guidelines (2021) and metabolic characteristics of Asian populations, with a cutoff value of BMI > 28 as the criterion. Asian populations are prone to metabolic risks (such as insulin resistance and cardiovascular complications) at lower BMI levels. This study uses this criterion, which is consistent with regional epidemiological characteristics.
Data extraction processAccording to the above-established inclusion and exclusion criteria, data extraction was carried out in the eICU database, and the data of 60,593 patients were initially obtained; the initially extracted data were further screened. Patients with missing key data (including height, weight, TG, fasting plasma glucose (FPG), HDL) and those with a BMI greater than 55 or less than 15 were removed. After this step, the data of 7797 patients remained; the integrity of the remaining data was checked, and the patient data corresponding to the indicators with a data volume loss of > 60% were excluded. At the same time, only the data of obese patients with a BMI ≥ 28 were retained, and finally 938 patients were determined to be included in this study. The data of these patients will serve as the cornerstone for further in-depth analysis.
Statistical analysisThis study only included the TG/HDL ratio from the patient's first blood test upon ICU admission as the baseline variable, without evaluating dynamic changes during the course of the disease. Due to the limitations of the retrospective design, the results only reflect the association between the baseline ratio and mortality, and cannot establish a causal relationship.
This study employed various statistical methods to analyze the association between TG/HDL and obese sepsis patients. The normality of continuous variables was evaluated by the quantile-quantile plot. Normally distributed variables were represented by mean ± standard deviation, non-normally distributed variables were represented by median (Q1–Q4), and categorical variables were represented by proportions. The differences in baseline characteristics of TG/HDL quartiles were assessed by one-way analysis of variance (for normally distributed variables), Kruskal-Wallis H test (for non-normally distributed variables), and χ² test (for categorical variables). A multivariate Cox regression model was used to examine the impact of TG/HDL on patients, taking into account confounding factors such as AGE, GENDER, and HYPERTENSION. Meanwhile, KM curve smoothing fitting and threshold effect analysis were performed. The former intuitively presented the changing trend of survival probabilities of patients at different TG/HDL levels, while the latter explored whether there were critical thresholds and nonlinear relationships of TG/HDL that affected prognostic indicators. Subgroup analysis was conducted using the stratified Cox regression model, and the likelihood ratio test was used to evaluate the interactions between subgroups. All statistical analyses were carried out using R 4.3.2 (http://www.R-project.org), with a two-sided significance level set at 0.05.
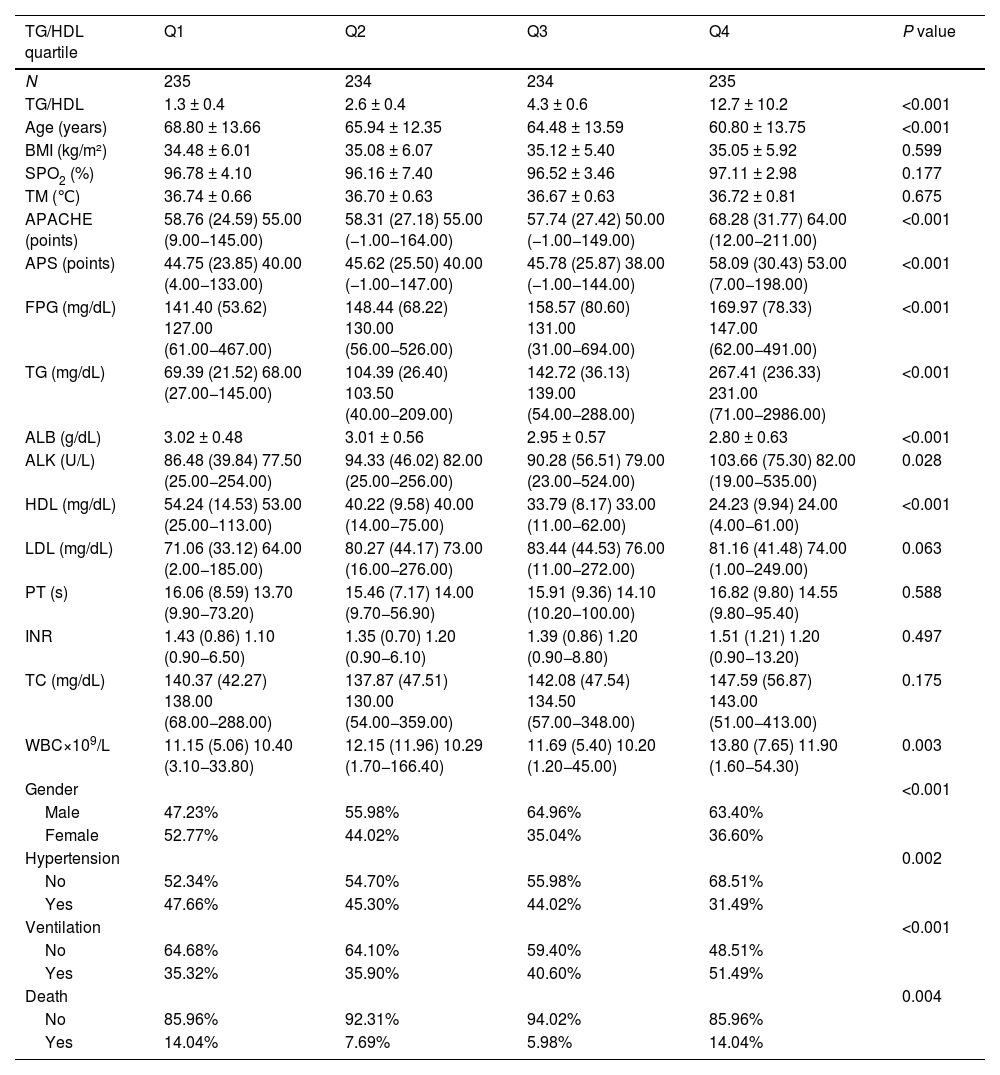
ResultsDescription of the study populationIn this study, 938 patients were analyzed according to the TG/HDL quartiles (Table 1). Among the general characteristics, the age decreased with the increase of quartiles (P < 0.001), and there were no significant differences in BMI, blood oxygen saturation (SPO2), and body temperature (TM, P > 0.05). The disease severity indicators APACHE and APS increased significantly with the increase of quartiles (P < 0.001). The metabolic indicators Fasting Plasma Glucose (FPG) and TG increased, and High-Density Lipoprotein (HDL) decreased (all P < 0.001), while there were no significant differences in Low-Density Lipoprotein (LDL) and Total Cholesterol (TC) (P > 0.05). Among other laboratory indicators, Albumin (ALB) decreased with the increase of quartiles (P < 0.001), alkaline phosphatase (ALK) was different (P < 0.05), Prothrombin Time (PT) and International Normalized Ratio (INR) had no significant differences (P > 0.05), and WBC was different (P < 0.05). There were differences in gender, Hypertension, Ventilation, and mortality among different quartiles (P < 0.05 or P < 0.001). There were differences in many aspects among patients with different TG/HDL quartiles, providing baseline information for subsequent research.
Description of the study population.
| TG/HDL quartile | Q1 | Q2 | Q3 | Q4 | P value |
|---|---|---|---|---|---|
| N | 235 | 234 | 234 | 235 | |
| TG/HDL | 1.3 ± 0.4 | 2.6 ± 0.4 | 4.3 ± 0.6 | 12.7 ± 10.2 | <0.001 |
| Age (years) | 68.80 ± 13.66 | 65.94 ± 12.35 | 64.48 ± 13.59 | 60.80 ± 13.75 | <0.001 |
| BMI (kg/m²) | 34.48 ± 6.01 | 35.08 ± 6.07 | 35.12 ± 5.40 | 35.05 ± 5.92 | 0.599 |
| SPO2 (%) | 96.78 ± 4.10 | 96.16 ± 7.40 | 96.52 ± 3.46 | 97.11 ± 2.98 | 0.177 |
| TM (℃) | 36.74 ± 0.66 | 36.70 ± 0.63 | 36.67 ± 0.63 | 36.72 ± 0.81 | 0.675 |
| APACHE (points) | 58.76 (24.59) 55.00 (9.00−145.00) | 58.31 (27.18) 55.00 (−1.00−164.00) | 57.74 (27.42) 50.00 (−1.00−149.00) | 68.28 (31.77) 64.00 (12.00−211.00) | <0.001 |
| APS (points) | 44.75 (23.85) 40.00 (4.00−133.00) | 45.62 (25.50) 40.00 (−1.00−147.00) | 45.78 (25.87) 38.00 (−1.00−144.00) | 58.09 (30.43) 53.00 (7.00−198.00) | <0.001 |
| FPG (mg/dL) | 141.40 (53.62) 127.00 (61.00−467.00) | 148.44 (68.22) 130.00 (56.00−526.00) | 158.57 (80.60) 131.00 (31.00−694.00) | 169.97 (78.33) 147.00 (62.00−491.00) | <0.001 |
| TG (mg/dL) | 69.39 (21.52) 68.00 (27.00−145.00) | 104.39 (26.40) 103.50 (40.00−209.00) | 142.72 (36.13) 139.00 (54.00−288.00) | 267.41 (236.33) 231.00 (71.00−2986.00) | <0.001 |
| ALB (g/dL) | 3.02 ± 0.48 | 3.01 ± 0.56 | 2.95 ± 0.57 | 2.80 ± 0.63 | <0.001 |
| ALK (U/L) | 86.48 (39.84) 77.50 (25.00−254.00) | 94.33 (46.02) 82.00 (25.00−256.00) | 90.28 (56.51) 79.00 (23.00−524.00) | 103.66 (75.30) 82.00 (19.00−535.00) | 0.028 |
| HDL (mg/dL) | 54.24 (14.53) 53.00 (25.00−113.00) | 40.22 (9.58) 40.00 (14.00−75.00) | 33.79 (8.17) 33.00 (11.00−62.00) | 24.23 (9.94) 24.00 (4.00−61.00) | <0.001 |
| LDL (mg/dL) | 71.06 (33.12) 64.00 (2.00−185.00) | 80.27 (44.17) 73.00 (16.00−276.00) | 83.44 (44.53) 76.00 (11.00−272.00) | 81.16 (41.48) 74.00 (1.00−249.00) | 0.063 |
| PT (s) | 16.06 (8.59) 13.70 (9.90−73.20) | 15.46 (7.17) 14.00 (9.70−56.90) | 15.91 (9.36) 14.10 (10.20−100.00) | 16.82 (9.80) 14.55 (9.80−95.40) | 0.588 |
| INR | 1.43 (0.86) 1.10 (0.90−6.50) | 1.35 (0.70) 1.20 (0.90−6.10) | 1.39 (0.86) 1.20 (0.90−8.80) | 1.51 (1.21) 1.20 (0.90−13.20) | 0.497 |
| TC (mg/dL) | 140.37 (42.27) 138.00 (68.00−288.00) | 137.87 (47.51) 130.00 (54.00−359.00) | 142.08 (47.54) 134.50 (57.00−348.00) | 147.59 (56.87) 143.00 (51.00−413.00) | 0.175 |
| WBC×109/L | 11.15 (5.06) 10.40 (3.10−33.80) | 12.15 (11.96) 10.29 (1.70−166.40) | 11.69 (5.40) 10.20 (1.20−45.00) | 13.80 (7.65) 11.90 (1.60−54.30) | 0.003 |
| Gender | <0.001 | ||||
| Male | 47.23% | 55.98% | 64.96% | 63.40% | |
| Female | 52.77% | 44.02% | 35.04% | 36.60% | |
| Hypertension | 0.002 | ||||
| No | 52.34% | 54.70% | 55.98% | 68.51% | |
| Yes | 47.66% | 45.30% | 44.02% | 31.49% | |
| Ventilation | <0.001 | ||||
| No | 64.68% | 64.10% | 59.40% | 48.51% | |
| Yes | 35.32% | 35.90% | 40.60% | 51.49% | |
| Death | 0.004 | ||||
| No | 85.96% | 92.31% | 94.02% | 85.96% | |
| Yes | 14.04% | 7.69% | 5.98% | 14.04% |
Results in the table: Mean + SD/N(%) or Mean(SD) Median (Min–Max)/N(%).
P-value*: For continuous variables, it is obtained by the Kruskal Wallis rank sum test. For count variables with theoretical numbers < 10, it is obtained by the Fisher's exact test. “APACHE” in the table refers to the raw, non-standardized cumulative values from the eICU database, used to reflect the relative differences in disease severity between groups, rather than the standard APACHE II score.
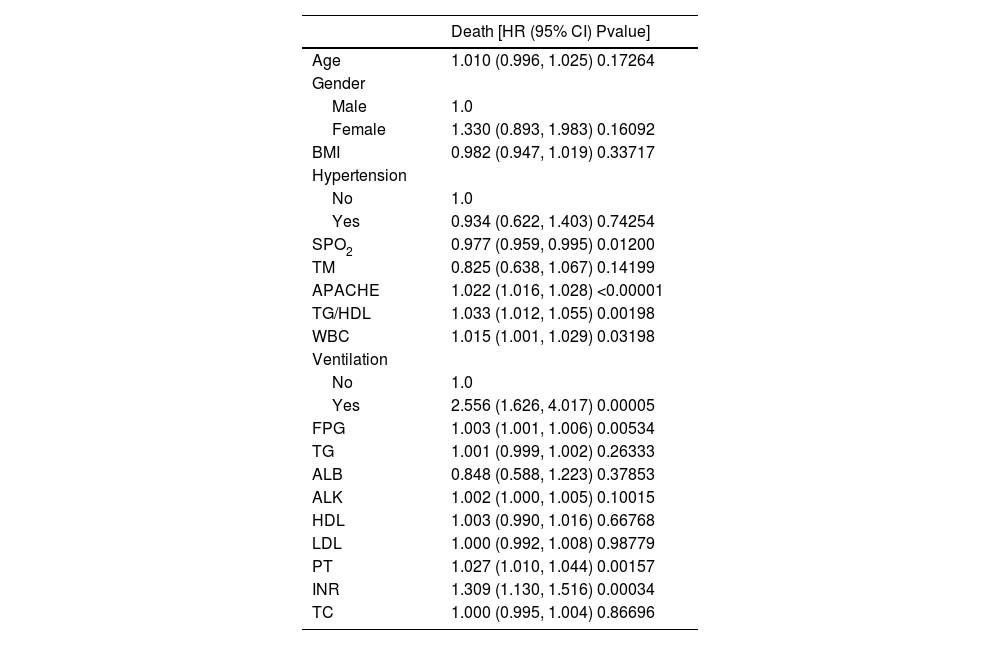
In this study, univariate analysis was conducted with all-cause mortality as the outcome variable (Table 2). TG/HDL ratio was significantly associated with all-cause mortality (p < 0.05), along with APACHE Ⅱ score, mechanical ventilation status, SPO2, FPG, PT, INR, and WBC (all p < 0.05, Table 2). Other variables showed no significant associations.
Univariate analysis.
| Death [HR (95% CI) Pvalue] | |
|---|---|
| Age | 1.010 (0.996, 1.025) 0.17264 |
| Gender | |
| Male | 1.0 |
| Female | 1.330 (0.893, 1.983) 0.16092 |
| BMI | 0.982 (0.947, 1.019) 0.33717 |
| Hypertension | |
| No | 1.0 |
| Yes | 0.934 (0.622, 1.403) 0.74254 |
| SPO2 | 0.977 (0.959, 0.995) 0.01200 |
| TM | 0.825 (0.638, 1.067) 0.14199 |
| APACHE | 1.022 (1.016, 1.028) <0.00001 |
| TG/HDL | 1.033 (1.012, 1.055) 0.00198 |
| WBC | 1.015 (1.001, 1.029) 0.03198 |
| Ventilation | |
| No | 1.0 |
| Yes | 2.556 (1.626, 4.017) 0.00005 |
| FPG | 1.003 (1.001, 1.006) 0.00534 |
| TG | 1.001 (0.999, 1.002) 0.26333 |
| ALB | 0.848 (0.588, 1.223) 0.37853 |
| ALK | 1.002 (1.000, 1.005) 0.10015 |
| HDL | 1.003 (0.990, 1.016) 0.66768 |
| LDL | 1.000 (0.992, 1.008) 0.98779 |
| PT | 1.027 (1.010, 1.044) 0.00157 |
| INR | 1.309 (1.130, 1.516) 0.00034 |
| TC | 1.000 (0.995, 1.004) 0.86696 |
Outcome variable: Death; Exposure variables: AGE; Gender; BMI; Hypertension; SPO2; TM; APACHE; TG/HDL; Ventilation; FPG; TG; ALB; ALK; HDL; LDL; PT; INR; TC; WBC; Adjustment variable: None; Cox model time variable: Hospital days. “APACHE” in the table refers to the raw, non-standardized cumulative values from the eICU database, used to reflect the relative differences in disease severity between groups, rather than the standard APACHE II score.
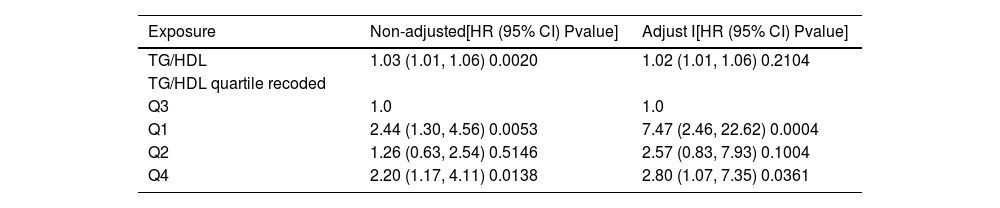
In this study, three types of regression analyses were conducted, namely unadjusted, adjusted for age and gender, and adjusted for multiple variables (Table 3). The relationship between TG/HDL quartiles and all-cause mortality was more evident after adjustment. After adjustment, compared with the Q3 group, the all-cause mortality risk in the Q1 group was significantly increased (P < 0.001), and the all-cause mortality risk in the Q4 group was also increased compared with the Q3 group (P < 0.05), while there was no significant correlation between the Q2 group and the Q3 group (P > 0.05). This indicates that TG/HDL is an important influencing factor for all-cause mortality in obese sepsis patients, and its correlation remains significant after considering various confounding factors. Meanwhile, the relationship between its quartile grouping and all-cause mortality presents a specific pattern after adjustment.
Analysis of multiple regression equations.
| Exposure | Non-adjusted[HR (95% CI) Pvalue] | Adjust Ⅰ[HR (95% CI) Pvalue] |
|---|---|---|
| TG/HDL | 1.03 (1.01, 1.06) 0.0020 | 1.02 (1.01, 1.06) 0.2104 |
| TG/HDL quartile recoded | ||
| Q3 | 1.0 | 1.0 |
| Q1 | 2.44 (1.30, 4.56) 0.0053 | 7.47 (2.46, 22.62) 0.0004 |
| Q2 | 1.26 (0.63, 2.54) 0.5146 | 2.57 (0.83, 7.93) 0.1004 |
| Q4 | 2.20 (1.17, 4.11) 0.0138 | 2.80 (1.07, 7.35) 0.0361 |
Outcome variable: Death; Exposure variables: TG/HDL; TG/HDL quartile; Non-adjusted model adjust for: None; Adjust I model adjust for: AGE; Gender; Hypertension; SPO2; APACHE; APS; Ventilation; FPG; ALK; PT; INR; WBC; TM; TC; ALB; Cox model time variable: Hospital days.
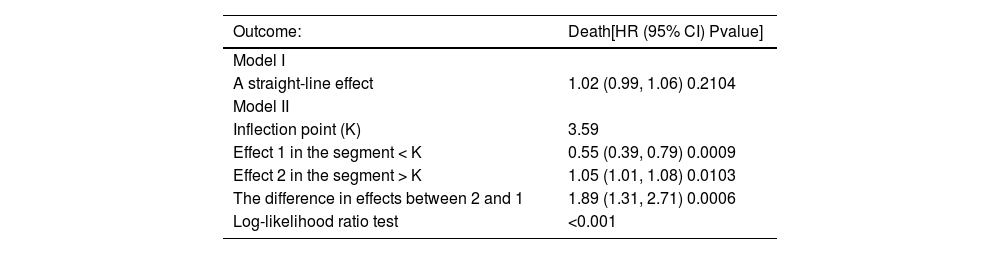
The data with TG/HDL < 8 was analyzed (Table 4). In the threshold effect analysis, Model I showed that it was not a straight line (P > 0.05), and the log-likelihood ratio test indicated that Model II was better (P < 0.001), meaning that there might be a nonlinear relationship between TG/HDL and all-cause mortality, and Model II was applied for fitting. There was an inflection point (K = 3.59) in Model II, and the effects before and after the inflection point were different. The effect in the segment < K was significant (P < 0.001), and the mortality rate decreased when TG/HDL increased; the effect in the segment > K was also significant (P < 0.05), and the mortality rate increased when TG/HDL increased, and the difference in the effects of the two segments was significant (P < 0.001).
Threshold effect analysis.
| Outcome: | Death[HR (95% CI) Pvalue] |
|---|---|
| Model I | |
| A straight-line effect | 1.02 (0.99, 1.06) 0.2104 |
| Model II | |
| Inflection point (K) | 3.59 |
| Effect 1 in the segment < K | 0.55 (0.39, 0.79) 0.0009 |
| Effect 2 in the segment > K | 1.05 (1.01, 1.08) 0.0103 |
| The difference in effects between 2 and 1 | 1.89 (1.31, 2.71) 0.0006 |
| Log-likelihood ratio test | <0.001 |
Outcome variable: Death; Exposure variable: TG/HDL; Adjustment variables: AGE; Gender; Hypertension; SPO2; TM; APACHE; APS; Ventilation; FPG; ALB; ALK; PT; INR; TC; WBC; Cox model time variable: Hospital days.
The smooth curve fitting showed that the curve was U-shaped (Fig. 1). This indicates that the impact of TG/HDL on all-cause mortality changes significantly before and after the inflection point, presenting a nonlinear relationship, which provides a basis for in-depth understanding of the relationship between TG/HDL and the prognosis of obese sepsis patients.
K–M survival curves
The K–M curves of TG/HDL quartiles showed that there was a U-shaped curve relationship between TG/HDL and survival rate (P < 0.05), that is, as the value of TG/HDL changes, the survival rate first decreases and then increases (Fig. 2). This indicates that there is a complex nonlinear association between TG/HDL and the survival rate of obese sepsis patients, and the survival rate first decreases and then increases with the change of TG/HDL value.
Subgroup analysis
In this study, subgroup analysis was carried out for several important variables, including SPO2, Tm, Acute Physiology and Chronic Health Evaluation (APACHE), Acute Physiology Score (APS), FPG, gender, hypertension, and whether mechanical ventilation was performed or not (Fig. 3). During the entire analysis process, the interaction of each variable under different grouping situations was examined in detail, and the significance of the interaction was evaluated by calculating its P-value. The research results showed that the P-values of the interaction of most variables in their respective groups were greater than 0.05, which means that there was no significant interaction between the variables in these grouping situations. However, it is worth noting that subgroup analysis performed to evaluate the interaction between hypertension and TG/HDL ratio on mortality revealed a significant interaction (P = 0.04), indicating that there was a significant interaction within the grouping analysis of the variable "Hypertension". This significant interaction may imply deeper physiological mechanisms or clinical associations, which is of important research value and worthy of further exploration and analysis in subsequent studies, so as to better understand the roles and interrelationships of these variables in relevant physiological or pathological processes.
Discussion
The TG/HDL ratio offers clinical value as a readily accessible prognostic marker in obese sepsis patients. By identifying patients in the extreme quartiles (Q1 and Q4), clinicians can prioritize intensive monitoring for early signs of decompensation. For example, a baseline TG/HDL ratio <1.5 (Q1) may prompt closer evaluation of immune function, while a ratio >4.0 (Q4) could indicate a need for aggressive lipid profile management and cardiovascular protection. Patients in Q1 (low TG/HDL) may benefit from immunomodulatory interventions (e.g., immune globulin supplementation), whereas those in Q4 (high TG/HDL) might require early lipid-lowering therapies (e.g., statins) to mitigate oxidative stress and endothelial damage. However, these hypotheses require validation in prospective trials. Notably, the retrospective design of this study precludes definitive treatment recommendations, and no causal relationship between TG/HDL and mortality was established.
In the study of obese sepsis patients, this study found that there was a U-shaped curve relationship between baseline TG/HDL (measured at ICU admission) and mortality, and the populations in the lowest quartile (Q1) and the highest quartile (Q4) of TG/HDL had significantly higher mortality risks. This result is somewhat related to the findings of some previous studies in similar fields. Jing Chen et al. proposed that the levels of TG and HDL-C have a protective effect on sepsis.12 Sang Hoon Lee et al. believed that the level of TG is associated with the mortality rate of sepsis patients. This may be due to the changes in lipid metabolism during sepsis, which thereby regulate the host's response to inflammation in critically ill patients.13 From a metabolic perspective, a low level of TG/HDL may reflect an imbalance in the physiological state within the patient's body, which is consistent with the currently widely recognized theory of lipid metabolism.14 As Baneu P stated, changes in the activity of key enzymes and an imbalance in hormonal regulation during lipid metabolism may all lead to a decrease in TG/HDL.15 This metabolic abnormality will affect the body's coping ability in the context of sepsis, making patients more prone to adverse prognoses, which has been confirmed in this study.
As the TG/HDL level rises from Q1 to Q2 and Q3, the hazard ratio gradually decreases and remains relatively stable in this study. This relatively stable interval indicates that the lipid metabolism and related physiological processes of the patients may be in a relatively balanced state, with better tolerance to sepsis, thus resulting in a relatively small impact of TG/HDL on mortality. This provides a more detailed basis for further understanding the mechanism of action of TG/HDL at different levels. This is consistent with the finding of Ting-Yue Feng that a high TG/HDL level increases the risk of adverse consequences when studying the relationship between dyslipidemia and cardiovascular events in sepsis patients.16 An excessively high TG/HDL ratio reflects severe lipid metabolism disorders, which has been elaborated in detail in the research by Xiangming Ma et al. Through the analysis of multiple data, that research found that TG/HDL is closely related to MAFLD, demonstrating the significance of TG/HDL in lipid metabolism.17 In the special population of obese sepsis patients who already have inflammatory responses and metabolic abnormalities, an excessively high TG/HDL will exacerbate the pathological process. For example, it promotes the development of atherosclerosis and affects cardiovascular function, thereby increasing the risk of cardiovascular events and leading to a rise in mortality. This series of mechanisms are mutually corroborated in the research results of this study and other related literature, further emphasizing the harm of an excessively high TG/HDL level in obese sepsis patients.18–20
The U-shaped curve relationship between TG/HDL and the mortality rate of obese sepsis patients revealed by this study has stronger pertinence and operability in clinical practice compared with previous studies. Although previous literature also mentioned the importance of TG/HDL in diseases, it lacked detailed management suggestions based on different positions of the U-shaped curve like this study.21 In clinical practice, doctors should not only focus on whether TG/HDL is within the normal range but also need to consider its specific position on the U-shaped curve. This view is in line with the concept of individualized assessment of long-term heart disease risk proposed by Ting-Yue Feng.16 For patients in Q1 and Q4, monitoring and management should be strengthened.
Although Q1 and Q4 groups did not differ significantly in baseline comorbidities (e.g., diabetes, coronary artery disease), Q4 patients exhibited lower albumin levels (2.8 ± 0.6 vs. 3.0 ± 0.5 g/dL, p < 0.001) and higher inflammatory markers (WBC 13.8 ± 7.7 vs. 11.2 ± 5.1 ×10⁹/L, p = 0.003), suggesting a profile of malnutrition and immune suppression likely driven by acute inflammatory dysregulation, such as severe sepsis-induced lipolysis inhibition and reduced HDL biogenesis. In contrast, Q4 patients had higher APACHE II scores (68.3 ± 31.8 vs. 58.8 ± 24.6, p < 0.001), and a high TG/HDL ratio likely stemming from chronic metabolic abnormalities (e.g., insulin resistance, dyslipidemia) exacerbated by acute stress, leading to triglyceride accumulation and HDL depletion. Hypertension further interacts with this pathway via renin-angiotensin system activation, enhancing vascular inflammation and lipid peroxidation in Q4 patients.
This study has several limitations. First, its retrospective design precludes causal inference and may be subject to unmeasured confounding (e.g., genetic factors, treatment protocols). Second, the single-center sample (n = 938) limits generalizability. Third, only baseline TG/HDL ratios were analyzed, without capturing dynamic changes during ICU stay, which may require time-dependent Cox models for validation.
Although the data sources in this study are reliable and detailed analyses have been provided, external validation was not conducted. The conclusion regarding the relationship between TG/HDL and all-cause mortality was drawn solely based on the data of 938 obese sepsis patients in the eICU database. This reduces the universality and reliability of the results and limits their extensive application in clinical practice and the academic field. Therefore, subsequent studies can further verify and deepen the relationship between the TG/HDL ratio and all-cause mortality in obese sepsis patients through improvement means such as multi-center data validation, long-term follow-up studies, comparison of different populations, combination with other risk indicators, and exploration of clinical intervention studies, thereby enhancing the reliability and clinical application value of the research.
ConclusionIn conclusion, this study clearly shows that there is a U-shaped curve relationship between TG/HDL and the mortality rate of obese sepsis patients. Patients with a low level of TG/HDL (Q1) have a high mortality risk, which remains significant even after multivariate adjustment and is an independent risk factor. The mortality risk of patients with an intermediate level (Q2–Q3) is relatively low. The mortality risk of patients with a high level of TG/HDL (Q4) increases again. This relationship has important guiding significance in clinical practice. Doctors should pay attention to the position of TG/HDL in the U-shaped curve, strengthen the monitoring and management of patients in Q1 and Q4. Clinicians should monitor baseline TG/HDL ratios and prioritize intensive care for patients in Q1 and Q4. Prospective studies are needed to validate intervention strategies. For those with a high level, lipid metabolism needs to be regulated and related risk factors need to be controlled. These measures are helpful in reducing the mortality risk and improving the prognosis, providing a comprehensive reference basis for clinical treatment and research.
CRediT authorship contribution statementAll authors contributed toward data analysis, drafting, and revising the paper and agreed to be accountable for all aspects of the work. YW: Data curation, Writing original draft, Writing – review & editing, Methodology, Project administration, Software. YS: Methodology, Supervision, Writing – review & editing. RW: Methodology. RG: Methodology. QL: Supervision. YW: Software. WZ: Funding acquisition, Supervision, Writing – review & editing. LW: Funding acquisition, Supervision, Writing – review & editing.
Informed consent statementThe collection of bacterial strains was conducted in accordance with relevant clinical guidelines. Ethical approval was not required for this study as all patient-identifiable information was removed during the experimental process.
Declaration of Generative AI and AI-assisted technologies in the writing processThis work was completed without the use of any form of Artificial Intelligence (AI) tools or assistance.
FundingThis study was supported by the Hospital Fund of Gansu Provincial (No. 24GSSYD-3), Doctoral supervisor cultivation project at Gansu Provincial Hospital (No. 22GSSYA-2) and General Project of Joint Research Fund (No. 25JRRA1210). The funders had no role in study design, data collection and analysis, decision to publish or preparation of the manuscript.
The author declares no conflicts of interest in this work, encompassing employment, consultancies, stock ownership, honoraria, expert testimony for payment, patent applications or registrations, and grants or other financial support.

