

Metabolic acidosis is associated with high mortality. Despite theoretical benefits of sodium-bicarbonate (SB), current evidence remains controversial. We investigated SB-related effects on outcomes in ICU patients with metabolic acidosis.
DesignRetrospective analysis.
SettingAcademic medical center.
Patients or participants971 ICU patients with metabolic acidosis defined as arterial pH<7.3 and CO2<45mmHg treated between 2012 and 2016. A propensity score (PS) was estimated using logistic regression. Patients were matched in pairs using the PS.
Interventions441 patients were treated with SB 8.4% (SB-group) and n=530 patients were not (control group).
Main variables of interestPrimary outcome was all-cause mortality at ICU-discharge. Average Treatment Effect (ATE), Average Treatment effect in Treated (ATT), and estimated relative survival effects at 20 days were computed.
ResultsIn the full cohort, we observed considerable differences in pH, base excess, additional acidosis-related indices, and ICU mortality (controls 31% vs. SB-group 56%, p<.001) at baseline between the two groups. After PS-matching (n=174 in each group), no significant difference in ICU mortality was observed (controls 32% vs. SB-group 41%; p=.07). Odds ratios (OR) for ATE and ATT showed no association with ICU mortality (OR ATE: 1.08, 95%-CI 0.99–1.17; p=.08; OR ATT 1.09; 95%-CI 0.99–1.2; p=.09). Hazard ratios at 20-days (multivariable HR, matched sample n=348: 1.16, 95%-CI 0.86–1.56, p=.33) showed similar survival in the two study groups.
ConclusionsWe did not observe effects of SB infusion on all-cause mortality in critically ill patients with metabolic acidosis.
La acidosis metabólica se asocia con una alta mortalidad. A pesar de los beneficios teóricos del bicarbonato de sodio (BS), la evidencia actual sigue siendo controvertida. Investigamos los efectos relacionados con el BS sobre los resultados en pacientes de la UCI con acidosis metabólica.
DiseñoAnálisis retrospectivo.
ÿmbitoCentro médico académico.
Pacientes o participantesSe incluyeron 971 pacientes de la Unidad de Cuidados Intensivos (UCI) con acidosis metabólica (pH < 7,3, CO2 < 45 mmHg) tratados entre 2012 y 2016. Se calculó una puntuación de propensión (PS) mediante regresión logística. Los pacientes se emparejaron utilizando el PS.
Variables de interés principalesIntervenciones; 441 pacientes fueron tratados con BS 8,4% (grupo BS) y n = 530 pacientes no (grupo control).
ResultadosEl resultado primario fue la mortalidad por todas las causas al alta de la UCI. Se calcularon el efecto promedio del tratamiento (ATE), el efecto promedio del tratamiento en los tratados (ATT) y los efectos de supervivencia relativa estimados a los 20 días. En la cohorte completa se observaron diferencias considerables en el pH, el exceso de bases y la mortalidad en la UCI (control 31% vs. grupo BS 56%, p < 0,001) al inicio del estudio entre los grupos. Después del emparejamiento de PS (n = 174 en cada grupo), no se observaron diferencias significativas en la mortalidad en la UCI (control 32% vs. grupo BS 41%; p = 0,07). Los odds ratios (OR) para ATE y ATT no mostraron asociación con la mortalidad en la UCI (OR ATE: 1,08, IC 95%; 0,99-1,17; p = 0,08; OR ATT 1,09; IC 95%; 0,99-1,2; p = 0,09). Los cocientes de riesgo a los 20 días (HR multivariable, muestra emparejada n = 348: 1,16, IC 95%; 0,86-1,56, p = 0,33) mostraron una supervivencia comparable.
ConclusionesNo observamos efectos de la infusión de BS sobre la mortalidad por todas las causas en pacientes con acidosis metabólica.
Metabolic acidosis (arterial pH<7.3) is observed in about 8% of intensive care unit (ICU) admissions1 and is associated with particularly high mortality (up to 57%).1,2 The etiology of severe metabolic acidosis typically includes tissue hypoxemia, shock, diabetic ketoacidosis, hepatic and renal failure, and intoxications.2 Metabolic acidosis has numerous deleterious consequences on various physiological systems, including enzyme-/protein functionality, tissue metabolism, and increased production of nitric oxide leading to vasodilatation,3 which may further amplify organ dysfunction. Furthermore, acidosis is associated with reduced adrenoceptor numbers on cellular surfaces,3 depression of myocardial function including contractility and relaxation,3,4 cardiac arrhythmia,3 and a shift of the oxyhemoglobin dissociation curve.3
Previous data show that low serum bicarbonate levels predict mortality at ICU admission in e.g. cardiogenic shock patients.5,6 Intravenous sodium bicarbonate can be applied to rapidly correct metabolic acidosis and reports indicate that about two thirds of North American critical care specialists prescribe sodium bicarbonate for this purpose.7 However, it remains uncertain whether metabolic acidosis should be corrected using sodium bicarbonate (or other buffers).8,9 Importantly, there are concerns that sodium bicarbonate therapy could lead to sodium and/or fluid overload, increased lactate and/or carbon dioxide production, and/or decreased ionized serum calcium.10 Thus, sodium bicarbonate might theoretically worsen the outcome of affected patients.11
Current evidence on whether sodium bicarbonate impacts on mortality in the critically ill is controversially discussed, with sparse data from mostly retrospective studies12–14 available.
As most of the available studies are performed in acidotic patients with sepsis13,15 or hyperlactatemia,12,16 we thus embarked to perform a retrospective analysis with the primary objective to investigate whether infusion of sodium-bicarbonate impacts on all-cause mortality in critically ill patients with all-cause metabolic acidosis including but not restricted to septic and lactic acidosis.
Patients and methodsPatientsA monocentric propensity-score matched analysis of electronic patient charts was performed. Patients were treated at the Department of Intensive Care Medicine, University of Bern, Switzerland, between January 2012 and December 2016. Patients were excluded when any of the following criteria was met I) refusal to provide general consent for use of electronic health care data for patients treated after January 1st 2015 (standardized general consent [GC] procedure established in the Department of Intensive Care Medicine), and II) patients with incomplete basic datasets in regard to age, gender, Acute Physiology and Chronic Health Evaluation (APACHE) II-Score at ICU-admission, discharge data and/or ICU mortality data. Routinely recorded data from electronic patient charts was assessed (Centricity Critical Care; General Electrics, Helsinki, Finland).
The study was approved by the local Ethics Committee on Human Research (Kantonale Ethikkommission, KEK, Bern, Nr. 2018-01829), who waived the need for individual written informed consent due to the GC procedure described above. Patients were grouped for treatment with sodium bicarbonate 8.4% during the ICU stay vs. without sodium-bicarbonate into sodium bicarbonate (SB) and control groups (noSB). We chose the sodium bicarbonate 8.4% concentration as this is the formulation of choice in our ICU to treat severe acidemia if necessary. For the preliminary data selection, we used the available basic data set (age, gender, and APACHE II scores at ICU admission) to pair control patients to sodium bicarbonate treated patients in a 3:1 ratio to gain a meaningful subset of ICU patients with comparable baseline disease severity.
Primary and secondary outcomesPrimary outcome was all-cause mortality (crude and adjusted) at ICU-discharge and all-cause mortality at hospital discharge in patients with (non-respiratory) metabolic acidosis (defined as pH≤7.3, pCO2<45mmHg) treated with versus without sodium bicarbonate infusion. Secondary objectives were excess mortality (mortality beyond ICU mortality) at 30 days, at one year following ICU discharge and excess mortality after more than one year until the last-possible follow-up (hospital discharge until September 2019) to better differentiate a short term effect from a hypothetical long term effect.
Variables collected/study dataData was derived from electronic patient charts. Source data were double checked by two individual ICU physicians (JW and BH) before extraction. Inconsistencies were discussed and a consensus was sought between the two examiners. The following routinely collected data were available: patient age, diagnostic and comorbidity groups (APACHE IV diagnostic groups), body mass index (BMI), APACHE II scores, time of ICU admission/discharge, time of hospital admission/discharge, cumulative dose of sodium-bicarbonate received, laboratory data at admission including arterial pH, arterial carbon dioxide (paCO2), base excess (BE), bicarbonate (HCO3−), lactate, sodium, potassium, hemoglobin (Hb), creatinine, time on and cumulative dose of vasopressors/inotropes (noradrenaline, adrenaline, dobutamine), total volume of packed red blood cells (RBC) and fresh frozen plasma (FFP), need for renal replacement therapy (RRT), time on mechanical ventilation (in- to extubation), length of stay (LOS) in ICU/hospital, vital status at ICU- and hospital discharge (alive/dead), time of death.
Statistical analysisWe explored the marginal univariate distributions of the treatment variables in the “crude‿ data set (Suppl. Fig. 1). Due to asymmetry in the continuous variables we report the p-values of Kolmogorov-Smirnov test for continuous variables and chi-squared test for categorical variables (for the null hypothesis of equal frequencies between two groups). The p-values are to be interpreted as measure of dissimilarity (p-values close to 0 correspond to high dissimilarity).
A propensity score (PS) ê(x) was estimated using logistic regression in which the SB treatment status was regressed on pH, paCO2 and HCO3−. Pairs of treated and untreated patients were matched on the propensity score using a caliper of width 0.3 of the standard deviation of the logit of the propensity score (using the R package “Matching‿ by Diamond and Sekhon, 2013). We considered mortality at ICU discharge as well as death outcomes at hospital discharge, after 30 days, at one year and death after more than one year (after hospital discharge until maximum follow-up (the latter without ICU-mortality). Mortality occurrences were regressed on the set of covariates with logit logistic regression. The covariates for the full weighted sample were SB treatment status, propensity score, sex, age, BMI and APACHE II scores. In the matched sample, given that treated patients and controls were paired with respect to propensity scores (as well as pH, paCO2 and HCO3−), the covariates set was restricted to SB treatment status, sex, age, BMI and APACHE II.
The Average Treatment effect in Treated (ATT) is the expected effect of the treatment for individuals in the treatment group,17 while the average treatment effect (ATE) is the expected effect of the treatment across all individuals in the population. Randomized Clinical Trials (RCTs) are usually organized in such way that ATE equals ATT (unless explicitly specified exceptions). Difference between ATE and ATT would indicate that the treatment assignment was not random or not random enough in the study considering covariates of interest. We computed the ATE Odds Ratio (OR) and ATT OR18 with standard errors by Abadie and Imbens (2006) on a matched sample19; as well as the ATE OR on the full sample with inverse weighting by ATE weights20 given by 1/(eˆ(x)) for the treated subjects and by 1/(1−eˆ(x)) for untreated; finally we provide an ATT OR on a full sample with inverse weighting by ATT weights21 given by 1 for the treated subjects and by eˆ(x)/(1−eˆ(x)) for untreated.
We estimated survival curves and relative survival effects with Cox regression models by regressing survival on SB treatment status, sex, age, BMI and APACHE II. Both analyses were done for the maximum follow-up as well as for a 20 days follow-up as for the majority of patients (97.5%) the ICU stay was below 20 days. In the “crude‿ unmatched dataset, we added the propensity score to the covariates set. We used a robust variance estimator to account for the clustering within the matched set and weighting in the “crude‿ samples.
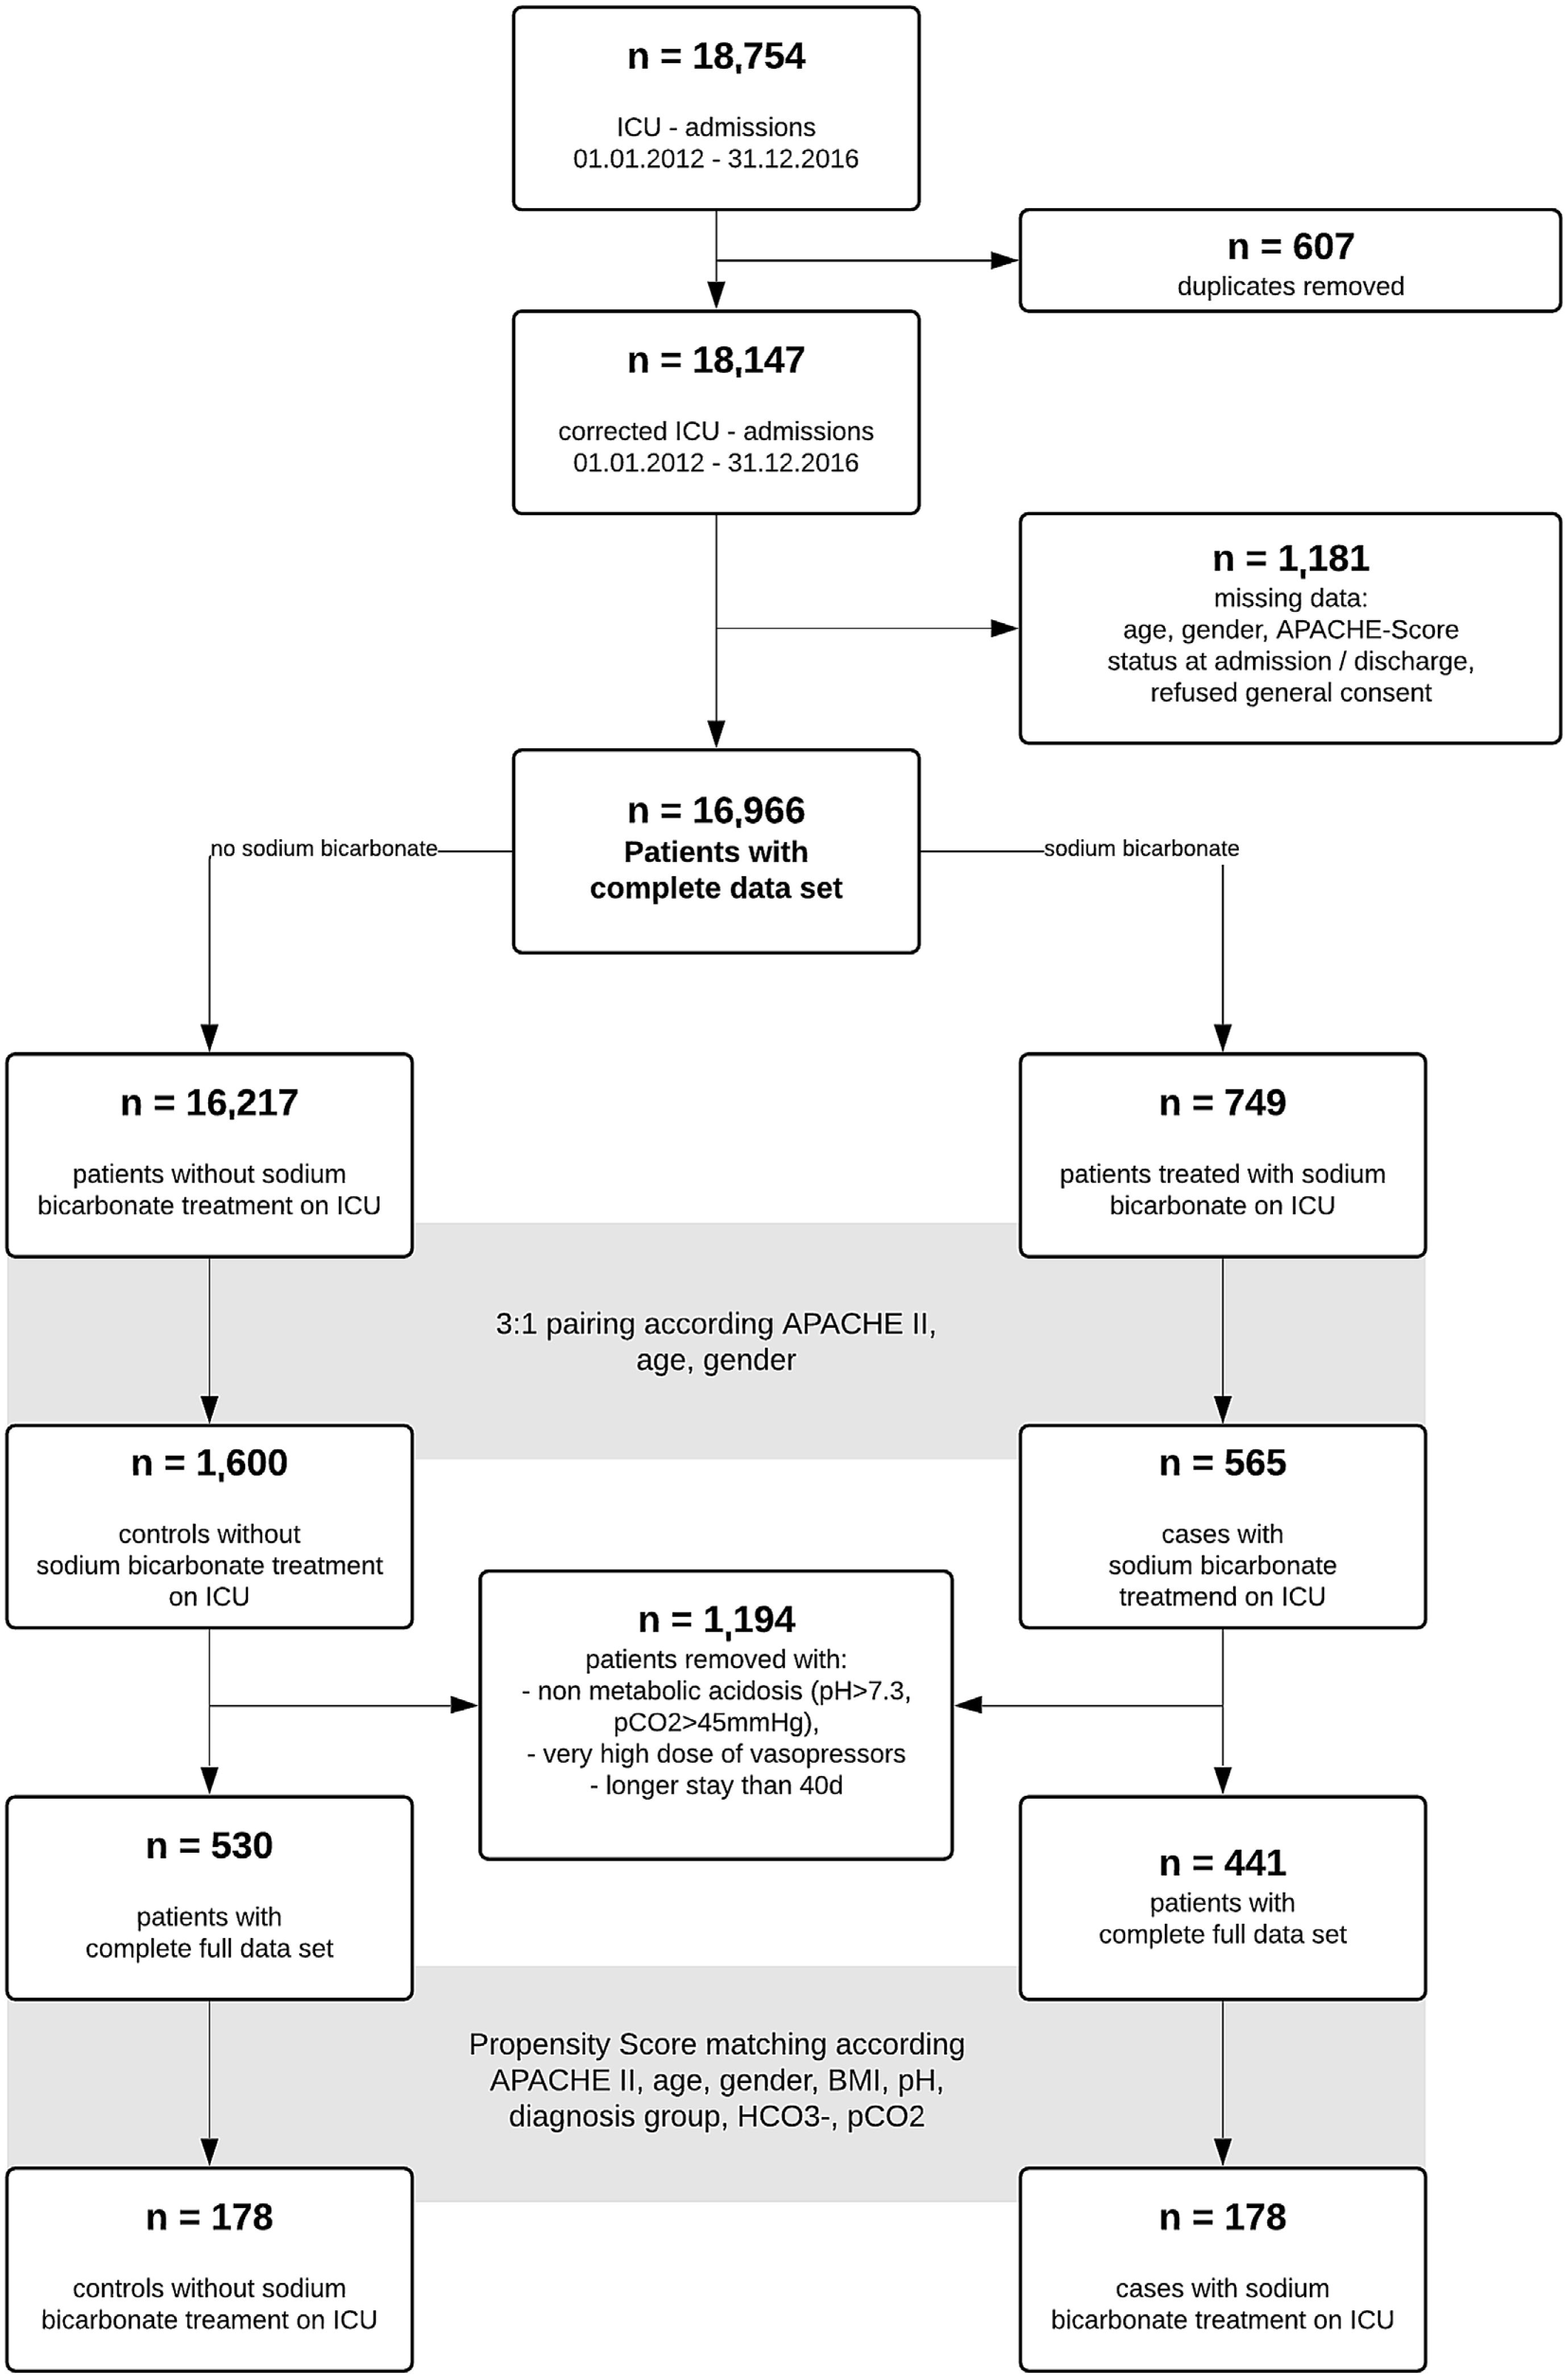
ResultsA total of 18,754 admissions of ICU patients were screened in the study interval. After removal of duplicates and patients with incomplete data sets, 16,966 data sets remained. Of these, 749 patients received sodium bicarbonate (SB group) during ICU stay. We performed a 1:3 pairing of patients with regard to age, gender and APACHE II score at ICU admission to narrow further data search on patients with comparable disease severity. For respective n=2165 patients, further data collection was performed. While exploring the data, we removed n=69 very extreme outliers with aberrant values (eventually data entry mistakes) in ICU length of stay and very high vasopressor support in addition to patients without acidosis (pH>7.3, n=1125). 441 (SB) and 530 (noSB) patients remained in the final “crude‿ dataset. A Consort flow chart is given (Fig. 1).
Patient characteristics of this “crude‿ data set are given in Table 1. Median dose of sodium bicarbonate 8.4% given in the SB-group was 100ml (interquartile range [IQR] 100–242ml). Patients received SB after a median time of 5.14h following ICU admission (IQR 14.64h). The SB-group had lower APACHE II scores than the noSB-group (median 30; IQR 11 vs. 32; IQR 19; p<0.001). Further, statistically significant differences were observed between groups regarding pH (SB median 7.17; IQR 0.15] vs. noSB 7.23; IQR0.09; p<0.01), arterial HCO3− (SB median 12.4mmol/l; IQR 8.11] vs. noSB 17.7mmol/l; IQR 5.28; p<0.001) and additional acidosis-related indices (Table 1). Patients in the SB group differed significantly from nonSB patients in regard to admission diagnosis such as sepsis, metabolic disorders, intoxications, need for vasoactives and blood products, and need for RRT (all p<0.05). ICU mortality was higher in the sodium-bicarbonate group (SB 46% vs noSB 31%; p<.001) (Table 1). Median time to death in non-survivors was 7.66 days (IQR 279.3days) in the noSB-Group vs. 3.32 days in the SB-group (IQR 37.53days) (p<.001).
Patient demographics, ICU treatment, and follow-up data of “crude‿ patient population.
| Variable | n(all)=971 | n(noSB)=530 | n(SB)=441 | n avail. obs. | p |
|---|---|---|---|---|---|
| Gender | Female: 318 (33%) | Female: 164 (31%) | Female: 154 (35%) | 971 | .21 |
| BMI (kg/m2) | 26.12 [6] | 26.12 [5.95] | 26.23 [6.26] | 971 | .77 |
| Age (years) | 67 [17.5] | 67 [17] | 66 [18] | 971 | .12 |
| APACHE II | 31 [10.5] | 32 [19] | 30 [11] | 971 | <.001 |
| DG Cardiovasc. | 342 (35%) | 191 (36%) | 151 (34%) | 971 | .61 |
| DG Respiratory | 176 (18%) | 114 (22%) | 62 (14%) | 971 | <.001 |
| DG Gastroint. | 107 (11%) | 49 (9%) | 58 (13%) | 971 | .07 |
| DG Neurological | 80 (8%) | 63 (12%) | 17 (4%) | 971 | <.001 |
| DG Trauma & TBI | 42 (4%) | 31 (6%) | 11 (2%) | 971 | .02 |
| DG Metabolic & Intox | 62 (6%) | 16 (3%) | 46 (10%) | 971 | <.001 |
| DG Haemat. disease | 17 (2%) | 9 (2%) | 8 (2%) | 971 | 1 |
| DG Renal | 16 (2%) | 8 (2%) | 8 (2%) | 971 | .91 |
| DG Sepsis | 99 (10%) | 40 (8%) | 59 (13%) | 971 | <.001 |
| apH | 7.21 [0.13] | 7.23 [0.09] | 7.17 [0.15] | 971 | <.001 |
| aHCO3(mmol/L) | 15.5 [6.4] | 17.7 [5.28] | 12.4 [8.11] | 971 | <.001 |
| aLactate (mmol/L) | 1 [1] | 0.9 [0.6] | 1.2 [2.4] | 971 | <.001 |
| apCO2(mmHg) | 28.7 [8.8] | 30.55 [7.28] | 26.1 [8] | 971 | <.001 |
| BE | −10.9 [−8] | −8.15 [−6.3] | −14.7 [7.7] | 971 | <.001 |
| Hc | 0.27 [0.07] | 0.28 [0.08] | 0.26 [0.07] | 934 | <.001 |
| Na (mmol/L) | 134 [6] | 134 [6] | 134 [6] | 957 | .8 |
| K (mmolL/) | 3.6 [0.7] | 3.6 [0.7] | 3.6 [0.8] | 957 | .21 |
| CreaS (mmol/L) | 110 [94.5] | 101 [88.5] | 120 [109] | 920 | <.001 |
| Adrenaline (y/n) | 440 (45%) | 193 (36%) | 247 (56%) | 971 | <.001 |
| Adrenaline CD (μg) | 3980.35 [9690.6] | 1661.96 [5100] | 6310.7 [10,871.1] | 440 | <.001 |
| Noradrenaline (y/n) | 676 (70%) | 340 (64%) | 336 (76%) | 971 | <.001 |
| Noradrenaline CD (μg) | 3091.82 [10,659.1] | 2133.73 [6632.2] | 4614.32 [15,641.4] | 676 | <.001 |
| Ventilation (y/n) | 640 (66%) | 372 (70%) | 268 (61%) | 971 | <.001 |
| Blood products (y/n) | 512 (53%) | 234 (44%) | 278 (63%) | 971 | <.001 |
| RRT (y/n) | 222 (23%) | 88 (17%) | 134 (30%) | 971 | <.001 |
| Length of ICU stay (days) | 2.57 [4.62] | 2.57 [4.26] | 2.58 [4.91] | 971 | .59 |
| Length of hospital stay (days) | 8 [15] | 7 [15] | 8 [16] | 937 | .14 |
| ICU mortality | 366 (38%) | 164 (31%) | 202 (46%) | 971 | <.001 |
| In-hospital excess mortality | 103 (11%) | 63 (12%) | 40 (9%) | 971 | .19 |
| 30d excess mortality | 84 (9%) | 54 (10%) | 30 (7%) | 971 | .08 |
| Excess mortality d31–365 | 69 (7%) | 40 (8%) | 29 (7%) | 971 | .64 |
| Excess mortality at last follow upa | 122 (13%) | 74 (14%) | 48 (11%) | 971 | 0.18 |
| Time to death (days) | 5.23 [92.4] | 7.66 [279.3] | 3.32 [37.53] | 722 | <.001 |
Median values [interquartile ranges] or numbers (percentages) are given. ‘p’ refers to Kolmogorov–Smirnov test for continuous variables, or to chi-squared test for categorical variables (for the null hypothesis of equal categorical frequencies between two groups). Laboratory data are at admission to ICU. NoSB, non sodium-bicarbonate recipients; SB, sodium-bicarbonate recipients; avail.obs., available observations; APACHE II, Acute Physiology and Chronic Health Evaluation-II-Score; DG, Diagnosis Group is referring to the APACHE IV-classification of diagnosis ad admission with a separate sepsis group (all groups include operative and non-operative diagnoses); Cardiovasc., Cardiovascular; Gastroint., Gastrointestinal; Haemat., Hematological; BE, base excess; Hc, hematocrit; Na, sodium; K, potassium; CreaS, serum creatinine; TBI, traumatic brain injury; NA, noradrenalin; CD, cumulative dose; RRT, renal replacement therapy; ICU, intensive care unit; d, day; y, yes; n, no.
A p value < 0.05 was considered statistically significant.
The ORs for the ATT with regard to (all-cause) ICU mortality and (all-cause) in-hospital excess mortality (mortality beyond ICU mortality) in the “crude‿ dataset adjusted for SB treatment status, sex, age, BMI and APACHE scores were 1.56 (95% confidence interval [CI] 1.17–2.07; p=.002) resp. 0.67 (95%CI 0.43–1.03; p=.07). The ATT OR for excess mortality at 30 days, between day 31 and 364 and over one year are 0.52 (95%CI 0.32–0.84; p=.007), 1.31 (95%CI 0.74–2.31; p=.357) and 0.72 (95%CI 0.47–1.09; p=.121) respectively (Supplement Table 1).
Propensity score analysisWe constructed the PS model that fitted to 971 observations and explained 34% of variability in treatment prescription. While dropping 615 observations (described in Suppl. Table 2), we achieved a sound matching between the treatment and control groups (Suppl. Fig. 2.).
Using propensity scores, we obtained a dataset with 348 patients equally split between the control and sodium bicarbonate groups. Patient characteristics are given (Fig. 1, Table 2). Median cumulative dose of sodium bicarbonate was 100ml (IQR 100, 200) applied after a median of 8.77h following ICU admission (IQR 2.56, 23.51). ICU-mortality, in-hospital excess mortality and excess mortality after hospital discharge as well as median time-to-death did not differ significantly (p for all >.05) (Table 2). Median hospital LOS was longer in the SB group than in the noSB group (9 days; IQR 17.2 days vs. 6 days; IQR16days; p=.01)
Patient demographics, ICU treatment, and follow-up data of propensity score matched patient population (n=348).
| Variable | n(no SB)=174 | n(SB)=174 | p |
|---|---|---|---|
| Gender | Female: 55 (32%) | Female: 50 (29%) | .64 |
| BMI (kg/m2) | 25.5 [6.25] | 26.83 [7.91] | .2 |
| Age (years) | 68 [16] | 68 [17] | .94 |
| APACHE II | 32 [8] | 28 [11] | <.001 |
| DG Cardiovascular | 68 (39%) | 55 (32%) | .18 |
| DG Respiratory | 18 (10%) | 33 (19%) | .03 |
| DG Gastrointestinal | 27 (16%) | 26 (15%) | 1 |
| DG Neurological | 15 (9%) | 10 (6%) | .41 |
| DG Trauma incl. TBI | 9 (5%) | 5 (3%) | .41 |
| DG Metabolic & Intox | 10 (6%) | 13 (7%) | .67 |
| DG Hemic disease | 3 (2%) | 3 (2%) | 1 |
| DG Renal | 4 (2%) | 2 (1%) | .68 |
| DG Sepsis | 15 (9%) | 18 (10%) | .71 |
| apH | 7.23 [0.08] | 7.23 [0.09] | 1 |
| aHCO3–(mmol/L) | 15.1 [3.4] | 15.25 [3.7] | 1 |
| aLactate (mmol/L) | 1 [0.8] | 1 [1.0] | .45 |
| apCO2(mmHg) | 28 [6.1] | 28.1 [6] | .99 |
| BE | −11 [−4.1] | −11.25 [−4] | .17 |
| Hc | 0.27 [0.07] | 0.26 [0.07] | .98 |
| Na (mmol/L) | 134 [4.2] | 134 [6] | .98 |
| K (mmol/L) | 3.6 [0.7] | 3.6 [0.8] | .98 |
| CreaS (mmol/L) | 118 [84.5] | 125 [131] | <.001 |
| Adrenaline (y/n) | 76 (44%) | 85 (49%) | .39 |
| Adrenaline CD (μg) | 2675.07 [11,215.1] | 5956.06 [11,098.4] | .13 |
| Noradrenaline (y/n) | 109 (63%) | 135 (78%) | <.001 |
| Noradrenaline CD (μg) | 2471.82 [6512.9] | 3330.52 [13,183.4] | .09 |
| Ventilation (y/n) | 126 (72%) | 111 (64%) | .11 |
| Blood Products (y/n) | 91 (52%) | 111 (64%) | .04 |
| RRT (y/n) | 44 (25%) | 43 (25%) | 1 |
| Length of ICU stay (days) | 2.65 [4.2] | 2.87 [5.1] | .54 |
| Length of hospital stay (days) | 6 [16] | 9 [17.2] | .01 |
| ICU mortality | 55 (32%) | 72 (41%) | .07 |
| InHospital excess mortality | 22 (13%) | 18 (10%) | .61 |
| 30d excess mortality | 20 (11%) | 11 (6%) | .13 |
| Excess mortality d31–365 | 12 (7%) | 15 (9%) | .69 |
| Excess mortality at last follow upa | 26 (15%) | 23 (13%) | .76 |
| Time to death (days) | 5.22 [274.9] | 6.25 [47.3] | .91 |
Median values [interquartile ranges] or counts (percentages) are given. ‘p’ refers to Kolmogorov–Smirnov test for continuous variables, or to chi-squared test for categorical variables (for the null hypothesis of equal categorical frequencies between two groups). Laboratory data are at admission to ICU. DG, Diagnosis Group is referring to the APACHE IV-classification of diagnosis ad admission with a separate sepsis group (all groups include operative and non-operative diagnoses); Cardiovasc., Cardiovascular; Gastroint., Gastrointestinal; Haemat., Hematological; NoSB, non sodium bicarbonate recipients; SB, sodium-bicarbonate recipients; APACHE II, Acute Physiology and Chronic Health Evaluation II Score; Hc, hematocrit; Na, sodium; K, potassium; CreaS, serum creatinine; TBI, traumatic brain injury; CD, cumulative dose; RRT, renal replacement therapy; ICU, intensive care unit.
A p value < 0.05 was considered statistically significant.
In the matched data set, we observed no association of sodium bicarbonate with ICU-mortality or death outcomes neither in the ATE OR nor in the ATT OR (Table 3).
Odds ratios (OR) for treatment effects for mortality in the matched dataset.
| ATE (matched sample), n=348 | p-Value | ATT (matched sample), n=348 | p-Value | |
|---|---|---|---|---|
| ICU mortality | 1.08 (0.991, 1.17) | .08 | 1.09 (0.987, 1.2) | .09 |
| In Hospital excess mortality | 0.982 (0.924, 1.04) | .55 | 0.984 (0.92, 1.05) | .62 |
| 30d excess mortality | 0.96 (0.91, 1.01) | .13 | 0.958 (0.903, 1.02) | .16 |
| Excess mortality d31–365 | 1.02 (0.968, 1.08) | .44 | 1 (0.94, 1.06) | .98 |
| Excess mortality at last follow-upa | 0.994 (0.935, 1.06) | .82 | 0.993 (0.928, 1.06) | .83 |
Reported are the odds ratios (OR) for the treatment effects for mortality at various stages in presence of sodium bicarbonate treatment. Estimated by logit logistic regressions, regressing mortality outcome on SB treatment status, sex, age, BMI and APACHE.
As for the majority of patients (97.5%), ICU length of stay was below 20 days, we estimated crude Kaplan–Meier survival curves up to 20 days (i.e. if death did not occur after 20 days from admission, we reported it as no death event during 20 days). The Kaplan–Meier estimate of the “crude‿ data showed that the patients who received the sodium bicarbonate treatment had considerably lower survival probability (log-rank test: p=.005; Fig. 2), while using the matched data, there was no significant difference (stratified log-rank test p=.53). Applying the ATE and ATT weights in the “crude‿ sample (n=971) did not result in a difference in probability of survival (stratified log-rank test p=.91 and .98, respectively) (Fig. 2). Estimating Kaplan–Meier survival curves for the whole follow-up time showed no different results (Suppl. Fig. 3).
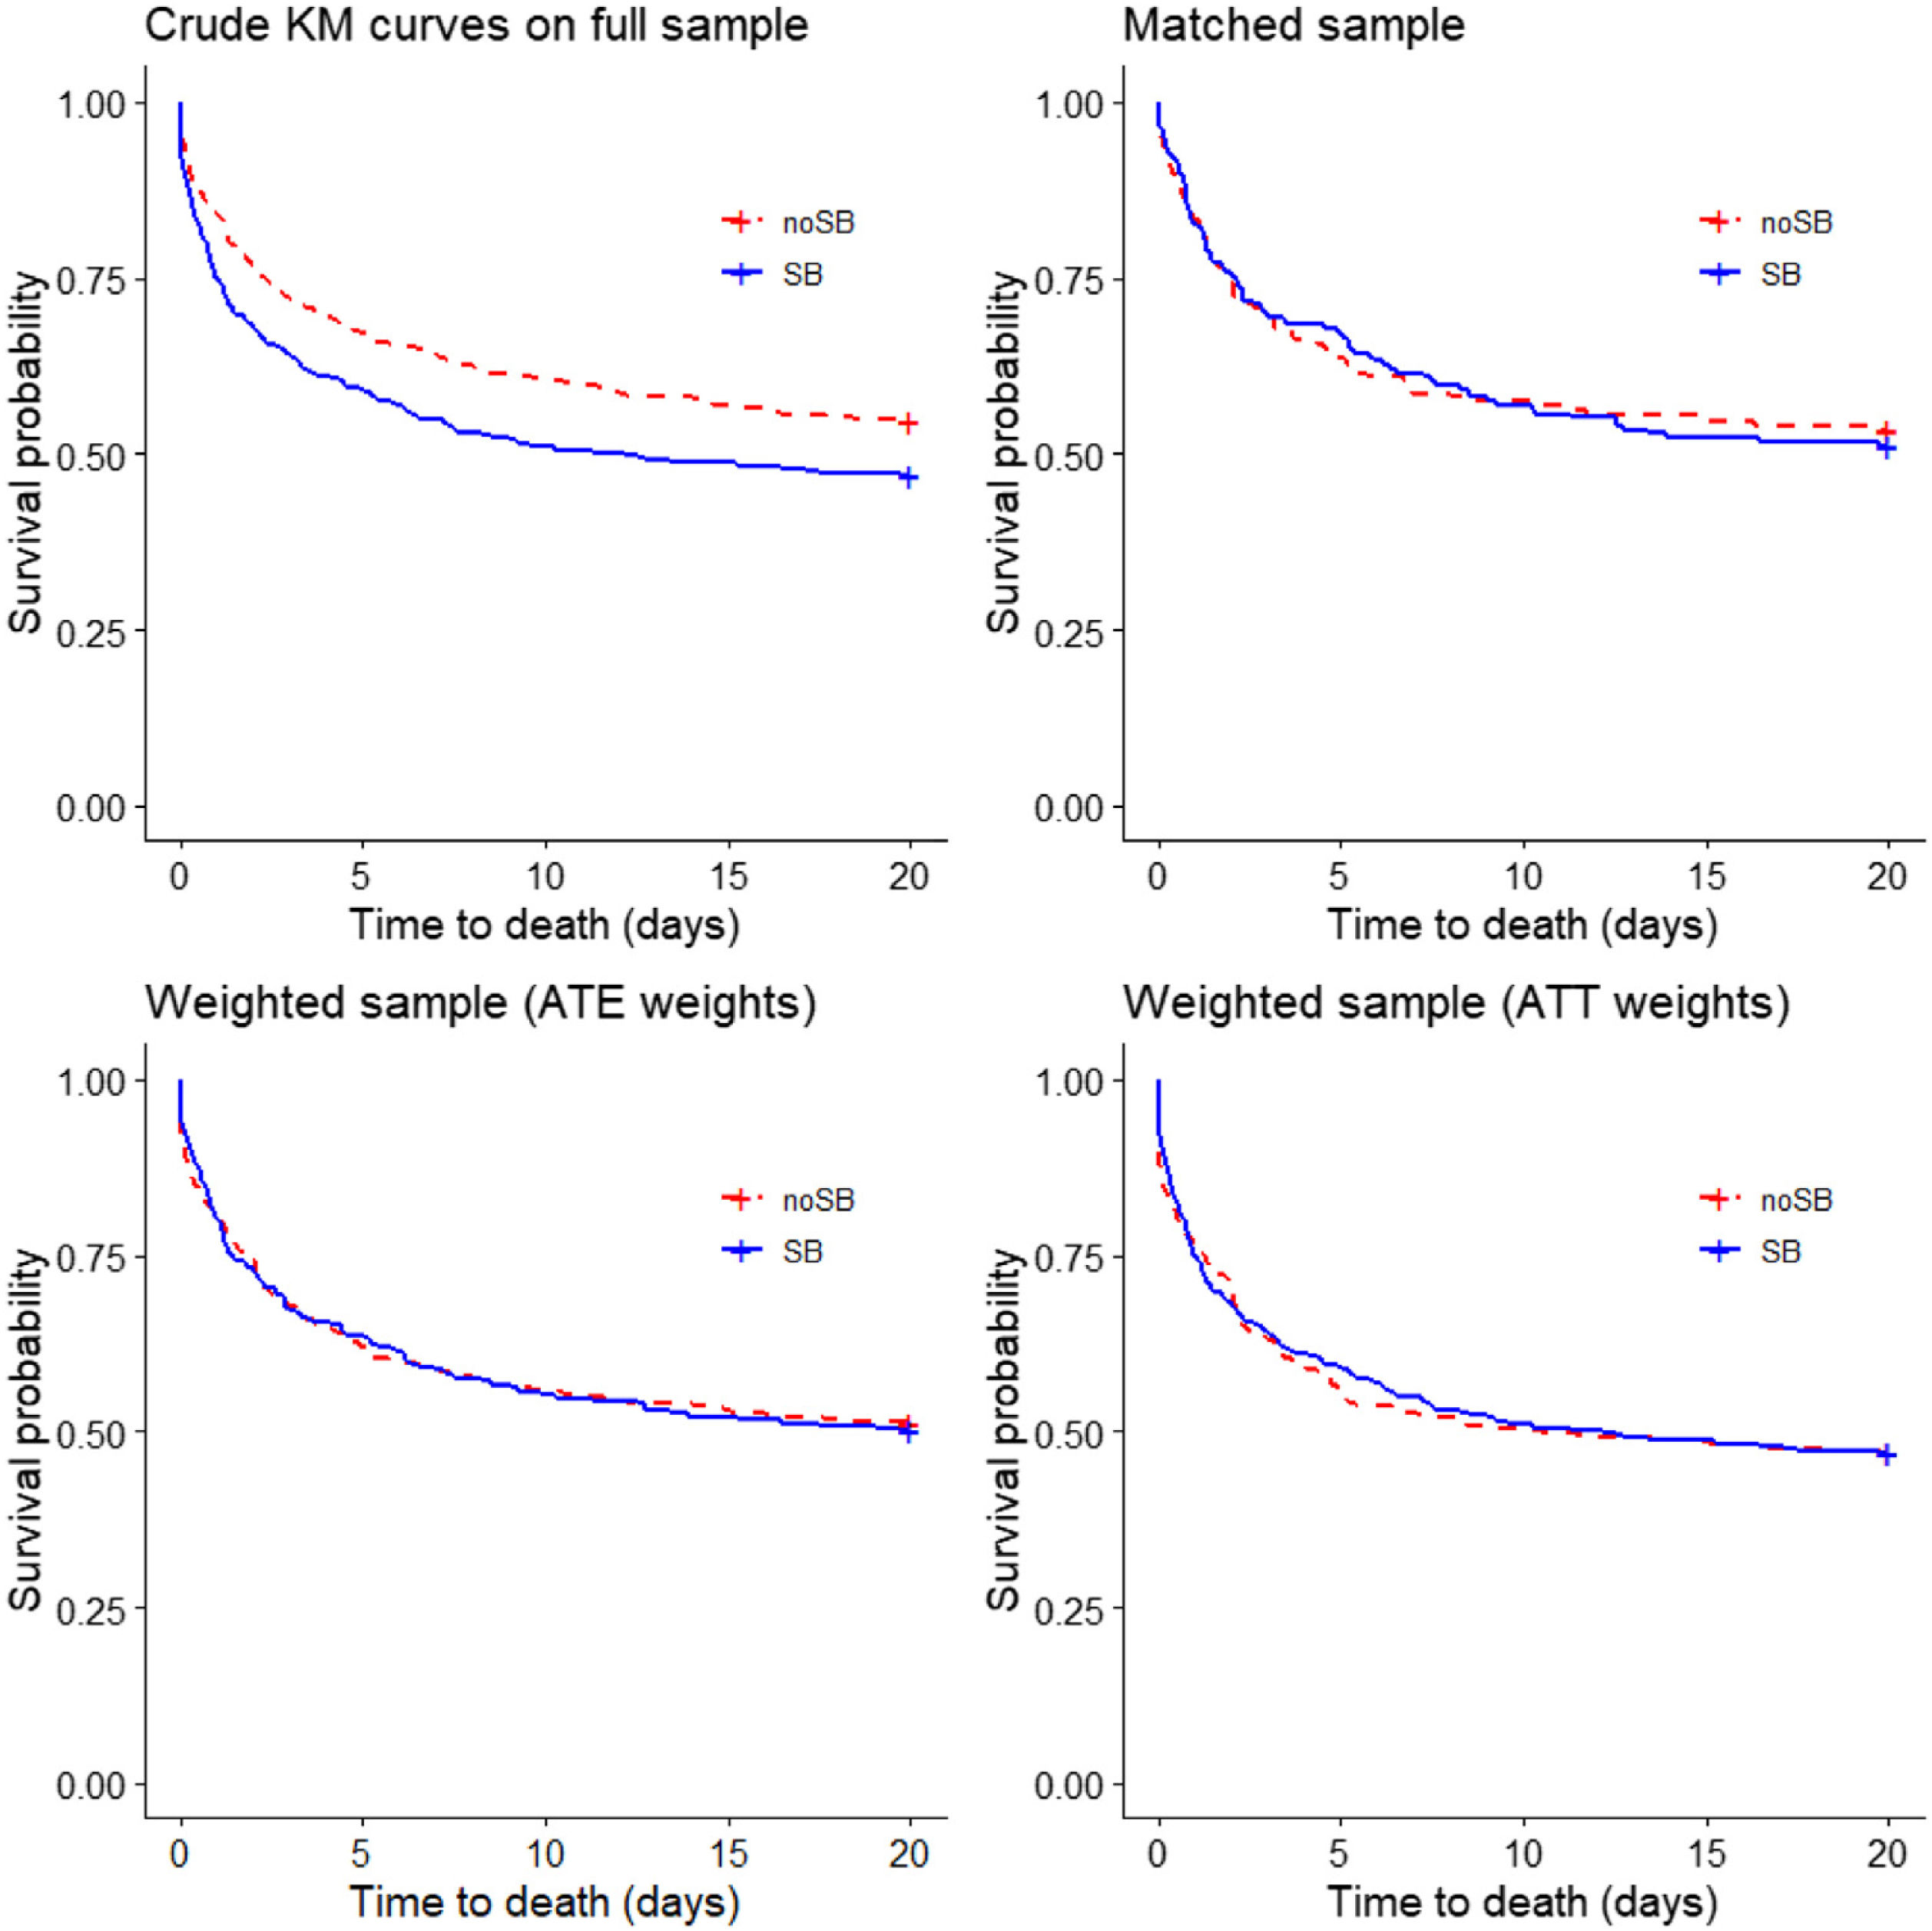
Kaplan–Meier survival curves (20 days) obtained using different propensity score methods. In the top-left panel crude Kaplan–Meier survival curves for treated and untreated subjects in the “crude‿ sample (n=971; log-rank test: p=0.005). In the top-right panel Kaplan–Meier survival curves for treated and untreated subjects in the propensity score matched sample (n=348 stratified log-rank test p=0.53). In the bottom-left and bottom-right panels survival curves in the sample weighted using the ATE weights (n=971) and the sample weighted using the ATT weights (n=971) are reported (adjusted log-rank test with p-values 0.91 and 0.98). ATE, Average Treatment Effect; ATT, Average Treatment effect in Treated.
Cox regression modeling did not reveal a significant difference in survival at 20 days (Hazard ratio [HR] (multivariable, matched sample, n=348: 1.16; 95%CI 0.86–1.56; p=.33) (Table 4).
Hazard ratios estimated with Cox regressions.
| Predictor for 20 day-survival | HR (univariable, “crude‿ sample n=971) | HR (multivariable, “crude‿ sample n=971) | HR (multivariable, matched sample n=348) | HR (multivariable, full sample with ATE weights, n=971) | HR (multivariable, full sample with ATT weights, n=971) |
|---|---|---|---|---|---|
| Sodium bicarbonate treatment | 1.30 (1.08–1.55, p=.005) | 1.08 (0.87–1.34, p=.50) | 1.16 (0.86–1.56, p=.33) | 1.07 (0.93–1.22, p=.35) | 1.05 (0.87–1.27, p=.58) |
| Propensity score | 1.17 (1.10–1.23, p<.001) | 1.15 (1.07–1.23, p<.001) | – | 1.14 (1.09–1.19, p<.001) | 1.18 (1.09–1.28, p<.001) |
| APACHE II | 1.03 (1.02–1.05, p<.001) | 1.03 (1.02–1.05, p<.001) | 1.03 (1.00–1.05, p=.05) | 1.02 (1.01–1.03, p<.001) | 1.02 (1.01–1.04, p=.002) |
Hazard ratios (HR with 95% confidence intervals) of predictor variables are given. ATE, Average Treatment Effect; ATT, Average Treatment effect in Treated.
A p value < 0.05 was considered statistically significant.
In this monocentric propensity score matched analysis, we observed no influence of sodium bicarbonate infusion on ICU-mortality in critically ill patients with metabolic acidosis.
In critically ill patients, it appears that sodium bicarbonate infusion is mostly prescribed as symptomatic measure aiming to influence effects of severe metabolic acidosis (e.g. on the cardiovascular system) until a more causal therapy (e.g. improvement of tissue oxygenation, source control strategies, and/or antibiotics) becomes effective. Currently, there is uncertainty whether SB infusion would impact on patient survival beneficially or whether it would e.g. induce sodium and/or fluid overload, increase paCO2 production, and would potentially be detrimental.10 Previous studies supported this assumption and showed that SB administration in metabolic acidosis may actually increase mortality.16 In contrast, the BICAR-ICU-trial12 and a retrospective study of Zhang et al.13 showed no impact on mortality when sodium bicarbonate was administered to critically ill patients with metabolic acidosis. In line with the aforementioned studies, we did not observe an increased mortality after sodium bicarbonate treatment. In contrast to the BICAR-study12 and the study of Zhang,13 however, we likely studied a rather broad population of ICU patients with metabolic acidosis as we included not only patients with acidosis and hyperlactatemia12 and/or septic patients.13
In addition, and in accordance with previous data,12,13 our study did not observe mortality benefits in patients with sodium bicarbonate infusion. However, although speculative, e.g. negative SB-induced effects could theoretically be counterweighted by beneficial effects such as improved cardiac contractility and/or vascular responsiveness to catecholamine therapy,3 without effects on the mortality endpoints. Further, effects (whether beneficial or not) could theoretically be short- rather than long-lived.
Importantly, about 50% or more patients who received sodium bicarbonate did not have a “severe‿ metabolic acidosis with pH≤7.21 (Tables 1 and 3). However, when compared to other investigations, our results (median pH of 7.17 in “crude‿ and 7.23 in matched groups) may be considered rather comparable to other retrospectives studies (e.g. Kim et al.: mean pH 7.244±0.168)16; Zhang et al.: minimum mean pH 7.16±0.1)13). Moreover, the median arterial pCO2 in the matched groups was 28mmHg. Therefore, the observed pH at admission may be respiratory compensated and true pH in fact considerably lower.
Further, one might assume that SB patients would have had a higher risk of death. However, in our subset of ICU patients, SB treated patients had a slightly, but statistically significant, lower baseline APACHE II score, whereas ICU mortality tended to be increased. This stands in contrast to previous data13,14 but may theoretically underline that metabolic acidosis is additionally associated with a higher mortality.
A number of important additional limitations of our analysis deserve discussion. First, limitations arise from the retrospective, single-center, and explorative design of this study and all respective inherent limitations apply that are driven by study design. In this retrospective study, even if mortality analyses were adjusted for typical potential confounders, our data may theoretically be subject to some degree of unmeasured confounding. Additionally, by definition, the matched sample analysis required extensive exclusion of patients of the overall sample, which may per se introduce (e.g. selection) bias. Moreover, this may point to heterogeneity of the total cohort and may be one reason why respective patients were particularly challenging to match. By deliberately curtailing our ICU data set to a subset of patients and by removing some outliers that aimed for a comparable subset of ICU patients, it may theoretically be possible that some degree of selection bias was introduced. Second, we only considered intravenous sodium bicarbonate formulations of 8.4% for analysis and might have missed other preparations, including e.g. chronic oral bicarbonate use in few patients with chronic kidney disease. Third, mortality may not be an optimal endpoint to examine effects of an early single intervention in a critically ill population, which may also underline our interest in early outcomes of our cohort (i.e. 20 days of ICU stay). It appears that endpoints related to therapy-induced effects (e.g. increase in pH) might be particular interesting in subsequent investigations. Fourth, our retrospective study design made it impossible to identify the medical reason for the (independent treating) physician to prescribe sodium bicarbonate and for the timing of the prescription. We can thus not exclude with certainty that SB was also given for aetiologies of metabolic acidosis with a better prognosis (e.g. diabetic ketoacidosis, intoxications) or other reasons than for metabolic acidosis only, e.g. in cases of additional rhabdomyolysis. Although the current analysis may be one of the largest investigations available, it appeared that the sample size was too limited to conclude back on effects of SB dose and/or exact timing as well as to conclude on subgroups of critically ill patients (e.g. acute kidney injury [AKI] or sepsis patients, patient's post-surgical interventions). Thus, the presented analysis may theoretically be “underpowered‿. Fifth, we did not evaluate other important covariates such as interventions during the ICU stay (e.g. emergency hemodialysis) as well as respective urgency nor the impact of fluid intake other than sodium bicarbonate including fluid balance. Sixth, the presented mortality data reflects all-cause mortality and we are unable to conclude back on specific acidosis and/or treatment-related adverse effects nor on different causes of death. Seventh, as our retrospective analysis made it impossible to conclude back on acid base analysis after sodium bicarbonate infusion we cannot describe any influence of sodium bicarbonate on the pH and the bicarbonate level after treatment. Moreover, we refrained from estimating dose-effects of the sodium bicarbonate given.
ConclusionIn this propensity score matched analysis, intravenous administration of sodium bicarbonate did not appear to effect on mortality in ICU patients with metabolic acidosis. Additional prospective controlled clinical investigations seem required to further determine potential effects of sodium bicarbonate infusion in subgroups of patients with metabolic acidosis, including potential high-risk groups, such as critically ill patients with AKI.
Authors’ contributionsJW: Designed the study, performed data collection and assessment, wrote the first draft, coordinated the input of all authors, supervised the study and revised the manuscript for important intellectual content.
BH: Designed the study, performed data collection and assessment, wrote the first draft, coordinated the input of all authors, and revised the manuscript for important intellectual content.
LC: Contributed to data interpretation, revised the manuscript for important intellectual content.
II: Performed all statistical analyses, revised the manuscript for important intellectual content.
CAP: Co-designed the study, contributed to data interpretation, supervised the study, and revised the manuscript for important intellectual content.
JCS: Co-designed the study, contributed to data interpretation, supervised the study and revised the manuscript for important intellectual content.
All authors approved the final version of the manuscript.
Conflict of interestsFull departmental disclosure: CAP, LC, and JCS report grants from Orion Pharma, Abbott Nutrition International, B. Braun Medical AG, CSEM AG, Edwards Lifesciences Services GmbH, Kenta Biotech Ltd, Maquet Critical Care AB, Omnicare Clinical Research AG, Nestle, Pierre Fabre Pharma AG, Pfizer, Bard Medica S.A., Abbott AG, Anandic Medical Systems, Pan Gas AG Healthcare, Bracco, Hamilton Medical AG, Fresenius Kabi, Getinge Group Maquet AG, Dräger AG, Teleflex Medical GmbH, Glaxo Smith Kline, Merck Sharp and Dohme AG, Eli Lilly and Company, Baxter, Astellas, Astra Zeneca, CSL Behring, Novartis, Covidien, Hemotune, Phagenesis, Philips Medical, Prolong Pharmaceuticals and Nycomed outside the submitted work. The money went into departmental funds. No personal financial gain applied.
II is affiliated with CTU Bern, University of Bern, which has a staff policy of not accepting honoraria or consultancy fees. However, CTU Bern is involved in design, conduct, or analysis of clinical studies funded by not-for-profit and for-profit organizations. In particular, pharmaceutical and medical device companies provide direct funding to some of these studies. For an up-to-date list of CTU Bern's conflicts of interest see http://www.ctu.unibe.ch/research/declaration_of_interest/index_eng.html
The additional authors declare that they have no competing interests.
The following are the supplementary data to this article: