


This aim of this review is to provide a detailed review of the physiologic conditions and variables of the cardiac output, as well as review the different techniques available for its measurement. We also want to establish the clinical situations in which the measurement of cardiac output can add valuable information for the management of critically ill patients. The Fick technique, used in the beginning to calculate cardiac output, has been replaced today by thermodilution techniques (transcardiac or transpulmonary), lithium dilution, bioreactance, Doppler technique or echocardiography. Pulse wave analysis allows a continuous minimally invasive cardiac output measurement. Other methods, such as bioreactance, Doppler technique or echocardiography currently provide a valid, fast and non-invasive measurement of cardiac output.
Esta revisión pretende profundizar en el conocimiento del gasto cardíaco, sus variables y sus condicionantes, así como repasar exhaustivamente las diferentes técnicas disponibles para su monitorización y establecer las situaciones en que el conocimiento del gasto cardíaco nos aporta una información fundamental en el manejo del paciente crítico. La técnica de Fick, utilizada en los inicios para calcular el gasto cardíaco de los pacientes, ha sido sustituida hoy en día en la práctica clínica por los métodos de termodilución (transcardíaca o transpulmonar), litiodilución, biorreactancia, la tecnología basada en el efecto Doppler o la ecocardiografía. El análisis de la onda de pulso ha permitido la obtención de una medida continua y mínimamente invasiva del gasto cardíaco. Otros métodos, como la biorrectancia, el Doppler o la ecocardiografía nos permiten, en la actualidad, obtener medidas del gasto cardíaco de forma no invasiva, rápida y fiable.
Cardiac output (CO) is defined as the volume of blood expelled by the heart in one minute. It can be expressed as follows:

In academic terms, the normal CO range in the healthy adult is about 4–6.5l/min (2.5l/min per m2 body surface would be the corresponding cardiac index), under resting conditions. However, cardiac output, as the main determinant of oxygen transport to the different body regions, must be adapted to the needs of the body at all times; therefore, as a single or isolated piece of information, a value within the “normal” range is unable to indicate whether cardiac function is optimum. Critically ill patients generally have abnormal oxygen demands as a result of the underlying disease-triggering process. Consequently, the cardiac output value alone is not enough to assess heart function and the hemodynamic condition of the patient. If CO is associated to other values offering information on the determinants of cardiac output and on the balance between oxygen supply and consumption, we may obtain a more accurate idea of whether global cardiac function is adequate or not.
As seen from the above formula, the determinants of cardiac output are systolic volume (SV) and heart rate (HR). In turn, systolic volume depends on the following.
PreloadPreload is determined by myocardial fiber length before contraction. According to the Frank–Starling law, there is a direct relationship between the degree of fiber elongation in diastole and posterior shortening of the myocardial fiber in systole. This is because stretching of the fiber involves slight elongation of the sarcomere, thereby increasing the number of sites of interaction between actin and myosin. In the clinical setting we can define preload as the ventricular dimension in telediastole (end-diastole). Left ventricle pressure could be used as a measure of preload, provided the relationship between pressure and ventricular volume is constant.
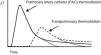
According to the Frank–Starling law, at a constant heart rate, cardiac output is directly proportional to preload, at least up to a certain point, beyond which CO would not increase despite further elevations in ventricle filling pressure, and could in fact decrease under certain conditions. Two phases can be defined in the Frank–Starling curve (Fig. 1): a first phase in which increasing preload is linearly correlated to increasing systolic volume (the preload-dependent phase or zone), and a second phase in which increasing preload is practically no longer correlated to increased cardiac output (the preload-independent phase or zone). In effect, upon stretching, the myocardial fibers show increased affinity for Ca2+ and therefore increased contractility, though a point is eventually reached where the heart is unable to distend any further, due to anatomical and structural limitations. Myocardial over-distension, as seen for example in dilated cardiomyopathy, gives rise to structural alterations of the myocytes; this in turn results in a loss of contractility, and therefore a drop in cardiac output.
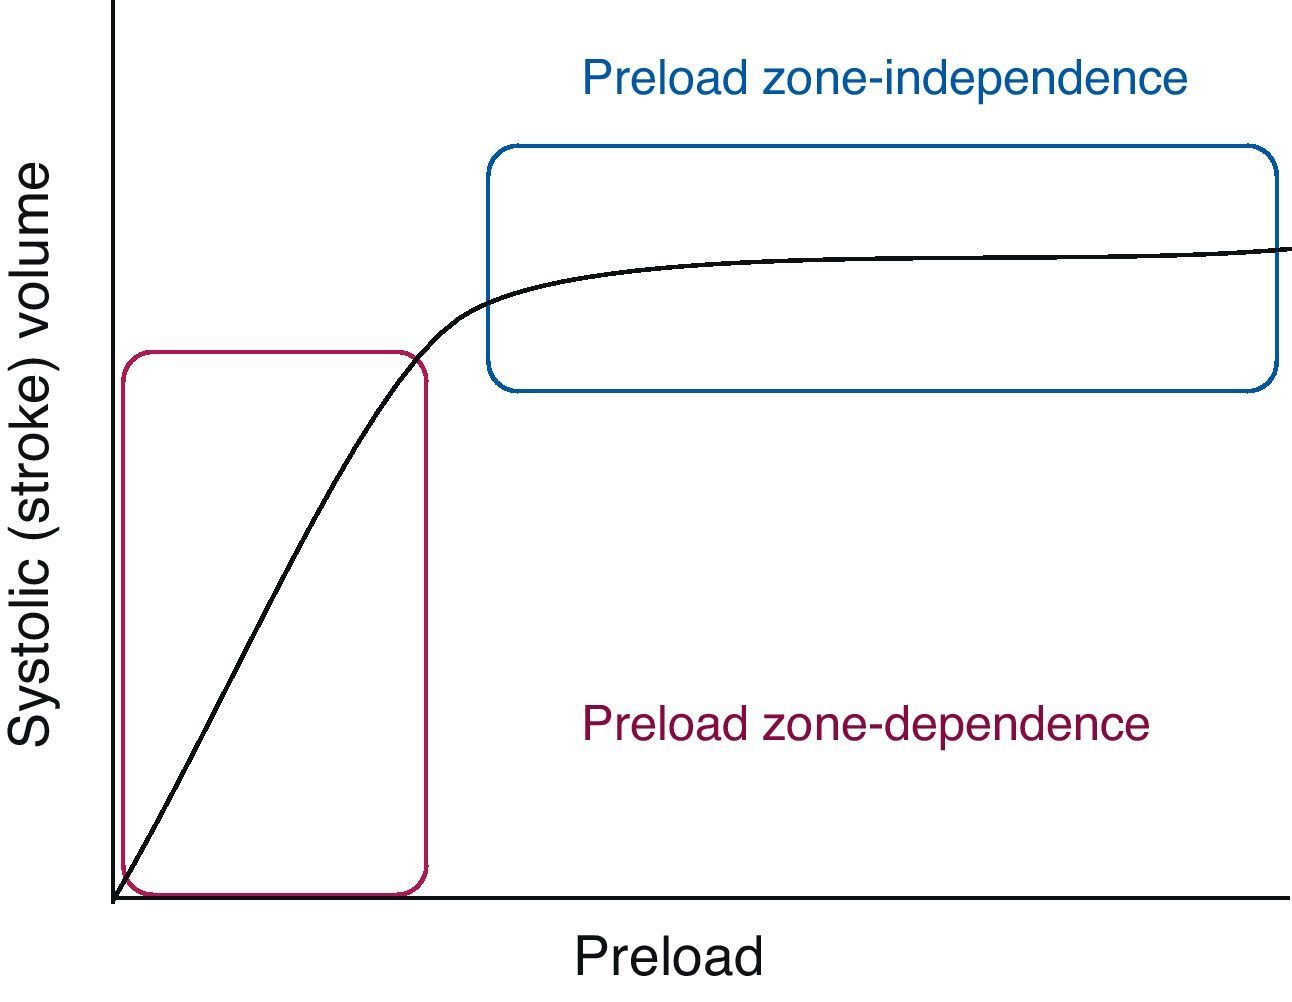
On the other hand, the Frank–Starling curve undergoes a shift to the right when ventricular distensibility is affected by processes that alter ventricular relaxation, such as for example hypertrophy or fibrosis, or by extrinsic factors such as pericardial disease.
Preload is therefore directly related to ventricle filling—the main determinant of which is venous return to the heart.
The relationship between venous return and cardiac function determines the values of venous pressure and cardiac output at each given point in time. An increase in venous return will give rise to an increase in cardiac output in a healthy heart, and the venous pressure values will remain within normal limits. In contrast, under conditions of heart failure, the heart is unable to assimilate all the blood that reaches it; increased right atrial pressure (central venous pressure, CVP) therefore results, with a drop in venous return due to the rise in pressure gradient between the venous system and the right atrium, as well as a reduction in cardiac output.
AfterloadAfterload refers to resistance to emptying of the heart. In a healthy individual, the afterload is equivalent to the tension of the ventricular wall in systole. This tension in turn is the pressure which the ventricle must overcome in order to contract. Cardiac output is inversely related to afterload. Assuming that the ventricle is spherical in shape, the law of Laplace expresses wall tension as follows:

The main determinants of ventricular pressure during systole are the ventricular contraction force, the distensibility of the walls of the aorta, and systemic vascular resistance. Since vascular distensibility is usually constant, in clinical practice we usually take afterload to be equivalent to systemic vascular resistance (SVR), which can be calculated by the following formula:

As can be seen, the main determinant or conditioning parameter of systemic vascular resistance in the absence of alterations in cardiac function is mean blood pressure (MBP); therefore, in clinical practice, its value offers us a valid approximation to cardiac afterload.
Derived from the above formula, we can see that mean blood pressure is fundamentally and directly dependent upon cardiac output and peripheral vascular resistance, according to:
Cardiac contractility
Cardiac contractility is the intrinsic capacity of the myocardium to pump blood under constant preload and afterload conditions. It is related to cardiac muscle shortening velocity, which in turn is dependent upon the intracellular Ca2+ contents of the myocytes, and certain muscle proteins such as protein kinase. Myocardial contractility can be modulated by nervous and humoral factors. The approximation to myocardial contractility in clinical practice is difficult, and is addressed in another chapter.
Methods for determining cardiac outputIn 1887, Fick described the first formula for calculating cardiac output, based on arterial oxygen content (CaO2), mixed venous blood oxygen content (CvO2), and oxygen consumption (VO2):
While the method is precise, its invasiveness has caused it to be replaced in clinical practice by other more modern and simplified techniques.
For several decades, the main method for the determination of CO has been intermittent thermodilution involving the insertion of a catheter in the pulmonary artery (PAC). In recent years, new methods have been developed for evaluating stroke volume (SV) and CO in critical patients, and new technologies have been introduced that have replaced PAC use in some clinical settings. The main advantage of these new methods is that they are less invasive than PAC, which nevertheless and despite all these advances is still regarded as the standard for measuring cardiac output.
Ideally, the best technology for estimating CO should be non-invasive, continuous, reliable, reproducible, and comfortable for both the patient and the medical professional, exact, and with minimum side effects. To date, none of the available techniques meet all these criteria, and the use of one method or other fundamentally depends on its availability and on the knowledge or skill of the professional.
The tools most frequently used to calculate CO include transpulmonary thermodilution and lithium dilution, which are methods that calculate SV from analysis of the morphology of the blood pressure wave, and the least invasive procedures such as those based on the Doppler technique, or the methods based on thoracic bioreactance.
In accordance to their invasiveness, the methods available for estimating CO are classified as invasive, minimally invasive or non-invasive.
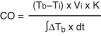
Invasive methodsTranscardiac thermodilution methodTranscardiac thermodilution is the technique used to measure CO by means of a pulmonary artery catheter (PAC). It has been the most widely used method in Intensive Care Medicine, at the patient bedside, and is still regarded as the reference technique. CO is calculated from the thermodilution curve using the Stewart–Hamilton equation:
A bolus dose of 5% glucose saline or saline solution is injected at a temperature lower than that of the blood through the line positioned in the right atrium. The fluid mixes with the blood, producing a blood temperature change that is detected by means of a thermistor located at the distal tip of the pulmonary flotation catheter in the pulmonary artery. The thermistor determines the temperature change and electronically calculates the cardiac output. In cases of severe tricuspid valve insufficiency, tracer return to the atrium attenuates the temperature change, and the CO value therefore can be underestimated. In contrast, in the presence of intracardiac shunts, the CO value can be overestimated.
Since its introduction, in the 1970s, the technique has undergone a series of changes that have made it possible to expand the information obtained (right ventricle [RV] ejection fraction, RV volumes, continuous CO monitorization). The main limitation in using the procedure is the risk of catheter-related infection (approximately 5%) and arrhythmias (about 2%). Other potential complications are thrombopenia and associated thrombosis—both of which are observed in cases of prolonged catheterization.
Minimally invasive methodsTranspulmonary thermodilution methodsTranspulmonary thermodilution (TPTD) is a variant of the thermodilution principle used by the pulmonary artery catheter (Fig. 2), and which found its way into clinical practice as an evolution of the double indicator method, in the late 1990s. TPTD requires a conventional central venous catheter externally connected to a sensor that measures the temperature of the injected solution, and a femoral or axillary arterial catheter which in addition to measuring blood pressure is equipped with a temperature sensor at its distal tip. The central venous injection of cold saline produces blood temperature changes that are measured by the arterial thermistor—yielding the CO based on a modified version of the equation developed by Stewart–Hamilton (Fig. 3).
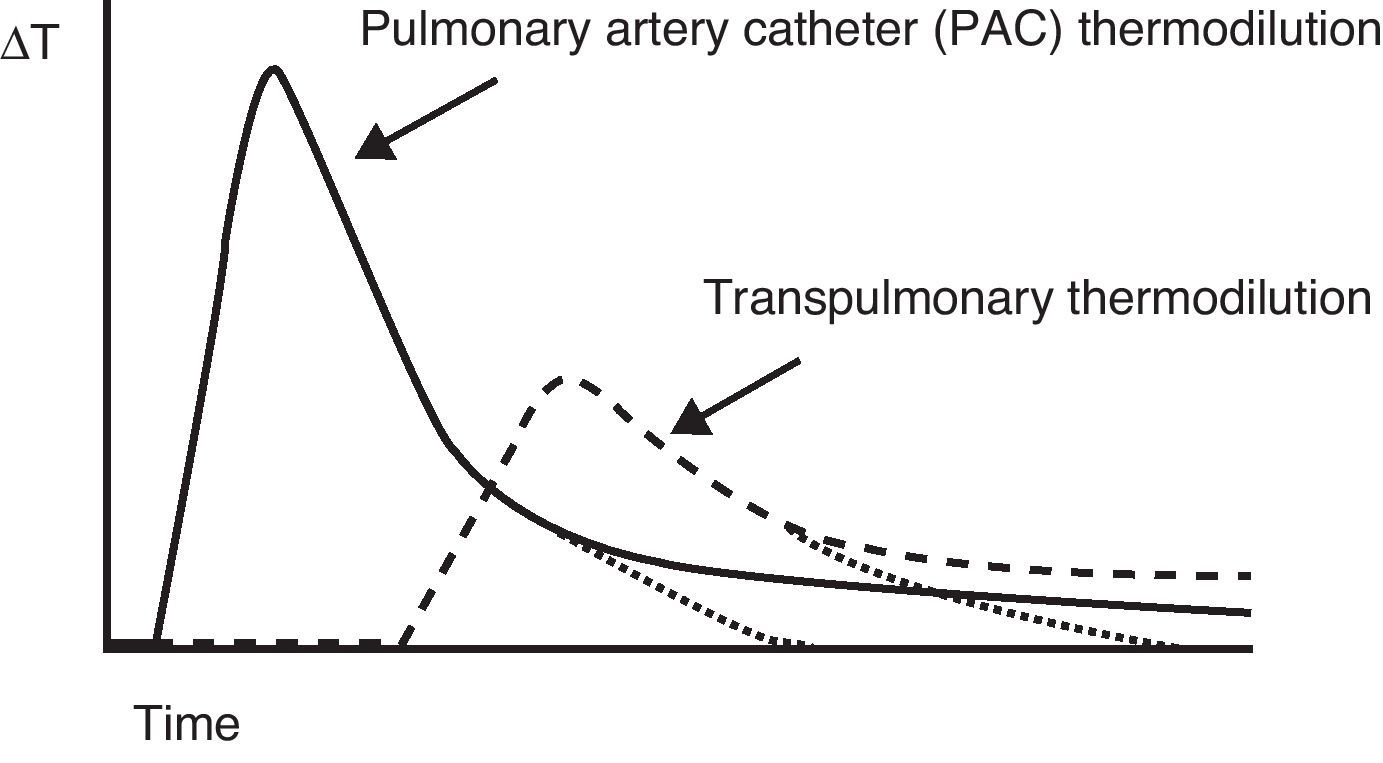
Comparison of the thermal variation curve over time registered by the thermistor of a pulmonary artery catheter (solid line) and the arterial thermistor of the PiCCO system (broken line). Note the difference in transit time due to the distance from the injection point to both temperature sensors.

The system allows us to select different amounts of saline and different temperatures. The volume of solution injected depends in each case on the patient body weight. When the patient presents an increased extravascular thermal volume (extravascular pulmonary water index >10ml/kg body weight) and/or a very high body weight, a greater volume of injected solution is needed, and the temperature must be as low as possible (under 8°C), compared with individuals presenting lower thermal volumes. In adults, the injection of 15ml of cold saline is sufficient in most clinical scenarios. In pediatric patients, the recommendation is to administer 1.5ml+0.15ml/kg of cold saline. The true temperature and the moment of injection are registered by the thermistor of the venous catheter, adjusting the thermodilution readings.
Since its introduction to clinical practice, TPTD with the PiCCO system (PiCCO System; PULSION Medical Systems AG, Munich, Germany) has shown good correlation with different monitoring systems used at the patient bedside. The results, when compared with PAC, are favorable even in situations of rapid hemodynamic changes.1 The correlation is also maintained when the cardiac output is low2 and small deviations in the calculations imply greater errors in the result. In pediatric patients, with injections of 1.5ml+0.15ml/kg of saline solution, the comparison with LiDCO® plus yields an r2 of 0.96. Likewise in pediatrics, when compared with CO obtained from the Fick direct method,3 the observed correlation remains good, with r2=0.99.
The limitations in measuring CO with TPTD are the following:
- •
Thermal variations: Body temperature does not experience variations fast enough to cause alterations in the thermodilution curve, though there nevertheless may be thermal artifacts that can cause distortions. Thus, there have been reports of interferences associated with the injection of cold saline through venous catheters close to the arterial catheter of the PiCCO system4—though this phenomenon only appears to be relevant in situations of low cardiac output.
- •
Blood extracorporeal filtration treatments (ECF) represent a possible recirculation route for the thermal indicator and also a source of artifacts, since they cool the blood upon exposure to the environmental temperature and with the replacement fluids. Although there is experience with low blood flows that do not register artifacts in the TPTD measurements made with and without ECF,5 Maynar et al. have recently reported significant variations in the measurement of CO during ECF.
- •
Intracardiac shunts: Although these shunts can be regarded as a source of artifacts due to the distortions they produce in TPTD curve morphology, it is currently considered acceptable to use the PiCCO system for the monitorization of intracardiac shunts.6 The TPTD curve shows a characteristic “double hump” morphology in such situations. The PiCCO2 monitor adds monitorization of the percentage shunt effect.
Cardiac output determined with the transpulmonary lithium dilution (TPLD) technique was described by Linton in 1993.7 A minimum injection of lithium chloride in any vein generates a plasma concentration of this indicator that is measured by a selective sensor placed in any arterial line. Following analysis, the dilution curve yields hemodynamic values and is used for the calibration of a continuous (beat-by-beat) CO monitoring system, based on the evaluation of pulse strength.
The choice of lithium as an indicator is due to the fact that this element is not found in the bloodstream (except in patients receiving treatment with lithium salts). Thus, minimum amounts of lithium (0.002–0.004mmol/kg) generate a sufficient signal, due to the absence of background noise. These small amounts of lithium injected into the bloodstream imply no therapeutic activity or risks of toxicity. It rapid clearance from the central compartment, and the absence of alterations in concentration on passing through the pulmonary vessels, complete the excellent profile of lithium as an indicator.
The sensor that picks up the signal is located externally, in line with the arterial catheter, and as close as possible to the luer lock connection of the catheter, by means of a three-way stopcock. The blood is impulsed by a pump at a fixed rate of 4ml/min. The blood containing lithium and sodium generates a voltage that is registered by the sensor. The Nernst equation in turn relates the voltage to the concentration, thus allowing correct plotting of the concentration–time curve. In the absence of lithium, sodium becomes the main determinant of the voltage registered by the sensor. Once the plasma sodium concentration has been entered in the system, the concentration–time curve will depend only on the lithium dilution curve.
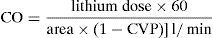
The sensor reads the change in blood voltage for a period of time and generates a curve which (knowing the lithium bolus dose and blood flow) is then used to calculate cardiac output by means of the following equation:
The lithium dilution technique has been shown to be at least as precise as other CO measurement techniques used at the patient bedside (thermodilutions) and in experimentation. Compared with pulmonary artery catheter thermodilution, favorable results have been obtained in both animals8–11 and humans,12 with an excellent correlation in critical patients (r2=0.86 [0.77–0.92]; p<0.000001).8 In addition, validation studies have reported satisfactory results in application to very different body surfaces. It is notorious that lithium injection can be made into any vein (central or peripheral), as demonstrated by the study of García-Rodríguez et al.12
However, despite such robust evidence of the reliability of the technique, it does have some limitations:
- •
Patients receiving treatment with lithium salts. A correct reading requires large voltage changes between the baseline signal and the curve. The background noise generated by the therapeutic plasma lithium levels can cause us to overestimate CO by reducing the gradient.
- •
Muscle relaxants. Non-depolarizing muscle relaxants are salts that can give rise to inexact measurements. In any case, the manufacturer recommends administration in the form of a bolus dose whenever clinically justified. There is unpublished experience with cisatracurium in infusion speaking favorably of its use in the calibrations.
- •
Intracardiac shunts. As with all dilution techniques involving an indicator, intracardiac shunts generate error in the determination of CO by altering the dilution curve. This may be regarded both as a limitation and as a diagnostic tool.
Blood pressure curve analysis is based on the concept that the blood pressure wave profile is proportional to systolic volume. Logarithmic analysis of the beat-by-beat pulse wave converts the blood pressure signal into volume. Since the pulse pressure is proportional to the ejection volume and aortic elasticity, the system correlates the variations in blood pressure to changes in blood volume (ejection volume), provided aortic resistance remains constant. The analysis is strongly influenced by aortic impedance.
The origin of this method dates back to the classical Windkessel model described by Otto Frank in 1899. The basic Windkessel model represents the arterial tree through two elements: arterial distensibility and peripheral vascular resistance. This construct in turn was followed by the modified model comprising three elements, on adding aortic impedance to the two previously mentioned elements. More advanced models take into account the pulse wave velocity and reflection phenomena within the vascular tree.
Stroke volume (SV) can be estimated from the systolic portion of the pulse wave or the difference between the systolic and diastolic portions (pulse pressure or power).
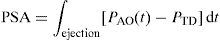
Analysis of systolic pulse profileWesseling et al. developed a technique for analyzing the pulse profile, based on a linear transmission model of the arterial tree. In this model, SV is related to the pulsatile-systolic area (PSA) and aortic impedance (ZA) by the following equation:
where PAO(t) is the aortic pressure at time t and PTD is the telediastolic (end-diastolic) pressure.
Although the pulsatile-systolic area (PSA) can be evaluated from the area under the curve, there are no simple direct methods for establishing the appropriate value of aortic impedance (ZA). As a result, different methods have been studied to establish an individual calibration factor allowing us to obtain an approximation of the value. Thus, in an advanced Wesseling model, mean blood pressure, heart rate and patient age are used as correction factors through linear regression models, in order to obtain the cross-sectional area of the aorta, necessary for calculating impedance. Lastly, a calibration factor is required, obtained by comparing the CO derived from the pulse profile analysis versus the CO obtained through thermodilution in the same patient.13,14
Pulse power analysisPulse power analysis is based on the hypothesis that the force change within the arterial tree during systole is the difference between the amount of blood entering the system (stroke volume, SV) and the amount of blood flowing towards the periphery. The algorithm used is based on the assumption that the net power change in a heart beat is the SV minus blood loss towards the periphery during the beat, and that there is a relationship between net power and net flow. In this method, the pressure wave is transformed into a volume wave, and a mathematical volume wave shape auto-correction technique yields the net power and the beat period. The net power is proportional to the net flow (SV).
On taking the entire beat into account for the analysis, this method becomes independent of the position of the catheter (central or peripheral).
A variant of this method is based on the standard deviation of arterial pulse pressure for obtaining the systolic volume, without the need for external calibration.
Systems available for estimating CO from pulse wave analysisThere are consequently different ways for transforming the information supplied by the blood pressure wave profile into SV and beat-by-beat CO. Each approach uses its own algorithms for the analysis of pulse contour or profile. Some of the methods have been examined above, including analysis of the systolic portion of the arterial curve, applying a Fourier transform after manual calibration, in transpulmonary thermodilution, as with the PiCCO® system. Another method calculates SV from pulse power after calibration with an indicator substance (LiDCO®). Other systems in turn require no manual calibration, as in the case of the technique developed by Edwards, the Flotrac/Vigileo® (Edwards Lifescience, Irvine, CA, USA), employing the usual HR and SV components for calculating CO, but replacing heart rate with pulse frequency.
The limitations for the measurement of CO by means of these methods are the following:
- –
Obese patients show alterations in arterial distensibility, which affects CO based on the morphology of the blood pressure wave.
- –
Validation is required in patients with diminished systemic vascular resistance (SVR).
- –
Buffering of the morphology of the blood pressure curve and insufficient zero should be avoided in order to obtain a signal valid for the calculation of CO.
- –
The blood pressure curve profile changes significantly on passing through the arterial tree, producing de-adjustments attributable to the changes in caliber and bifurcations.
- –
Validation has not been carried out in patients with ventricular assistance devices or intraaortic counterpulsation balloons.
- –
The absolute values may be affected during aortic regurgitation, even when the tendencies are correct.
- –
Severe peripheral vasoconstriction in the context of shock or episodes of hypothermia can influence the values if the arterial location is the radial artery; in these situations, femoral insertion or a catheter in the pulmonary artery is considered.
Regardless of the technology used, some aspects must be taken into account in order to ensure that the information obtained is as exact as possible:
- –
The data are derived from the morphology of the blood pressure curve. As a result, the curve should have a series of adequate characteristics: correct zeroing and harmonic features, with neither too much buffering nor too much resonance.
- –
Strict calibration is required. Each calibration has an inherent degree of inexactness; consequently, if calibration is not performed correctly, the inexactness will increase and can cause the derived signal to be less real. This means that special caution is required in patients with unstable arterial signals, cardiac arrhythmias or ventricular extrasystoles. Inadequate pulse wave analysis will yield inexact calculations.
The calculation of cardiac output from the changes in electrical bioimpedance was initially described by Nyboer in 1959. After placing four electrodes at chest level, together with a set of ECG cables, a high-frequency, low amplitude electrical current is applied, followed by registry of the changes in thoracic electrical impedance over time. The selected time interval in which impedance is measured occurs during systole, between closing and opening of the aortic valve. Thoracic electrical bioimpedance does not directly measure CO of the left ventricle. Rather, CO is extrapolated from the global conduction velocity of an electrical stimulus, through the integration of multiple signals generated by the pulsatile flow of the aorta and resistance to application of the electrical current. The continuous measures of change in impedance caused by fluctuations in blood volume during the cardiac cycle make it possible to measure, calculate and monitor SV, CO, myocardial contractility and total thoracic fluid status on a continuous basis.
Posteriorly, Keren et al.15 developed a system based on bioreactance for calculating cardiac output. This technique involves analysis of the phase shift in the high-frequency electrical wave delivered to the thorax (in contrast to traditional bioimpedance, based on the measurement of voltage changes), and is used by the NICOM® system (Cheetah Medical, USA).
The limitations in measuring CO with this technique are the following:
- 1.
External and internal pacemakers using unipolar electrodes: external pacemakers can add electrical artifacts to the bioreactance signal.
- 2.
Severe pulmonary hypertension: if pulmonary artery pressure (PAP)>60mmHg, the CO value may be overestimated.
- 3.
Severe aortic insufficiency: the NICOM system discards the regurgitation fraction; as a result, anterograde CO is overestimated.
- 4.
Severe tricuspid valve insufficiency.
- 5.
Severe anatomical alterations of the thoracic aorta: synthetic aortic prostheses, large aneurysms, long aortic dissections. The anomaly must be important in order to have a significant impact upon the accuracy of the device.
- 6.
Intracardiac shunts: the device has not been tested in patients with congenital heart diseases involving complex intracardiac shunts.
- 7.
Continuous flow left ventricle assistance devices (LVAD): the NICOM measures CO based on the pulsatile flow of the aorta, which is not present when there is continuous flow with these devices.
The measurement of cardiac output (CO) using devices based on Doppler technology has increased exponentially in recent years, mainly because of their lesser invasiveness compared with the pulmonary artery catheter, and the slow but inexorable incorporation of echocardiography in the Intensive Care Unit as a diagnostic tool and, specifically, as a hemodynamic monitorization technique.16
Physical principles- 1.
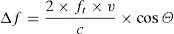
Doppler law. The application of ultrasound in the frequency interval of 2–10MHz, with the capacity to interact with human tissues (in our case reflection upon the moving erythrocytes in the bloodstream), constitutes the basis of all monitors that use the Doppler effect to measure CO. The Doppler law expresses the mathematical relationship between the apparent change in sound wave frequency when the emitter and/or receptor is in relative movement. The mathematical expression is as follows:
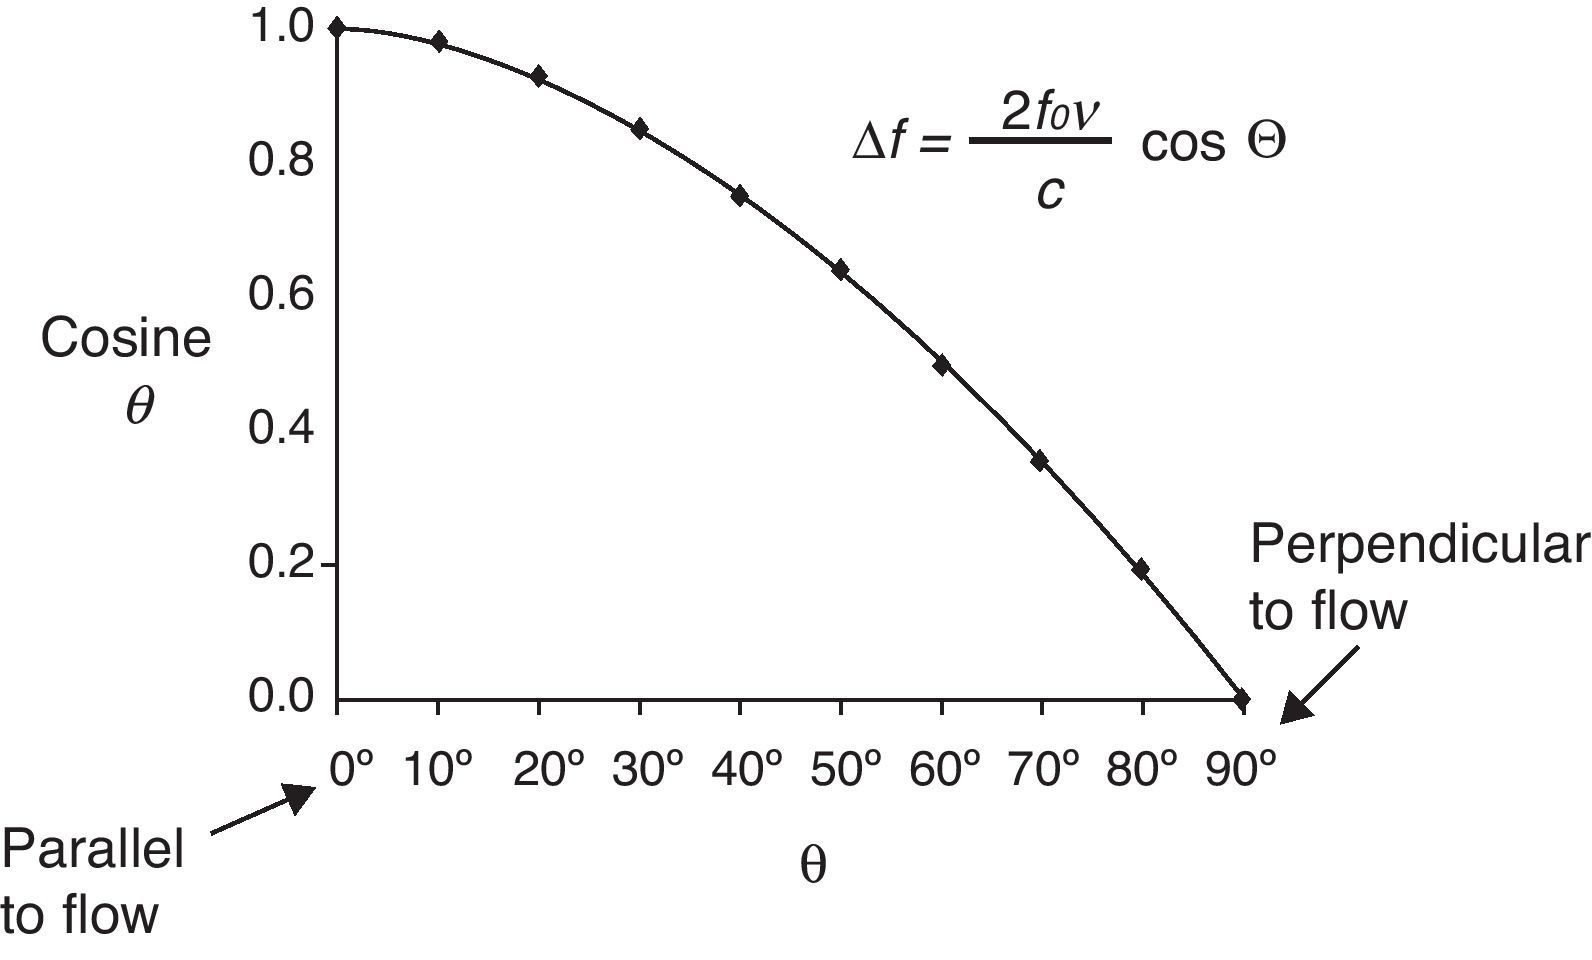
where Δf is the detected change in frequency, ft is the transmitted original frequency, v is the relative velocity between emitter and receptor, c is the velocity of sound in the medium (in human soft tissues the value is taken to be 1540m/s on average), and cosΘ is the angle of incidence between emitter-receptor. - 2.
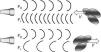
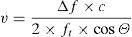
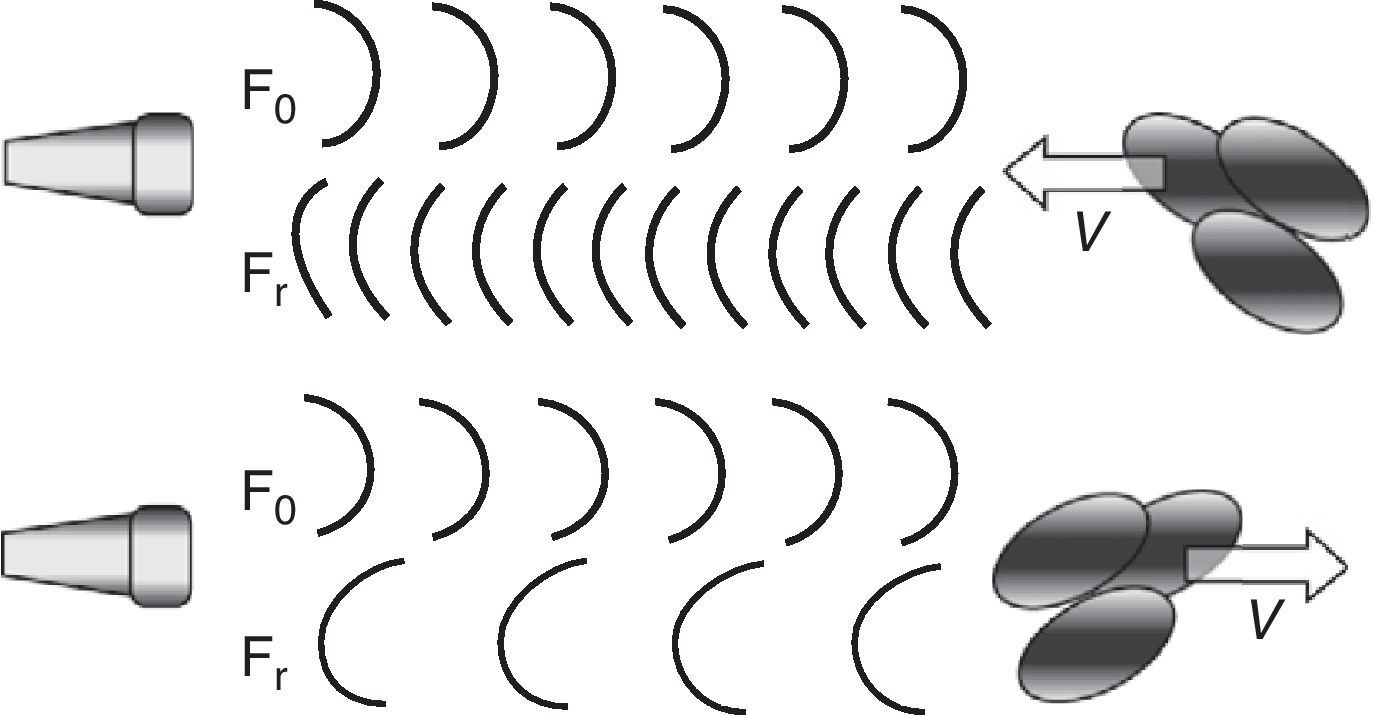
Application of the Doppler effect to the measurement of CO. In the practical context, the Doppler effect makes use of a transducer capable of generating and detecting ultrasound waves, emitting an ultrasound beam of known ft at cardiovascular level (outflow tract of the left or right ventricle, descending aorta). The waves partly reflect upon the moving erythrocytes and are again detected at a frequency different from that in which they were emitted (Fig. 4), thus making it possible to calculate Δf. On moreover considering that we know the value of c and that the value of cosΘ are fixed in some devices and can be calculated in others (given the mathematical characteristics of the cosine function, angles of up to 30–40° are considered clinically acceptable) (Fig. 5), the only variable that remains to be determined is v, which can be calculated as follows:
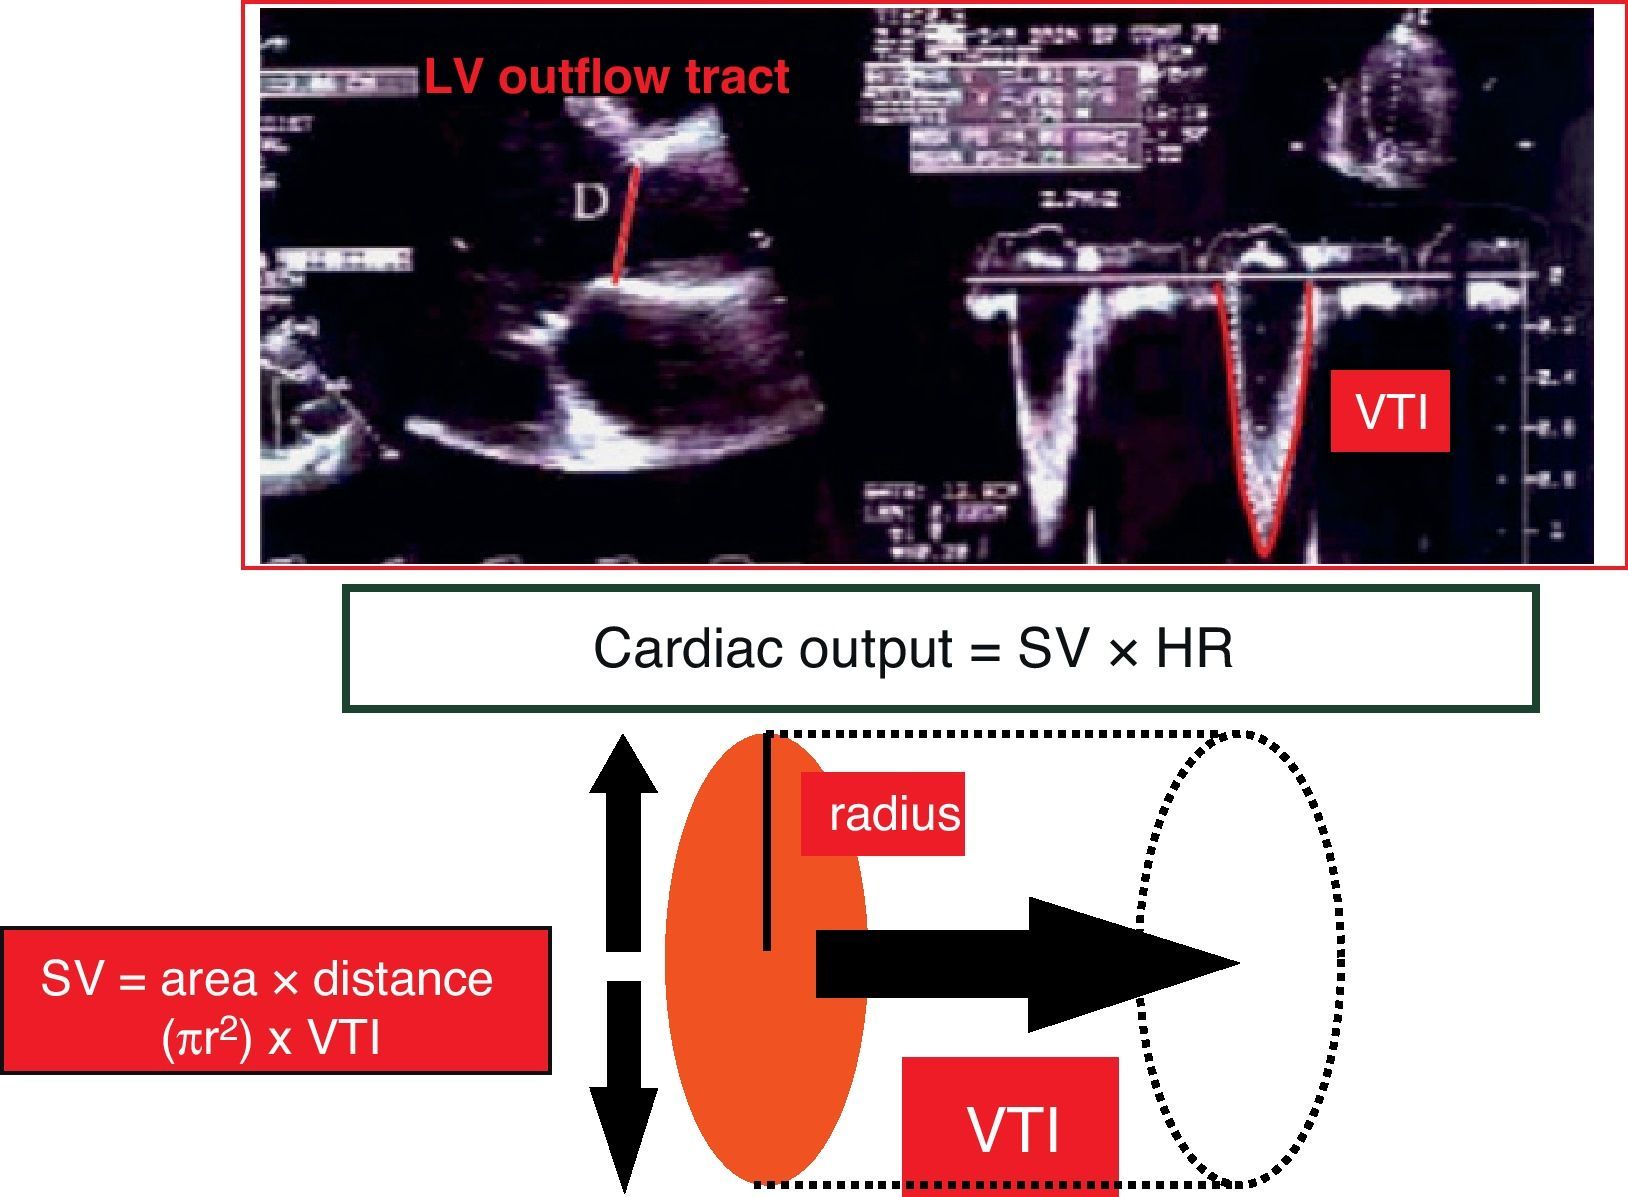
In this expression, v is the velocity of the moving erythrocytes and therefore the blood flow velocity. Integration (calculation of the area under the curve, AUC) over the length of the entire cardiac cycle (known as velocity–time integration, VTI), allows us to calculate the systolic stroke volume (SV).
There are two different methods for applying the Doppler effect to the study of blood flow velocity, and that afford different information.17 With both continuous and pulsed Doppler, mathematical analysis involving integration over time of the maximum velocity spectrum yields a distance (cm) known as the beat distance (BD), which can be interpreted as the length of a blood column passing a given point in the course of a cardiac cycle. Posteriorly, assuming that the point where we calculate the velocity spectrum has a series of concrete geometrical characteristics (usually taken to be circular in the cardiovascular system—aorta, ventricular outflow tracts), we can calculate the corresponding cross-sectional area (AS) either through direct measurement (assuming circular geometry, AS=π×r2) or estimated from population databases (Fig. 6). With all these variables we can then calculate SV and CO with the following formulas:
- –
Formula for calculating stroke volume: SV (cm3)=AS (cm2)×BD (cm).
- –
Formula for calculating cardiac output: CO=SV (cm3)×HR (min−1).
This is the theoretical basis of the different Doppler monitors employed for the measurement of the CO in the critical patient, and whose specific characteristics are described below.
Transthoracic DopplerTransthoracic Doppler involves the application of a blind Doppler probe (without ultrasound capacity) over different thoracic areas to measure flow at different levels of the cardiovascular system. The most widely used monitorization system based on the transthoracic Doppler technique, and with the greatest body of supporting studies, is the USCOM-1A monitor (Pty Ltd., Coffs Harbour, NSW, Australia).
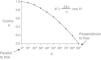
Despite all the purported advantages, the literature comparing its use with PAC in Intensive Care is limited, and most studies to date involve few patients (mostly post-cardiothoracic surgery cases). These studies have shown both techniques to involve relatively little bias, though with broad agreement intervals—particularly in situations of high CO (>4l/min/m–2), where the USCOM has not been found to be a good estimator of CO obtained by PAC.18–21
Transesophageal DopplerTransesophageal Doppler involves the use of a disposable probe similar in appearance to a common nasogastric tube. The probe has an ultrasound emitter-receptor device at its distal tip, and is inserted via the nasal/oral route. Once positioned at mid-esophageal level, the probe generates ultrasound waves in the descending aortic blood flow. Different companies have marketed different transesophageal Doppler devices with different technical characteristics as regards their operating mode (continuous or pulsed Doppler) and the way of calculating AS (direct measurement of the aortic diameter in M-mode, use of nomograms). Many of these devices are no longer produced or marketed, due to their scant penetration of the clinical practice setting. The two best known devices and with the greatest literature support are the Hemosonic100 (Arrow International, Reading, PA, USA) and the CardioQ (Deltex Medical Ltd., Chichester, UK).
In contrast to transthoracic Doppler, which is completely non-invasive, the transesophageal Doppler probe can be defined as semi- or minimally invasive, for although it has been shown to offer an excellent safety profile, with no reported serious complications, there are some contraindications to its use that must be duly observed22:
- –
Esophageal stricture (stenosis) or tumors, acute esophagitis, esophageal diverticuli, esophageal varicose veins with high bleeding risk.
- –
Cervical-upper thoracic spinal injuries with spinal cord risk.
- –
Recent esophageal or tracheal surgery.
- –
Severe bleeding alterations.
In the Intensive Care setting there is little literature supporting transesophageal Doppler ultrasound, and as refers to its capacity to replace PAC for the measurement of CO, it must be pointed out that most of the studies carried out to date involve post-cardiac surgery patients and have considerable methodological shortcomings (small patient samples, without the comparison of techniques based on Bland–Altman analysis). Nevertheless, transesophageal Doppler technology is gaining ground in Intensive Care Units, and represent an important aid for intensivists.23
EchocardiographyThere are different ways to estimate cardiac output using echocardiography, based on both volumetric methods and on Doppler technology in its different modalities (pulsed, continuous or color Doppler). Of the different techniques, the most widely used option in clinical practice and which offers the best agreement with the measurements made with PAC, is the determination of cardiac output by pulsed Doppler at the left ventricle outflow tract (LVOT).24,25 This technique determines two variables: (a) the diameter of the LVOT to calculate AS; (b) and the flow velocity spectrum (VTI) to calculate BD. These calculations can be made via both the transthoracic and the transesophageal routes.
Echocardiography, both transthoracic and transesophageal, requires a more or less prolonged training period, depending on the skills, which the operator needs to assimilate. In any case, the training period is much longer than that in the previously described techniques (blind transthoracic and transesophageal Doppler). On the other hand, echocardiography offers a much broader view of the patient hemodynamic condition, and makes it possible to assess situations that are difficult to interpret with other systems (right ventricle dysfunction, tamponade, valve dysfunction, LVOT obstruction). Its isolated use in calculating CO involves the same limitations as those described for blind transthoracic and transesophageal Doppler—with the added disadvantage that it cannot be used on a continuous basis. The literature regarding the measurement of CO using echocardiography is extensive but difficult to interpret, since most of the studies involve post-cardiac surgery patients, different measurement modalities are used, and the patient samples are generally small.25–28 In sum, it can be concluded that the results obtained in relation to the measurement of CO with PAC are similar to those described above—with relatively little bias, but with excessively broad agreement intervals. Nevertheless, some authors suggest that echocardiography could be more reliable than PAC in patients with severe tricuspid valve insufficiency (a not infrequent condition in patients admitted to Intensive Care).
When to monitor cardiac outputThere is little scientific evidence in support of the exhaustive monitorization of CO in certain critical patients. No type of monitorization has been shown to increase the survival of any type of patient. However, it seems very reasonable to assume that in certain patients the availability of information on heart function can help us to understand disease physiopathology and guide us in the taking of treatment decisions—which in turn can indeed have a crucial impact upon the prognosis.
Some studies have reported that the systematic monitoring of cardiac output in all critical patients affords no clear benefit.29
All shock patients require minimal monitorization comprising blood pressure (invasive or non-invasive), ECG, pulsioximetry, diuresis control, central venous pressure, central venous O2 saturation, etc. These measurements initially may guide the resuscitation measures, and may prove sufficient if the objectives are reached.30
In certain patients, these initial measurements do not afford sufficient information for continuing the treatment of the patient. In such cases it is advisable to expand monitorization and to obtain information on the cardiac output of the patient:
- –
Refractory shock: In patients who 3–6h after the start of treatment present signs of refractory shock, including persistent lactic acidosis, oliguria, the need for vasoactive drugs at increasing doses, etc., we require more detailed information on cardiac function, with a view to understand why the initial treatment has not been successful, and thus to more adequately guide the resuscitation measures. Such monitorization, which must include cardiac output, should be conducted on an early basis, once the patient condition proves resistant to the initial measures taken.
- –
Resuscitation in patients with heart failure: In patients with initial severe hypoxemia in which heart failure is suspected, it seems reasonable to monitor cardiac output from the start, since the initial resuscitation measures (volume loading) can worsen cardiac and respiratory function.
- –
High-risk postsurgical patients: In high surgical risk patients, it has been shown that adequate optimization of cardiac output and of oxygen extraction (DO2) during the operation31 and in the hours immediately after surgery32 has a direct beneficial impact upon the prognosis, with fewer complications and a shortening of hospital stay.33
- –
Cardiogenic shock: A situation in which the exhaustive monitorization of cardiac output is particularly important as part of the initial patient monitorization protocol is suspected myocardial dysfunction as the primary cause of the critical condition. Cardiogenic shock may be caused by structural alterations of the heart (e.g., coronary disease) or may be secondary to other processes (e.g., massive pulmonary thromboembolism, drug-related myocardial depression). In this case, correct and early monitorization of cardiac output is essential, not only as refers to the diagnosis of the process but also for guiding posterior treatment.
Please cite this article as: García X, et al. Estimación del gasto cardíaco. Utilidad en la práctica clínica. Monitorización disponible invasiva y no invasiva. Med Intensiva. 2011;35:552–61.

