


To explain mortality in the ICU and in hospital among patients subjected to invasive mechanical ventilation.
DesignA prospective, 9-month observational cohort study was carried out.
SettingA Department of Intensive Care Medicine.
PatientsConsecutive patients requiring invasive mechanical ventilation were followed-up on until hospital discharge or death.
InterventionsNone.
Interest variablesDate of admission, day of first spontaneous breathing test, length of mechanical ventilation, final extubation date, days in ICU, days in hospital or discharge from ICU, SAPS 3 score, WIND study classification, day of death, hospital discharge.
Measurements and main resultsThere were 266 patients: 40 in group 0 of the WIND classification, 15% 95%CI (11-20%); 166 in group 1, 62% 95%CI (56-68%); 38 in group 2, 14% 95%CI (11-19%); and 22 in group 3, 8% 95%CI (6-12%). Logistic regression analysis showed group 3 to have the highest hospital mortality (group 3 vs group 1; OR 4.0 95%CI (1.5–10.8)). However, Cox regression analysis showed no significant differences (HR group 3 vs group 1, 1.6 95%CI (0.7–3.4), p = ns).
ConclusionsIn our study, considering exposure time, the probability of mortality was the same among the three different groups of patients with at least one spontaneous breathing test.
Explicar mortalidad de pacientes con ventilación mecánica invasiva en el Servicio de Medicina Intensiva (SMI) y en el hospital.
DiseñoProspectivo de cohortes. Duración: 9 meses.
ÁmbitoServicio de Medicina Intensiva.
PacientesEn ventilación mecánica en el Servicio de Medicina Intensiva, desde la intubación hasta el alta del hospital.
IntervencionesNinguna.
Variables de interésFecha de ingreso, día de primera prueba de desconexión de la ventilación, días de ventilación mecánica, día de extubación final, los días de estancia en SMI y en el hospital, día de muerte o traslado del SMI, SAPS 3, clasificación del estudio WIND, día de muerte o alta de hospital.
ResultadosDe 266 pacientes, 40 eran del grupo 0 de la clasificación WIND, 15% IC 95%, (11-20%); 166 del grupo 1, 62% IC 95%, (56-68%); 38 del grupo 2, 14% IC 95%, (11-19%); y 22 del grupo 3, 8% IC 95%, (6-12%). Usando regresión logística, el grupo 3 tiene la más alta probabilidad de muerte en el hospital: grupo 3 vs 1, “odds ratio” 4,0 IC95% (1,5-10,8) p = 0,007). Sin embargo, no se observaron diferencias en la mortalidad del grupo 3 vs 1 empleando el método de regresión de Cox (“hazard ratio” 1,6 IC95% (0,7−3,4), p = ns).
ConclusiónEn nuestro estudio, y teniendo en cuenta el tiempo de exposición, la mortalidad es la misma entre los tres diferentes grupos de pacientes que se han sometido a una prueba de desconexión de la ventilación.
Mechanical ventilation is a routine technique in the Intensive Medicine Servicies (IMS) used for the patients’ live support.1,2 Its use can affect patients and is in direct corelation with the time elapsed on mechanical ventilation, among other causes.3–5 Shortening the time connected to mechanical ventilation is necessary to improve morbidity and mortality. On the other hand, it is well-known that extubation failures can worsen survival.6 The analysis of survival (using the Kaplan-Meier method and Cox proportional hazards regression model)7 and the logistics regression (LR) model8,9 have been used discretionally to assess mortality and its modifying factors both in the IMS and the hospital settings.
However, the mortality estimate depends on the statistical model used. The most precise estimates come from follow-up studies (analysis of survival and Cox proportional hazards regression model) where subjects are followed for a certain amount of time that is different for every subject. The time elapsed from the occurrence of an index event until the occurrence of a terminal event is registered. Or until the follow-up period is over if the terminal event does not occur (in such case it will be tagged as an incomplete or censored event).10 Another statistical model used to estimate the mortality rate is the LR model. However, it does not include the time elapsed until the occurrence of the event that is under consideration. The LR model only assesses the existence of the terminal event (such as death) and treats all events as complete events; this model has been widely used in the medical literature, but it is less accurate than the Cox proportional hazards regression model when used in follow-up studies.11
Weaning from mechanical ventilation is an important part of the patients’ progression at the IMS setting. Back in 2007, Boles et al.12 proposed a classification of patients on mechanical ventilation weaning; however, a large number of patients did not fall under this category. In 2017, the WIND trial13 proposed a new taxonomy of patients on mechanical ventilation weaning based on the time elapsed between the first mechanical ventilation weaning attempt and extubation adding a new group for patients with no weaning attempts (group 0).
The objective of our study was to conduct a WIND-categorized and overall analysis of our patients including IMS related and hospital admission related mortality by using 2 different statistical models. One of them takes into account the follow-up time (survival analysis and Kaplan-Meier method with Cox proportional hazards regression model). The other is the LR model (which is the one used in the WIND trial).
Patients and methodsStudy patientsThe study included all patients hospitalized and on mechanical ventilation. The entire hospitalization process was studied from IMS admission until hospital discharge; the patient may have been transferred to the Intermediate Care Unit or the hospitalization ward and then readmitted by the IMS. We followed the patients until they were discharged from the IMS, in the case of death or transfer to a different center or until they were discharged from the hospital. The standard criteria to define successful weaning from mechanical ventilation were used.14–16 This first weaning attempt is always performed using a T-shaped tube. Successful weaning is defined as a patient who can remain extubated for a whole week as it was the case in the WIND trial.13 This criterion also applies to tracheostomized patients, to those who have been disconnected from mechanical ventilation for more than a week or discharged from the IMS. Mechanical ventilation weaning in trachesotomized patients and those in whom the first weaning attempt fails was performed by gradually reducing pressure support ventilation or volume assist-control ventilation and through disconnections from the ventilator using a T-shaped tube depending on the study clinical tolerance.15,16 Our patients were all classified according to the most recent definitions.13 This classification included 4 groups: group 0, patients with 0 mechanical ventilation weaning attempts; group 1, the time elapsed between the first weaning attempt and extubation is < 1 day; group 2, the time elapsed between the first weaning attempt and extubation is between 1 and 6 days, and group 3, the time elapsed between the first weaning attempt and extubation is > 7 days.
Inclusion and exclusion criteriaWe studied patients over 18 who remained intubated and on invasive mechanical ventilation for more than 24 h. All patients were treated with orotracheal intubation at the beginning of the study. Non-intubated patients or those who were on non-invasive mechanical ventilation only were excluded.
Size of the sampleA total of 10 patients per effect analyzed had been anticipated with a total of 3 variables per group (there are 4 groups in the WIND classification) with an estimated loss of 15%. A total of 250 patients had been anticipated in the sample. The number of annual IMS admissions is around 550 patients/year, 80% of whom are patients intubated and on mechanically ventilation.
Data miningA database (Access 2010, Microsoft) was created that included the patients’ personal variables and underlying disease, day of hospital and IMS admission, intubation day, first weaning attempt from mechanical ventilation, extubation day, severity scores (SAPS-3 score), type of mechanical ventilation attempt (T-shaped tube), tracheostomy day, IMS discharge day, and day of hospital discharge.
The study was approved by the ethics committee of Hospital San Pau. All patients gave their prior written informed consent on an informative document, since the study involved no interventions or procedures.
Statistical analysisThe Stata 15 statistical software package was used (Copyright 1985–2017, StataCorp LLC, StataCorp LP, College Station, TX, United States). A descriptive analysis was conducted (median, interquartile range, and 95% confidence intervals [CI], as appropriate). To study mortality, the risk of death-cumulative incidence ratio was analyzed17‒ratio between the number of deaths and the total number of patients assessed at a given time‒, globally and group by group according to the WIND classification. This risk is mortality rate9,17 that was estimated as the ratio between the number of deaths and the total number of days that all patients remained in a life-threatening situation. A patient is at risk of dying as long as he remains at the IMS or hospital. Therefore, the days of risk of death include the days of IMS stay or the overall days of hospital stay. The rate is expressed as the number of deaths for every 100 patients and for 10 consecutive days to make it more clinically understandable. To assess the differences between risks and the differences between rates the Mantel-Haenszel test for linear trend was used in both cases. A survival curve was built with all the patients with a mechanical ventilation weaning attempt, and another curve was built for every WIND group. Both curves were compared using the Mantel-Haenszel test (logrank). Also, an explicative‒non predictive‒9,18 model of mortality was designed of the sample collected. To that end, the LR model and the analysis of survival using the Kaplan-Meier method with Cox proportional hazards regression model were used.10
The LR and Cox proportional hazards regression models are initially estimated without adjustments. Afterwards, the variables that modify the size of the initial mortality effect > 10%19 or that are considered clinically relevant are addded: the SAPS-3 as the severity score, the length of the IMS stay, and the days on mechanical ventilation. After the statistical models have been established, a diagnosis of all cases is achieved. Also, a collinearity analysis of the independent variables considered is conducted with measurements of tolerance and the variance inflation factor available in the software program package Stata 15. The proportionality of Cox proportional hazards regression model was tested using Schoenfeld residual testing20 and analyzing the Kaplan-Meier cuves.
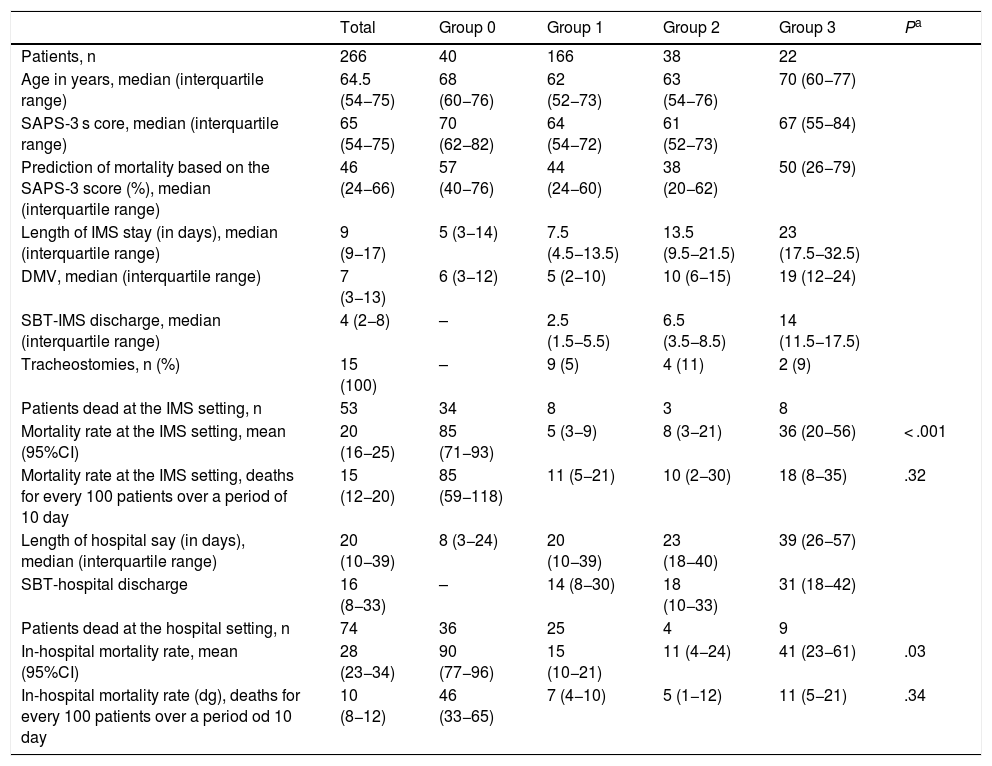
ResultsThe cohort studied included 266 consecutive patients (156 males and 110 women) recruited over a 9-month period. A total of 97 of all patients had respiratory failure, 88 were neurological patients, 27 had septic disease, 21 were in their postoperative period, 20 were polytrauma patients, and 13 patients had other syndromes. The median age was 64.5 years (interquartile range, 54–74). The median of the SAPS-3 score was 65; interquartile interval (54−75). The remaining data for the entire cohort are shown on Table 1. A total of 53 patients out of the entire sample (n = 266) died at the IMS (20%; 95%CI, 16% to 25%), and the mortality rate was 15 dead patients for every 100 patients over a period of 10 days (95%CI, 11–20). The total of patients who died during the entire hospital stay was 74 out of 266 (28%; 95%CI 23%–33%), and mortality rate was 10 dead patients for every 100 patients over a period of 10 days (IC 95% 8−12). Regarding the entire population (n = 266), the meadian length of the IMS stay and duration of mechanical ventilation were 9 and 7 days, respectively (7 and 5 for the living patients and 6 and 4 for the dead patients). El The median SAPS-3 score was 63 points for the living and 75 for the dead.
Patient’s characteristics and progression.
| Total | Group 0 | Group 1 | Group 2 | Group 3 | Pa | |
|---|---|---|---|---|---|---|
| Patients, n | 266 | 40 | 166 | 38 | 22 | |
| Age in years, median (interquartile range) | 64.5 (54−75) | 68 (60−76) | 62 (52−73) | 63 (54−76) | 70 (60−77) | |
| SAPS-3 s core, median (interquartile range) | 65 (54−75) | 70 (62−82) | 64 (54−72) | 61 (52−73) | 67 (55−84) | |
| Prediction of mortality based on the SAPS-3 score (%), median (interquartile range) | 46 (24−66) | 57 (40−76) | 44 (24−60) | 38 (20−62) | 50 (26−79) | |
| Length of IMS stay (in days), median (interquartile range) | 9 (9−17) | 5 (3−14) | 7.5 (4.5−13.5) | 13.5 (9.5−21.5) | 23 (17.5−32.5) | |
| DMV, median (interquartile range) | 7 (3−13) | 6 (3−12) | 5 (2−10) | 10 (6−15) | 19 (12−24) | |
| SBT-IMS discharge, median (interquartile range) | 4 (2−8) | – | 2.5 (1.5−5.5) | 6.5 (3.5−8.5) | 14 (11.5−17.5) | |
| Tracheostomies, n (%) | 15 (100) | – | 9 (5) | 4 (11) | 2 (9) | |
| Patients dead at the IMS setting, n | 53 | 34 | 8 | 3 | 8 | |
| Mortality rate at the IMS setting, mean (95%CI) | 20 (16−25) | 85 (71−93) | 5 (3−9) | 8 (3−21) | 36 (20−56) | < .001 |
| Mortality rate at the IMS setting, deaths for every 100 patients over a period of 10 day | 15 (12−20) | 85 (59−118) | 11 (5−21) | 10 (2−30) | 18 (8−35) | .32 |
| Length of hospital say (in days), median (interquartile range) | 20 (10−39) | 8 (3−24) | 20 (10−39) | 23 (18−40) | 39 (26−57) | |
| SBT-hospital discharge | 16 (8−33) | – | 14 (8−30) | 18 (10−33) | 31 (18−42) | |
| Patients dead at the hospital setting, n | 74 | 36 | 25 | 4 | 9 | |
| In-hospital mortality rate, mean (95%CI) | 28 (23−34) | 90 (77−96) | 15 (10−21) | 11 (4−24) | 41 (23−61) | .03 |
| In-hospital mortality rate (dg), deaths for every 100 patients over a period od 10 day | 10 (8−12) | 46 (33−65) | 7 (4−10) | 5 (1−12) | 11 (5−21) | .34 |
95%CI, 95% confidence interval; DMV, days on mechanical ventilation; SBT-hospital discharge, days between the first spontaneous breathing trial and hospital discharge; SBT-IMS discharge, days between the first spontaneous breathing trial and discharge from the Intensive Medicine Service.
A total of 40 patients out of the entire cohort of 266 paients fell within group 0 of the WIND classification (15%; 95%CI, 11% to 20%); 166 fell within group 1 (62%; 95%CI 56% to 68%); 38 within group 2 (14%; 95%CI, 11% to 19%); and 22 within group 3 (8%; 95%CI 6% to 12%).
The median and interquartile range of the previous days elapsed on mechanical ventilation before the first mechanical ventilation weaning attempt of WIND group 1 were 5 days (2−10); 7 days (3−12) in group 2, and 10 days (5–14) in group 3. Regarding the IMS and in-hospital crude mortality rates, significant differences were seen between groups 1 and 3 of the WIND classification (Table 1). However, the mortality rate of groups 1 and 3 in the WIND classification, both in-hospital and at the IMS, is different between the groups, but still non-statistically significant (Table 1).
Excluding group 0 (n = 40), where no patients on mechanical ventilation weaning were included and analyzing the patients included in groups 1, 2, and 3 (n = 226), the rate of dead patients at the IMS setting was 8.4% (19/226; 95%CI, 5% to 13%), being 6 dead patients the mortality rate for every 100 patients over a period of 10 days (95%CI, 4−10). The total of patients who died during the entire hospital stay was 38 out of 226 patients (17%; 95%CI, 13%–22%). Mortality rate was 5 dead patients for every 100 patients over a period of 10 days (95%CI, 4–8).
The median and interquartile range of days elapsed between intubation and tracheostomy were 26 days (19–40). The limitation of the therapeutic effort was applied to 13 out of 19 patients who had previously undergone a mechanical ventilation weaning attempt during their IMS stay. The reason for transferring patients outside the IMS was clinical improvement and to avoid monitoring or intensive or invasive treatments. The patients readmitted to the IMS were 13 of a total sample of 266 patients (5%; 95%CI, 3% to 8%). Eleven of the 13 patients readmitted to the IMS were reintubated. Six of these 13 patients (46%) died during the in-hospital episode.
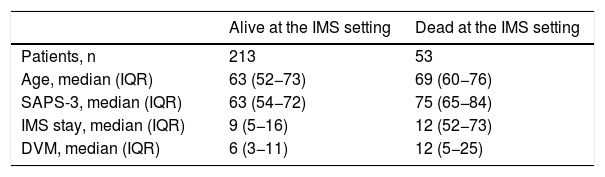
Table 2 shows the age, SAPS-3 score, length of stay, and days on mechanical ventilation of the entire cohort separated between alive and dead patients.
Relevant variables between alive and death patients.
| Alive at the IMS setting | Dead at the IMS setting | |
|---|---|---|
| Patients, n | 213 | 53 |
| Age, median (IQR) | 63 (52−73) | 69 (60−76) |
| SAPS-3, median (IQR) | 63 (54−72) | 75 (65−84) |
| IMS stay, median (IQR) | 9 (5−16) | 12 (52−73) |
| DVM, median (IQR) | 6 (3−11) | 12 (5−25) |
| Alive at the hospital setting | Dead at the hospital setting | |
|---|---|---|
| Patients, n | 192 | 74 |
| Age, median (IQR) | 62 (51−73) | 69 (60−77) |
| Hospital stay, median (IQR) | 21 (12−40) | 18 (6−33) |
DMV, days on mechanical ventilation; IMS, Intensive Medicine Service; IQR, interquartile range.
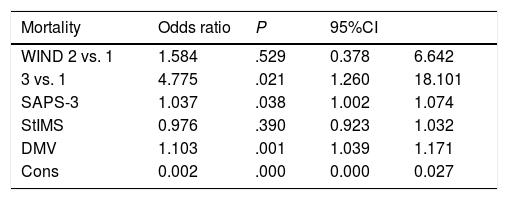
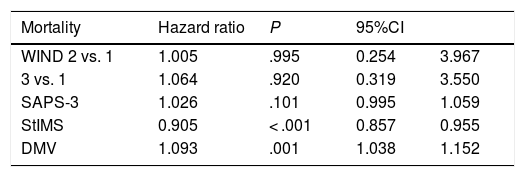
Tables 3 and 4 show mortality results at the IMS setting using the LR model (Table 3) and Cox proportional hazards regression model (Table 4). Table 3a shows the results obtained with the LR model (odds ratio) without adjusting group 3 vs. group 1 of the WIND classification, but still adjusting for the SAPS-3 score, length of hospital stay (days), and days on mechanical ventilation. Mortality differences are statistically significant. Table 3b shows the same data obtained with the Cox proportional hazards regression model. In this case no statistically significant differences were seen.
Logistics regression without adjustments in the IMS setting, odds ratio of WIND groups 3 vs. 1: 11.3; 95%CI (3.7-34.7); P < .001. Logistics regression adjusted in the IMS setting.
| Mortality | Odds ratio | P | 95%CI | |
|---|---|---|---|---|
| WIND 2 vs. 1 | 1.584 | .529 | 0.378 | 6.642 |
| 3 vs. 1 | 4.775 | .021 | 1.260 | 18.101 |
| SAPS-3 | 1.037 | .038 | 1.002 | 1.074 |
| StIMS | 0.976 | .390 | 0.923 | 1.032 |
| DMV | 1.103 | .001 | 1.039 | 1.171 |
| Cons | 0.002 | .000 | 0.000 | 0.027 |
95%CI, 95% confidence interval; Cons, constant; DMV, days on mechanical ventilation; StIMS, length of stay (days) at the Intensive Medicine Service.
Cox proportional hazards regression model without adjustments in the IMS setting, hazard ratio of WIND groups 3 vs. 1: 1.2; 95%CI (0.4-3.6); P = .728. Cox proportional hazards regression model adjusted in the IMS setting.
| Mortality | Hazard ratio | P | 95%CI | |
|---|---|---|---|---|
| WIND 2 vs. 1 | 1.005 | .995 | 0.254 | 3.967 |
| 3 vs. 1 | 1.064 | .920 | 0.319 | 3.550 |
| SAPS-3 | 1.026 | .101 | 0.995 | 1.059 |
| StIMS | 0.905 | < .001 | 0.857 | 0.955 |
| DMV | 1.093 | .001 | 1.038 | 1.152 |
95%CI, 95% confidence interval; Cons, constant; DMV, days on mechanical ventilation; StIMS, length of stay (days) at the Intensive Medicine Service.
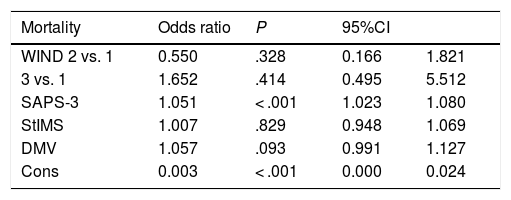
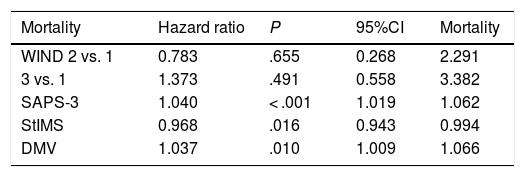
Tables 4 show the in-hospital mortality rates using the LR model (table 5) and the Cox proportional hazards regression model (table 6), respectively. Table 4a shows the results obtained with the LR model (odds ratio) without adjusting group 3 vs. 1 of the WIND classification, but adjusting for the SAPS-3 score, length of hospital stay (days), and days on mechanical ventilation. Motality differences were seen in the non-adjusted model. However, this difference vanishes after adjusting the model for the aforementioned variables. Table 4b shows the same data obtained using the Cox proportional hazards regression model. No differences were seen between groups 3 and 1 of the WIND classification or in the adjusted or non-adjusted model.
Logistics regression without adjustments in the hospital setting. Odds ratio of groups WIND 3 vs. 1: 4.0; 95%CI 1.5-10.8; P = .007. Logistics regression adjusted in the hospital setting.
| Mortality | Odds ratio | P | 95%CI | |
|---|---|---|---|---|
| WIND 2 vs. 1 | 0.550 | .328 | 0.166 | 1.821 |
| 3 vs. 1 | 1.652 | .414 | 0.495 | 5.512 |
| SAPS-3 | 1.051 | < .001 | 1.023 | 1.080 |
| StIMS | 1.007 | .829 | 0.948 | 1.069 |
| DMV | 1.057 | .093 | 0.991 | 1.127 |
| Cons | 0.003 | < .001 | 0.000 | 0.024 |
95%CI, 95% confidence interval; Cons, constant; DMV, days on mechanical ventilation; StIMS, length of stay (days) at the Intensive Medicine Service.
Cox proportional hazards regression model without adjustments in the hospital setting, hazard ratio of WIND groups 3 vs. 1: 1.6; 95%CI 0.7-3.4; P = .233. Cox proportional hazards regression model adjusted in the hospital setting.
| Mortality | Hazard ratio | P | 95%CI | Mortality |
|---|---|---|---|---|
| WIND 2 vs. 1 | 0.783 | .655 | 0.268 | 2.291 |
| 3 vs. 1 | 1.373 | .491 | 0.558 | 3.382 |
| SAPS-3 | 1.040 | < .001 | 1.019 | 1.062 |
| StIMS | 0.968 | .016 | 0.943 | 0.994 |
| DMV | 1.037 | .010 | 1.009 | 1.066 |
95%CI, 95% confidence interval; Cons, constant; DMV, days on mechanical ventilation; StIMS, length of stay (days) at the Intensive Medicine Service.
The Kaplan-Meier curves, Figs. 1–5, show the evolution of mortality in the IMS and hospital settings both globally and per WIND classification groups.

; P = .92.")

; P = .33.")

With our sample we did not see any differences in the mortality rate of patients with a first mechanical ventilation weaning attempt when they were classified according to the WIND study and compared based on mortality rates and survival analyses using the Kaplan-Meier and Cox proportional hazards regression models. These models all take the follow-up period into account. When adjusting the Cox regression equation for the SAPS-3 score, the length of the stay (days) and the days on mechanical ventilation, the effect of the last 2 variables was statistically significant in the IMS setting compared to all of them in the hospital setting. The SAPS-3 score predicts in-hospital mortality, not IMS mortality; the beneficial effect of the IMS stay is small when increased in just 1 day; however, it is statistically significant; (tables 3 b and 4 b) and could be clinically relevant with longer stays. This may be due to the care provided while patients are out of the limitation of therapeutic effect strategy. The deleterious effect due to an accumulation of days on mechanical ventilation is well-known.13 In our study, this effect is also significant but small when mechanical ventilation is prolonged in just 1 day (tables 3 b and 4 b). However, the deleterious effect of ventilation logically increases as the days on mechanical ventilation increase as well (cumulative risk).
Mortality differences were seen in the same sample when a mortality rate based model and LR model were used both in the IMS and in the hospital setting. Since the LR model does not take into account the follow-up time, the inter-group mortality differences seen were significantly higher when this model was used compared to when the Cox proportional hazards regression model was used (tables 3–4). However, the use of mortality rates and the LR model may give us biased or inaccurate estimates.11,21 Actually, the LR model8,22,23 is appropriate when a binary effect like being dead or alive is analyzed without taking into account the moment when the effect actually happens.8,17,23,21 However, the LR model may not be appropriate to estimate mortality in the context of variable follow-up studies such as when estimating IMS and in-hospital mortality.1,21
With the LR model we lose information because it ignores the time elapsed until death occurs and the time the patient remains hospitalized.24,25 The use of this model for follow-up studies of any variables should only be considered as an alternative to the Cox proportional hazards regression model when the follow-up of the cohort is short in time and the rate of censoring, that is, the number of patients who do not make it to the event that is being analyzed—death in our case—is minimum and similar between the levels of the explicative variable.11,17,21 A censored data (or incomplete event) is, therefore, a living patient at the end of the follow-up period (IMS or hospital in our case).
The WIND study13 is an effort to unify the criteria and include all the clinical possibilities of patients who remain on invasive mechanical ventilation. However, the simple comparison of the rates of dead patients without any confidence intervals to estimate what actually happens in the general population may not be adequate enough to conclude that the mortality rate of one group is different from that of the other. The mortality rates reported by the WIND study, that only analyzed mortality in the IMS setting, cannot be compared to the risk of death becase to be considered as such the follow-up period17 is required which, in this case, varies from one patient to the next and from one group to the next and, therefore, is not comparable.
Our strategy to analyze events while on mechanical ventilation, in particular from the first mechanical ventilation weaning attempt, is similar to that used by authors like Jubran et al.26 who used an analysis of survival with the Kaplan-Meier method and logrank to estimate mortality in a group of patients weaning from mechanical ventilation. Another study27, in the same group, also used the Cox proportional hazards regression model to quantify the mortality rate associated with certain variables (connection to mechanical ventilation, vasopressor therapy, and the SAPS-2 score, among others). This methodology allowed the authors to analyze mortality in detail in a cohort with great variability at the follow-up.
Our study has some limitations. There were very few patients in groups 2 and 3 of the WIND classification. This study was conducted in a single center, which means that its external validity could be put into question. The limitation of the therapeutic effort could condition the time elapsed until death occurs. Thus, if the limitation of the therapeutic effort minimized the amount of days the patients remain at risk, it would overestimate mortality rates. Also, in group 1 of our study, there is a large number of patients discharged from the IMS who eventually die at the hospital floor after the implementation of measures to limit the therapeutic effot. The Kaplan-Meier method means that the chances that a certain data will be censored is independent from survival time (or the follow-up period), an assumption that may not be true with our patients.25,28 The fact that no mortality differences were seen among the groups of the WIND classification may also be due to the fact that our study was statistically underpowered. However, the same statement should be true for the LR model, where differences were actually seen.
In our own view and in the opinion of other authors10,25–27, the analysis of survival and Cox proportional hazards regression model are more suitable than the LR model to estimate mortality in the IMS and the hospital settings. That is so because, in the LR model, information on the follow-up period is lost, and the information provided by the independent variables of the equation may be different.
The fact that, in our study, no differences were seen when rates, survival analyses or the Cox proportional hazards regression model were used may be explained by the efficacy of the treatments administed to our patients. Group 3 of the WIND classification—where we used more resources to avoid death—has a similar mortality rate to that of group 1 of the WIND classification, of little complexity during mechanical ventilation weaning, but with an early disease severity, and similar comorbidities compared to group 3.
In conclusion, according to our 9-month single-center study, the local routine clinical practice, and taking time of exposure into consideration, the mortality rate of the 3 different groups of patients with mechanical ventilation weaning attempts is the same.
AuthorsJ.A. Santos thought of the initial idea of studying mortality rate in patients undergoing mechanical ventilation weaning attempts. Also, he has been the person in charge for proposing different hypotheses, collecting data, conducting the statistical analysis, and writing this manuscript.
J. Mancebo proposed the idea of studying mortality in patients undergoing mechanical ventilation weaning attempts. Also, he has supervised this study and was the person responsible for conducting the critical assessment of this manuscript.
Conflicts of interestNone reported.
Please cite this article as: Santos Rodriguez JA, Mancebo Cortés J. Estudio de mortalidad de pacientes en desconexión progresiva del ventilador. Med Clin (Barc). 2020;44:485–492.

