


An evaluation is made of the hospital mortality predicting capacity of the main predictive scoring systems.
DesignA 2-year retrospective cohort study was carried out.
SettingA third level ICU with surgical and medical patients.
PatientsAll patients with multiorgan failure during the first day in the ICU.
Main variablesAPACHE II and IV, SAPS II and III, MPM II and hospital mortality.
ResultsA total of 568 patients were included. Mortality rate: 39.8% (226 patients). Discrimination (area under the ROC curve; 95% CI): APACHE IV (0.805; 0.751–0.858), SAPS II (0.755; 0.697–0.814), MPM II (0.748; 0.688–0.809), SAPS III (0.737; 0.675–0.799) and APACHE II (0.699; 0.633–0.765). MPM II showed the best calibration, followed by SAPS III. APACHE II, SAPS II and APACHE IV showed very poor calibration. Standard mortality ratio (95% CI): APACHE IV 1.9 (1.78–2.02); APACHE II 1.1 (1.07–1.13); SAPS III 1.1 (1.06–1.14); SAPS II 1.03 (1.01–1.05); MPM 0.9 (0.86–0.94).
ConclusionsAPACHE IV showed the best discrimination, with poor calibration. MPM II showed good discrimination and the best calibration. SAPS II, in turn, showed the second best discrimination, with poor calibration. The APACHE II calibration and discrimination values currently disadvise its use. SAPS III showed good calibration with modest discrimination. Future studies at regional or national level and in certain critically ill populations are needed.
Valorar el grado en que las escalas pronósticas son capaces de predecir la mortalidad hospitalaria.
DiseñoEstudio de cohortes retrospectivo de 2 años.
ÁmbitoUCI médico-quirúrgica de un hospital de tercer nivel.
PacientesTodos los pacientes con síndrome de disfunción multiorgánica en el primer día de ingreso.
Variables de interésAPACHE II y IV, SAPS II y III, MPM II y muerte hospitalaria.
ResultadosSe incluyeron 568 pacientes. Mortalidad hospitalaria: 39,8% (226 pacientes). Discriminación (área bajo la curva; IC 95%): APACHE IV (0,805; 0,751-0,858), SAPS II (0,755; 0,697-0,814), MPM II (0,748; 0,688-0,809), SAPS III (0,737; 0,675-0,799) y APACHE II (0,699; 0,633-0,765). El MPM II es el que mejor calibra, seguido por el SAPS III. APACHE II, SAPS II y APACHE IV presentan una muy mala calibración. Razón estandarizada de mortalidad (IC 95%): APACHE IV 1,9 (1,78-2,02); APACHE II 1,1 (1,07-1,13); SAPS III 1,1 (1,06-1,14); SAPS II 1,03 (1,01-1,05); MPM 0,9 (0,86-0,94).
ConclusionesAPACHE IV tiene la mejor capacidad discriminativa y mala calibración. MPM II tiene una buena discriminación y la mejor calibración. En cuanto al SAPS II, mantiene la segunda mejor discriminación y una mala calibración. El APACHE II muestra unos valores de calibración y discriminación que desaconsejarían su utilización en la actualidad, y el SAPS III mantiene una adecuada calibración y una discriminación moderada. La valoración de estos resultados podría marcar el inicio de nuevos estudios a nivel regional/nacional en determinadas poblaciones de pacientes críticos.
Improvement in the quality of critical care requires quantitative assessment of the structure used, the care process, and patient evolution.1 In this regard, patient evolution is clearly determined by the initial severity of the disease condition. Measuring severity is a constant concern in the critically ill patient, and offers a range of benefits.2 In effect, the measurement of severity helps establish a prognosis, fundamentally in terms of patient mortality. Furthermore, it allows us to know the profile of our patients, and has an impact upon the management of the material and human resources used. Prognostic assessment, by allowing the adjustment of actual mortality to predicted mortality, affords a care quality indicator that facilitates comparison with other institutions (benchmarking).1 Lastly, the measurement of severity plays an important role in facilitating the investigation of outcomes, by ensuring the comparison of patients that exhibit similar severity factors. In this respect, severity scales have been designed with a view to standardizing the measurement of severity.
Three large groups of severity scales with different versions are predominantly used3: the Acute Physiology and Chronic Health Evaluation (APACHE), the Simplified Acute Physiology Score (SAPS), and the Mortality Prediction Models (MPM). Based on a logit function, these scales transform their scores into in-hospital mortality probability values, grouping the patients in terms of the probability of death. Such predictive scoring systems have been developed from the analysis of large cohorts of patients with different medical–surgical diseases.4 Their main limitations are a lack of individual predictive capacity, their use in patient populations not included in the studies from which the scales were originally developed, or their application to groups of patients with concrete diseases.5
Although many factors are related to mortality (age, comorbidity, diagnosis upon admission to the Intensive Care Unit [ICU], etc.), the severity of the physiological anomalies are its fundamental conditioning parameter.6 In the critical patient, these anomalies find their maximum expression in multiple organ dysfunction syndrome (MODS). Patients with MODS present a high mortality rate that is correlated to the number of affected organs.7 Although these individuals form part of the population of patients from which the severity scales were developed (accounting for about one-third of the total patients in a third-level ICU), we have found no previous studies exclusively based on subjects of this kind.4
The present study was carried out to determine the degree to which the currently most widely used predictive scoring systems are able to predict real mortality in the ICU among patients who develop MODS in the first 24h of admission.
Patients and methodsA retrospective cohort study was made in the ICU of Hospital Virgen de la Salud (Toledo, Spain), consecutively analyzing the case histories of medical–surgical patients with MODS over a period of two years. The patients were required to be over 16 years of age, and with a minimum ICU stay of 12h. We defined MODS as the presence of at least two dysfunctional organs during the first 24h of admission to the ICU, as assessed by the SOFA scale.8 All patients with missing data needed for calculation of the severity scores were excluded, as were patients referred from other ICUs with an evolutive course of over 24h, cases of brain death, and patients readmitted to the ICU during the same hospital stay.
The patients were followed-up on during their stay in the ICU and in the hospital ward until discharge or death – with registry of the final outcome. General data corresponding to admission were collected (gender, age, presence of infection, basal situation – asymptomatic for activities of daily living – origin, diagnosis upon admission, need for mechanical ventilation, destination at discharge from the ICU, hospital and ICU stays, death and place of death), together with the information needed for the APACHE II3 and IV,9 SAPS II10 and III11 (European scale) and MPM II severity scales.12 The MPM II employed was that assessed after 24h, in order to allow comparison with the SAPS and APACHE scores, since all three are assessed within the first 24h.
Quantitative data were reported as the mean (standard deviation [SD]), and categorical data as count (percentage). The comparison of categorical variables was based on the chi-squared test, with the Fisher approximation for 2×2 tables where indicated. The Student t-test in turn was used for the comparison of quantitative variables.
We calculated all the scores of the different scales and the predicted mortality figures. Discrimination and calibration were studied to evaluate the validity of the model.
Discrimination is the capacity to distinguish between subjects that die and those that survive, describing the precision of a given prediction. For example, if the model predicts a mortality rate of 35%, its predictive capacity is perfect if the observed mortality rate is 35%. The assessment of discrimination was made based on the receiver operating characteristic (ROC) curve (95% confidence interval [95%CI]), and the area under the curve (AUC) can be regarded as a global measure of the discriminating capacity of the model.
Calibration of the model is the adjustment or fit that assesses concordance (agreement) between the probabilities observed in the sample and the probabilities predicted by the model – describing how the prognostic scale is executed over a broad range of predicted mortalities. Thus, good calibration is precise in mortalities of 10%, 50% and 80%, for example. Calibration was assessed based on the Hosmer–Lemeshow goodness-of-fit test, which exhibits the best fit when the probability is equal to 1 (non-significance indicating better fit).13 In this respect, the mortality probabilities were distributed into 10 defined mortality probability groups (risk deciles), attempting to categorize an approximate number of patients in each group.
The assessment of calibration was complemented by the standardized mortality ratio (SMR), i.e., the ratio between observed mortality and predicted mortality. If SMR=1, calibration is regarded as good, with perfect agreement, since observed mortality equals predicted mortality. In contrast, if SMR<1, the mortality is overestimated, while SMR>1 means that mortality is underestimated.
The data were analyzed using the SPSS® version 20 statistical package (IBM Corp., 2011). Statistical significance was considered for p<0.05.
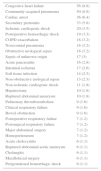
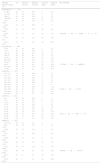
ResultsThe study population during the evaluated period comprised 568 patients that met the inclusion criteria and none of the exclusion criteria. Table 1 reports the most frequent diagnoses. The global in-hospital mortality rate was 39.8% (226 patients); 165 (29.1%) died in the ICU, and 61 (10.7%) in the hospital ward following discharge from the ICU. The characteristics referred to admission, the patient course and severity scales are shown in Table 2.
Most frequent clinical diagnoses (>1%).
| Congestive heart failure | 56 (9.8) |
| Community-acquired pneumonia | 50 (8.8) |
| Cardiac arrest | 36 (6.4) |
| Secondary peritonitis | 33 (5.8) |
| Ischemic cardiogenic shock | 20 (3.5) |
| Postoperative hemorrhagic shock | 19 (3.3) |
| COPD exacerbation | 18 (3.2) |
| Nosocomial pneumonia | 18 (3.2) |
| Obstructive urological sepsis | 18 (3.2) |
| Sepsis of unknown origin | 17 (3) |
| Acute pancreatitis | 16 (2.8) |
| Intestinal ischemia | 17 (2.6) |
| Soft tissue infection | 14 (2.5) |
| Non-obstructive urological sepsis | 13 (2.3) |
| Non-ischemic cardiogenic shock | 11 (1.9) |
| Hepatectomy | 10 (1.8) |
| Ruptured abdominal aneurysm | 10 (1.8) |
| Pulmonary thromboembolism | 9 (1.6) |
| Clinical respiratory failure | 9 (1.6) |
| Bowel obstruction | 9 (1.6) |
| Postoperative respiratory failure | 7 (1.2) |
| Postsurgical respiratory failure | 7 (1.2) |
| Major abdominal surgery | 7 (1.2) |
| Hemoperitoneum | 7 (1.2) |
| Acute cholecystitis | 6 (1.1) |
| Ruptured abdominal aortic aneurysm | 6 (1.1) |
| Cholangitis | 6 (1.1) |
| Maxillofacial surgery | 6 (1.1) |
| Perigestational hemorrhagic shock | 6 (1.1) |
COPD, chronic obstructive pulmonary disease.
The data are expressed as n (%).
Description of the admission and evolutive variables, and the severity scales in the total patients, in those who survived and in those who died.
| Variable | Total sample (No.=568) | Survivors (n=342) | Deceased (n=226) |
|---|---|---|---|
| Male gender | 367 (64.6%) | 222 (64.9%) | 145 (64.2%) |
| Age (years)* | 64 (16.4) | 60.4±17.4 | 69.6±12.7 |
| BFS: asymptomatic daily activity | 415 (73.1%) | 257 (75.1%) | 157 (69.8%) |
| Origin** | |||
| Ward | 200 (35.1%) | 99 (28.9%) | 101 (44.7%) |
| Emergencies | 194 (34.1%) | 133 (38.9%) | 60 (26.5%) |
| Operating room | 143 (25.2%) | 90 (26.3%) | 53 (23.5%) |
| Other hospital | 31 (5.5%) | 20 (5.8%) | 12 (5.3%) |
| Septic patient | 234 ((41.1%) | 141 (41.2%) | 93 (41.2%) |
| Mechanical ventilation during admission to ICU* | 448 (78.9%) | 238 (69.6%) | 211 (93.3%) |
| ICU stay (days)** | 8.4 (12.8) | 7.2±8.9 | 10.2±17 |
| Post-ICU hospital stay (days)* | 12.4 (19.9) | 16.6±18.4 | 6.2±20.3 |
| Destination at ICU discharge | |||
| War | 383 (94.3%) | 320 (93.6%) | 62 (98.4%) |
| Other hospital | 23 (5.7%) | 22 (6.4%) | 1 (1.6%) |
| SOFA* | 8 (3.4) | 6.9±2.8 | 9.7±3.6 |
| APACHE II* | 18.6 (8.2) | 16.3±6.9 | 22.6±8.8 |
| APACHE IV* | 60.8 (23.8) | 52.3±19.1 | 75±24.2 |
| SAPS II* | 45.2 (18.2) | 38.9±14.5 | 55.3±18.8 |
| SAPS III* | 63.5 (14.7) | 59.1±12.8 | 70.4±14.9 |
| MPM II* | 43.2 (28.8) | 33.7±25.4 | 58.2±27.3 |
APACHE, Acute Physiology and Chronic Health Evaluation; MPM, Mortality Prediction Model; SAPS, Simplified Acute Physiology Score; BFS, basal functional status; SOFA, Sequential Organ Failure Assessment; ICU, Intensive Care Unit.
Comparisons between survivors and deceased patients:
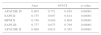
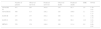
Calibration, evaluated for the severity scales using the Hosmer–Lemeshow goodness-of-fit test, is shown in Table 3. Fig. 1 evaluates the different ROC curves according to the established predictive model, and Table 4 shows the corresponding areas under the curve, with the 95%CI and significance for each scale. Table 5 in turn determines the SMR for each predictive scoring system with the corresponding 95%CI. Fig. 2 shows the different calibration curves.
Hosmer–Lemeshow goodness-of-fit test in the different predictive scoring systems.
| Mortality predictive deciles (%) | No. | Observed survivors | Predicted survivors | Observed deaths | Predicted deaths | H-L GFT/df/p |
|---|---|---|---|---|---|---|
| APACHE IV (n=471) | ||||||
| 0–1.89 | 47 | 43 | 46.5 | 4 | 0.5 | |
| 1.9–3.65 | 47 | 44 | 45.7 | 3 | 1.3 | |
| 3.66–6 | 48 | 44 | 45.6 | 4 | 2.4 | |
| 6.04–8.97 | 47 | 36 | 43.5 | 11 | 3.5 | |
| 9.03–12.92 | 47 | 30 | 41.8 | 17 | 5.2 | |
| 12.94–17.49 | 47 | 30 | 39.9 | 17 | 7.1 | |
| 17.67–23.88 | 47 | 23 | 37.4 | 24 | 9.6 | |
| 24.04–33.95 | 47 | 21 | 33.7 | 26 | 13.3 | 130.54/df=8/p=2.18624×10±24 |
| 35.71–47.3 | 47 | 13 | 27.5 | 34 | 19.5 | |
| 48.11–97.18 | 47 | 9 | 16.1 | 38 | 30.9 | |
| APACHE II (n=498) | ||||||
| 4–9.9 | 52 | 48 | 48.2 | 4 | 3.8 | |
| 10–13 | 49 | 37 | 43.3 | 12 | 5.7 | |
| 14.6–17 | 49 | 36 | 41.2 | 13 | 7.8 | |
| 18.6–21 | 50 | 28 | 40 | 22 | 10 | |
| 23–26.2 | 50 | 34 | 37.5 | 16 | 12.5 | |
| 28.9–35.5 | 49 | 35 | 33.7 | 14 | 15.3 | |
| 36–42.4 | 46 | 31 | 28.1 | 15 | 17.9 | |
| 46–53 | 56 | 32 | 29.1 | 24 | 26.9 | 27.126/df=8/p=0.0006721 |
| 53.3–70.3 | 48 | 21 | 17.8 | 27 | 30.2 | |
| 73–99.1 | 49 | 11 | 9.3 | 38 | 39.7 | |
| SAPS III (n=257) | ||||||
| 0.47–7.6 | 32 | 29 | 30.4 | 3 | 1.6 | |
| 8.5–12.7 | 24 | 20 | 21.4 | 4 | 2.6 | |
| 13.9–18.1 | 23 | 15 | 19.3 | 8 | 3.7 | |
| 19.7–24.7 | 25 | 17 | 19.5 | 8 | 5.5 | |
| 26.7–34.1 | 30 | 19 | 20.8 | 11 | 9.2 | |
| 36.1–40.2 | 21 | 15 | 13 | 6 | 8 | |
| 42.2–50.2 | 29 | 15 | 15.6 | 14 | 13.4 | |
| 52.2–57.9 | 22 | 14 | 9.8 | 8 | 12.2 | 10.6/df=8/p=0.2254 |
| 59.7–66.4 | 26 | 9 | 9.9 | 17 | 16.1 | |
| 67.9–87.6 | 25 | 4 | 5.5 | 21 | 19.5 | |
| SAPS II (n=258) | ||||||
| 0–6 | 28 | 28 | 26.9 | 0 | 1.1 | |
| 7–11 | 25 | 21 | 22.7 | 4 | 2.3 | |
| 12–15 | 25 | 18 | 21.7 | 7 | 3.3 | |
| 17–21 | 25 | 18 | 20.2 | 7 | 4.8 | |
| 23–31 | 28 | 16 | 20.4 | 12 | 7.6 | |
| 33–40 | 24 | 14 | 15.3 | 10 | 8.7 | |
| 41–51 | 28 | 14 | 15.2 | 14 | 12.8 | |
| 53–66 | 25 | 14 | 10.2 | 11 | 14.8 | 44/df=8/p=5.689×10−7 |
| 68–83 | 26 | 11 | 6.7 | 15 | 19.3 | |
| 84–99 | 24 | 4 | 1.9 | 20 | 22.1 | |
| MPM II (n=258) | ||||||
| 1.02–6.72 | 26 | 24 | 25 | 2 | 1 | |
| 6.97–13.52 | 26 | 20 | 23.2 | 6 | 2.8 | |
| 13.79–22.55 | 26 | 22 | 21.2 | 4 | 4.8 | |
| 23.2–29.71 | 25 | 18 | 18.4 | 7 | 6.6 | |
| 30.06–38.82 | 26 | 17 | 17.1 | 9 | 8.9 | |
| 39.14–51.59 | 26 | 16 | 14.5 | 10 | 11.5 | |
| 51.6–59.88 | 26 | 15 | 11.3 | 11 | 14.7 | |
| 60.2–67.62 | 26 | 10 | 9.2 | 16 | 16.8 | 7.964/df=8/p=0.43739 |
| 67.73–86.73 | 25 | 9 | 5.5 | 16 | 19.5 | |
| 87.55–99.58 | 26 | 7 | 1.2 | 19 | 24.8 | |
APACHE, Acute Physiology and Chronic Health Evaluation; df, degrees of freedom; MPM, Mortality Prediction Model; H–L GFT, Hosmer–Lemeshow goodness-of-fit test; SAPS, Simplified Acute Physiology Score.
 curve for the different predictive models.")
Area under the curve (AUC) with 95% confidence interval and significance level, for each of the severity scales.
| Area | 95%CI | p-value | ||
|---|---|---|---|---|
| APACHE IV | 0.805 | 0.751 | 0.858 | 0.00001 |
| SAPS II | 0.755 | 0.697 | 0.814 | 0.00001 |
| MPM II | 0.748 | 0.688 | 0.809 | 0.00001 |
| SAPS III | 0.737 | 0.675 | 0.799 | 0.00001 |
| APACHE II | 0.699 | 0.633 | 0.765 | 0.00001 |
APACHE, Acute Physiology and Chronic Health Evaluation; 95%CI, 95% confidence interval; MPM, Mortality Prediction Model; SAPS, Simplified Acute Physiology Score.
Determination of the standardized mortality ratio (SMR) and corresponding 95% confidence interval for the different severity scales.
| Number of patients | Observed survivors | Predicted survivors | Observed deaths | Predicted deaths | SMR | 95%CI | |
|---|---|---|---|---|---|---|---|
| APACHE IV | 471 | 293 | 343.6 | 178 | 93.3 | 1.9 | 1.78–2.02 |
| APACHE II | 498 | 313 | 328.2 | 185 | 169.8 | 1.1 | 1.07–1.13 |
| SAPS III | 257 | 157 | 165.2 | 100 | 91.8 | 1.1 | 1.06–1.14 |
| SAPS II | 258 | 158 | 161.2 | 100 | 96.8 | 1.03 | 1.01–1.05 |
| MPM II | 258 | 158 | 146.6 | 100 | 111.4 | 0.9 | 0.86–0.94 |
APACHE, Acute Physiology and Chronic Health Evaluation; 95%CI, 95% confidence interval; MPM, Mortality Prediction Model; SAPS, Simplified Acute Physiology Score; SMR, standardized mortality ratio.
 for observed mortality (line with square markers, with dashed lines). The lines without markers represent predicted mortality; the lines with round markers represent the percentage of subjects for each of the mortality deciles.")
In our series we included patients with MODS in the first 24h of admission. This is the period usually considered by the predictive scoring systems for assessing the physiological data, since it coincides with the interval of greatest physiological deterioration. Although the predictions that use physiological data in the first hour of admission have revealed no statistically significant differences with the worst values of the first 24h,14 fewer missing values and a greater explanatory capacity are obtained when considering a period of 24h.15
Our series showed a high in-hospital mortality rate, with the death of almost four out of every 10 patients, particularly in the period of admission to the ICU, with long ICU stays (over one week), post-ICU hospital stays (about 2 weeks), a high frequency of mechanical ventilation during admission (about 79%), and high dysfunction predictive scores (SOFA score of about 8). This coincides with the findings of other series involving patients in these evolutive stages and levels of severity.16
The most frequent diagnoses were consistent with those found in any polyvalent (medical–surgical) ICU. The patients that died presented an already known profile, being of older age, admitted from the hospital ward, with a greater incidence of mechanical ventilation, a longer ICU stay, a shorter post-ICU stay (possibly because of death), a larger number of dysfunctional organs (almost 30% more), and with poorer predictive scores.17 A more detailed evaluation of the validity of the models requires an analysis of discrimination and calibration. In this regard, it must be remembered that poor calibration and discrimination may be due to differences in the quality of expected care, but also to poor applicability of the model to a concrete patient population.18
The APACHE, SAPS and MPM are the three most widely used scales. Problems referred to ease of use, the number of required variables (142 in the case of APACHE IV, 20 in SAPS III, and 13 in MPM II 24h, for example), and the costs associated to their use have limited the application of the most recent (and improved) versions. Among the different existing version, the APACHE II is the most widely used instrument.19 In this respect, APACHE II exhibited shortcomings in predicting specific patient subgroups (liver failure, sepsis, etc.), and showed predicted mortality to be lower than the observed mortality in ICU patients transferred from other hospital stays (a phenomenon known as lead time bias)20,21 (this being the reason why we excluded patients transferred from other centers). A similar situation may occur with the SAPS II, which is more widely used than the SAPS III. This circumstance would reflect not only the limitations inherent to its lesser complexity (the use of “less refined” versions), but also the fact that we would be comparing our patients with cohorts already over two decades old. All the severity scales require periodic revisions, recalibrations and updates in relation to the improvement of patient care (treatment and other factors that influence mortality, such as the introduction of new technologies). Furthermore, these revisions should be used in the contemporaneous studies carried out. Failure to update the predictive scoring systems would result in gradual loss of calibration over time, with the overestimation of mortality for any given severity scale.22,23 This over-prognosis effect was not clearly seen in our study.
We have used the most important principles required for assessing a severity scale, employing adequate discrimination and calibration to effectively measure the prognosis referred to in-hospital mortality. The predictive scoring systems generally showed excellent discrimination–the main problem being shortcomings in calibration. This was particularly manifest in the case of the APACHE scale, but was also seen in the rest of the predictive scoring systems (SAPS III, etc.).22
There are important differences among the range of predictive scoring systems in relation to data collection, the calculation of mortality, efficacy and costs.24 While the APACHE scale requires the documentation of many physiological and general data, the other instruments use fewer variables and have a simpler coding system, which facilitates data collection.25 The transition from simplified predictive systems to other more complex instruments is a long process, with many problems. In this respect, developments in computer science have made it possible to use mathematically complex predictive systems, though this has not been accompanied by parallel developments in the automation of data recording.14 All this complicates data collection in predictive scoring systems such as the APACHE IV, where complexity is maximum. In contrast, other systems such as the MPM or SAPS, place emphasis on simplicity. Few studies have compared the three predictive scoring systems; the APACHE IV generally exhibits better predictive precision, though the MPM (II and III) has been shown to be an effective alternative when priority is focused on lower costs and a lesser complexity of the collected data.25,26
There are no previous studies on the use of predictive scoring systems in patients only with MODS, though such patients to one degree or other form part of all the series published in the intensive care setting. Indeed, the opposite scenario is often observed: for example, about two-thirds of the APACHE IV validation cohort presented low risk at the time of admission (mortality rate<10%).27,28
The best performance in terms of discrimination corresponded to the APACHE IV, which yielded adequate values (0.805). In comparison, SAPS II (0.755), MPM II (0.748) and SAPS III (0.737) showed progressively poorer discrimination. The APACHE II scale showed the poorest discrimination of all the instruments (0.699).
In our series, MPM II was the predictive model with the best calibration, followed by SAPS III. The APACHE II, SAPS II and APACHE IV scales had very poor calibration. Specifically, the greatest shortcomings in terms of calibration corresponded to the APACHE IV scale.
In relation to SMR, all the scales showed values of close to 1, except the APACHE IV scale, which yielded 1.9 (95%CI 1.78–2.02) and thus more clearly underestimated mortality. In general terms, APACHE II and SAPS III tended to underestimate mortality, while MPM II tended to overestimate mortality, though in all cases the deviations were discrete. The SMR is a mandatory clinical management parameter in some countries in both Europe and the United States (all the ICUs belonging to the veterans administration), and it is usually used as an international quality measure29–though some authors express concern about exclusive use of the SMR as a quality indicator.14 Many users simply seek to achieve SMR<130. However, despite its widespread use, the SMR is well known to have some intrinsic limitations.30 In this regard, high-risk patients contribute disproportionately to SMR, since many of these individuals die. It is therefore important to report SMR separately for patients with low, moderate and high risk. In this way the impact of a disproportionate number of high-risk patients becomes diluted, and the SMR is no longer so dependent upon the type of patients seen in each ICU. This is important, since a growing number of studies speak of poorer calibration precision at the extremes of severity.9,27,31
On examining the calibration curves we can establish a moderate mortality risk group (in-hospital mortality rate 10–50%) and a high mortality risk group (in-hospital mortality rate >50%), which can be analyzed separately.27 The APACHE IV was the predictive scale that most intensely underestimated predicted mortality in the moderate risk group. The same situation was observed in the high risk group, though to a lesser degree. The same pattern, albeit of lesser magnitude, was recorded with the APACHE II and SAPS II, in both mortality groups. The SAPS III only tended to underpredict in the moderate risk group, and performed well in the high risk group. The MPM II scale showed a different behavior, characterized by over-prediction, particularly in the high risk group. Curiously, in most of the published patient cohorts, in relation to the highest predicted mortality figures, the observed mortality was found to be lower than calculated mortality.18 The calibration curves show the 95% confidence intervals to be very wide (lesser precision); more patients are therefore probably needed in order to obtain more adjusted and precise results.
Our study has limitations. The sample size, while moderate, is not optimum for studies of this kind. Furthermore, this study was carried out in a single center in Spain, outside the geographical setting in which some of the examined scales were validated – a fact that has an impact upon the precision of the model.32–34 On the other hand, the utilization of severity scales that group patients into homogeneous disease processes–while of growing interest–is also a clear limitation.
It is unavoidable (and for many authors desirable) for the predictive scoring systems to become increasingly used, to the point of governing our clinical activities.35 It is important to seek maximum closeness between the real world and the proposed model. In this sense it is crucial to evaluate the tools we use in our patients, and doing so in the individuals of greatest disease severity is of great interest, since we tend to underestimate actual mortality. Each country should ensure that the model fits its own data, since good calibration of the model will afford reliable meaning and adequate estimated probabilities.36 Considering the lack of a locally calibrated system, we have established indirect comparisons of the observed outcome versus the outcome predicted by the different models, applied in the patient populations used to develop the risk model. It is important to do this in the population of interest, in order to implement quality assessment using evolution in the ICU adjusted for risk–evaluating not only mortality but also stays, readmissions to the ICU, or other evolutive parameters.37,38
In our series of patients with MODS, the APACHE IV scale afforded the best discriminative capacity, and we confirmed its poor calibration. The MPM III was not tested, though we found the MPM II to offer good discrimination and the best calibration of all the evaluated scales. The SAPS II in turn offered the second best discrimination, with poor calibration. The APACHE II calibration and discrimination values currently disadvise its use. Lastly, the SAPS III showed good calibration with modest discrimination. We believe that these results could serve to initiate new larger and multicenter studies in certain critically ill populations.
Financial supportThe present study has received no partial or full financial support.
Conflicts of interestThe authors declare that there are no financial or personal interests that may bias or influence their actions in relation to this study.
Please cite this article as: Sánchez-Casado M, Hostigüela-Martín VA, Raigal-Caño A, Labajo L, Gómez-Tello V, Alonso-Gómez G, et al. Escalas pronósticas en la disfunción multiorgánica: estudio de cohortes. Med Intensiva. 2016;40:145–153.

