


Edited by: Ana Ochagavía - Hospital Universitario de Bellvitge. L'Hospitalet de Llobregat. Barcelona. Spain.
Last update: March 2024
More infoComprehensive ultrasound assessment has become an essential tool to facilitate the diagnosis and therapeutic management of critically ill patients with acute respiratory failure (ARF). There is evidence supporting the use of ultrasound for the diagnosis of pneumothorax, acute respiratory distress syndrome, cardiogenic pulmonary edema, pneumonia and acute pulmonary thromboembolism, and in patients with COVID-19. In addition, in recent years, the use of ultrasound to evaluate responses to treatment in critically ill patients with ARF has been developed, providing a noninvasive tool for titrating positive end-expiratory pressure, monitoring recruitment maneuvers and response to prone position, as well as for facilitating weaning from mechanical ventilation. The objective of this review is to summarize the basic concepts on the utility of ultrasound in the diagnosis and monitoring of critically ill patients with ARF.
La evaluación integral mediante ecografía se ha convertido en una herramienta indispensable para facilitar el diagnóstico y el manejo terapéutico en los pacientes críticos con insuficiencia respiratoria aguda (IRA). Existe evidencia que apoya el uso de la ecografía para el diagnóstico de neumotórax, síndrome de distrés respiratorio agudo, edema pulmonar cardiogénico, neumonía, tromboembolismo pulmonar agudo y el paciente con COVID-19. Además, en los últimos años, se ha desarrollado el uso de la ecografía para evaluar la respuesta a los tratamientos en los pacientes críticos con IRA, brindando una herramienta no invasiva para la titulación de la presión positiva al final de la espiración, monitorizar las maniobras de reclutamiento y la respuesta al prono, así como para facilitar la retirada de la ventilación mecánica. El objetivo de esta revisión es resumir los conceptos básicos sobre la utilidad de la ecografía en el diagnóstico y monitorización de los pacientes críticos con IRA.
Acute respiratory failure (ARF) is one of the main problems we face in the Intensive Care Unit (ICU). In patients with ARF, imaging techniques are a key diagnostic tool. In this regard, ultrasound allows noninvasive, real-time imaging at the patient’s bedside, and its diagnostic performance has been shown to be superior to that of chest radiographs for diagnosing the main disorders that affect the critically ill, constituting an alternative to computed tomography (CT).1
Ultrasound in the differential diagnosis of respiratory failure in the critical patientBlue protocolThe BLUE (Bedside Lung Ultrasound in Emergency) protocol is the first ultrasound-based ARF diagnostic algorithm.2
As commented in previous chapters of this series, the protocol generates patterns based on the presence in the studied lung fields of A and B lines, pleural sliding and the existence of the lung point and PLAPS (posterolateral alveolar and pleural syndrome). A diagnostic algorithm for ARF was proposed based on these patterns (Fig. 1). Globally, these profiles afford a correct diagnosis in 90.5% of the cases (Table 1). The diagnosis of pneumonia is more difficult, and is established with greater precision in the presence of PLAPS (Fig. 2).
 can be established based on the ultrasound patterns and lung sliding. PLAPS: posterolateral alveolar and pleural syndrome.")
Blue Protocol.
The most frequent patterns are shown: Pattern A with A lines at the four studied points; pattern B with B lines at the four quadrants; and pattern A/B with variable distribution of the A and B lines. The different diagnoses in patients with acute respiratory failure (ARF) can be established based on the ultrasound patterns and lung sliding. PLAPS: posterolateral alveolar and pleural syndrome.
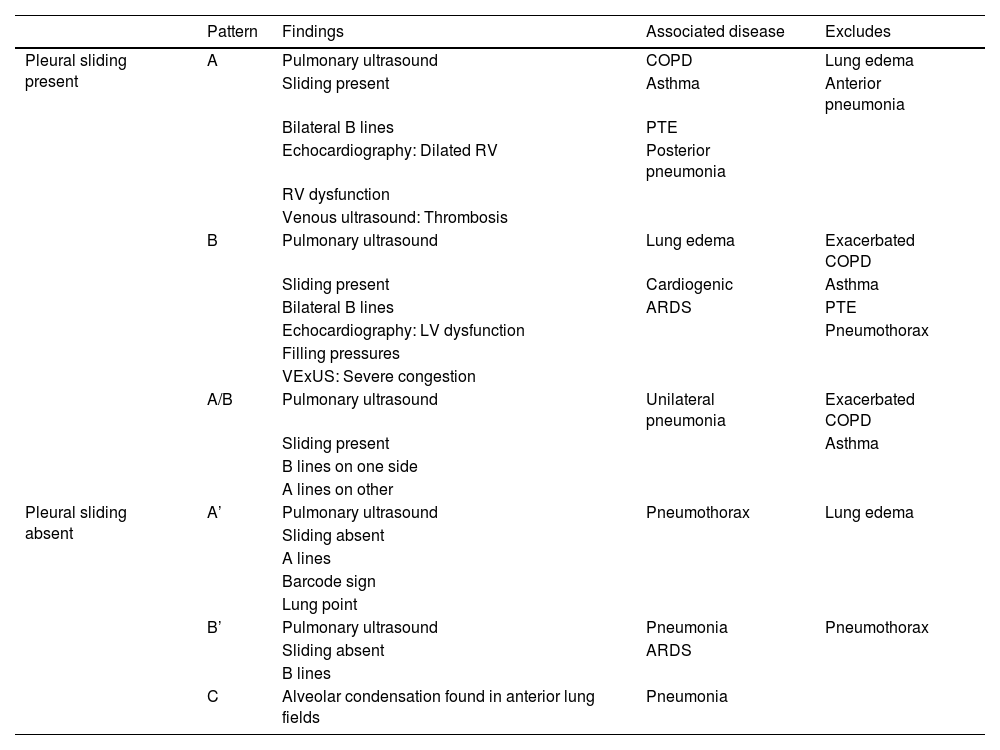
Patterns and associated disease conditions according to the Blue protocol.
| Pattern | Findings | Associated disease | Excludes | |
|---|---|---|---|---|
| Pleural sliding present | A | Pulmonary ultrasound | COPD | Lung edema |
| Sliding present | Asthma | Anterior pneumonia | ||
| Bilateral B lines | PTE | |||
| Echocardiography: Dilated RV | Posterior pneumonia | |||
| RV dysfunction | ||||
| Venous ultrasound: Thrombosis | ||||
| B | Pulmonary ultrasound | Lung edema | Exacerbated COPD | |
| Sliding present | Cardiogenic | Asthma | ||
| Bilateral B lines | ARDS | PTE | ||
| Echocardiography: LV dysfunction | Pneumothorax | |||
| Filling pressures | ||||
| VExUS: Severe congestion | ||||
| A/B | Pulmonary ultrasound | Unilateral pneumonia | Exacerbated COPD | |
| Sliding present | Asthma | |||
| B lines on one side | ||||
| A lines on other | ||||
| Pleural sliding absent | A’ | Pulmonary ultrasound | Pneumothorax | Lung edema |
| Sliding absent | ||||
| A lines | ||||
| Barcode sign | ||||
| Lung point | ||||
| B’ | Pulmonary ultrasound | Pneumonia | Pneumothorax | |
| Sliding absent | ARDS | |||
| B lines | ||||
| C | Alveolar condensation found in anterior lung fields | Pneumonia |
RV: right ventricle; COPD: chronic obstructive pulmonary disease; PTE: pulmonary thromboembolism; LV: left ventricle; VExUS: venous congestion evaluation by ultrasound; ARDS: acute respiratory distress syndrome.
 Images of PLAPS, showing hypoechoic zones delimiting a poorly defined margin (small arrow) and pleural effusion (large arrow). B) Subpleural consolidation comprising a hypoechoic zone in contact with the pleural line surrounded by an irregular hyperechoic margin (shred sign). C) Air bronchogram showing hyperechoic lines (small arrow) in the context of lung hepatization, surrounded by adjacent pleural effusion (large arrow). D) Bar code pattern (stratosphere sign) in M mode, corresponding to pneumothorax. E) Seashore pattern in a lung with preserved pleural sliding. F) M mode positioned (left) in the zone corresponding to the lung point (arrow, image at right). Oscillation is observed of the seashore (white arrows) and barcode patterns (yellow arrows) in relation to the inspiratory and expiratory phases. G) Thrombus in the internal jugular vein, manifesting as a hyperechoic image occupying most of the vascular lumen. H) Pulmonary infarction: hypoechoic zone, containing a hyperechoic image (obtained with a low-frequency probe), corresponding to the bronchial tree. I) Pulmonary infarction zone (red arrow) in the lung computed tomography scan of the same patient.")
The most frequent findings in patients with acute respiratory failure.
A) Images of PLAPS, showing hypoechoic zones delimiting a poorly defined margin (small arrow) and pleural effusion (large arrow). B) Subpleural consolidation comprising a hypoechoic zone in contact with the pleural line surrounded by an irregular hyperechoic margin (shred sign). C) Air bronchogram showing hyperechoic lines (small arrow) in the context of lung hepatization, surrounded by adjacent pleural effusion (large arrow). D) Bar code pattern (stratosphere sign) in M mode, corresponding to pneumothorax. E) Seashore pattern in a lung with preserved pleural sliding. F) M mode positioned (left) in the zone corresponding to the lung point (arrow, image at right). Oscillation is observed of the seashore (white arrows) and barcode patterns (yellow arrows) in relation to the inspiratory and expiratory phases. G) Thrombus in the internal jugular vein, manifesting as a hyperechoic image occupying most of the vascular lumen. H) Pulmonary infarction: hypoechoic zone, containing a hyperechoic image (obtained with a low-frequency probe), corresponding to the bronchial tree. I) Pulmonary infarction zone (red arrow) in the lung computed tomography scan of the same patient.
The sensitivity of ultrasound in detecting pneumothorax is greater than that of conventional radiological and similar to that of CT.3,4
The ultrasound exploration of pneumothorax yields the following findings:
- -
Absence of lung sliding.
- -
Absence of B lines (as there is no lung parenchyma immediately below the pleural line).
- -
Change in the normal pattern in M mode from the “seashore” pattern to the “barcode” or “stratosphere” sign. A series of parallel lines of variable thickness are observed (Fig. 2). This sign may also appear on exploring large bullae that can be confused with pneumothorax.
- -
Presence of the so-called lung point, which is seen when pneumothorax is not massive. This sign is characterized by the appearance of lung in 2D imaging in inspiration, with disappearance in expiration - corresponding to the point where the visceral and parietal pleural layers separate from each other. It can also be found as changes in M mode, consisting of a transition from the “seashore” pattern to a “barcode” pattern in successive respiratory cycles (Fig. 2 and video 1 of the electronic supplementary material [ESM]). Its specificity in diagnosing pneumothorax is 100%.
Both acute respiratory distress syndrome (ARDS) and acute lung edema of cardiogenic origin produce an ultrasound image with a bilateral B pattern of the BLUE protocol, known in both cases as interstitial syndrome.2 In interstitial syndrome of non-cardiogenic origin, the lung fields are usually affected unequally, particularly at the start of respiratory failure, with the involvement of gravity-dependent zones, in contrast to cases of cardiac origin, where the distribution is hydrostatic. Previous lung disorders with the destruction of parenchyma (emphysema) alter the homogeneity of the findings in acute lung edema.
Some additional data such as an increase in thickness and irregularity of the pleural line suggest interstitial syndrome to be related to some inflammatory process, whether pneumonia or some other inflammatory lung condition.4 The observation of subpleural condensations also suggests pneumonia as the origin of interstitial syndrome.
However, the ultrasound study of heart function (both systolic and diastolic) and of the caliber of the inferior vena cava, complement the information, allowing a more precise diagnosis.
PneumoniaThe ultrasound diagnosis of pneumonia is based on identification of the B', A/B and C patterns. The presence of PLAPS adds diagnostic precision. It is very important to find subpleural condensations in the anterior lung fields, characterized by hypoechoic zones in contact with the pleural line.5 These hypoechoic zones present irregular margins, referred to as the fractal or shred sign (Fig. 2).
The appearance of a mobile or dynamic air bronchogram points to the diagnosis of pneumonia. This consists of linear hypoechoic images, sometimes with a ramified appearance, that displace with breathing if the corresponding airway is patent. The image is produced by gas penetration into the bronchial tree containing secretions (Fig. 2 and video 2 ESM).
Pulmonary thromboembolismIn the context of a patient with respiratory failure, the bilateral A pattern of the BLUE protocol implies a possible diagnosis of pulmonary embolism This exploration is complemented by vascular evaluation in search of venous thrombosis (Fig. 2) and cardiac exploration in search of signs of dysfunction or dilatation of the right ventricle.
Another possible ultrasound finding related to pulmonary embolism is the image of lung infarction, characterized by a hypoechoic, triangular subpleural zone6 (Fig. 2).
Decompensated COPD and asthmaThe presence of a bilateral A pattern and the absence of venous thrombosis and PLAPS are data suggesting ARF to be attributable to chronic obstructive pulmonary disease (COPD) or asthma.2
The usefulness and precision of ultrasound in application to these diagnoses, obviating the need for patient transfer to Radiodiagnosis, has been reported in a recent meta-analysis, with a sensitivity of 0.78 (95%CI: 0.67−0.86) and a specificity of 0.94 (95%CI: 0.89−0.97).7
Ultrasound in patients with COVID-19Pulmonary ultrasound has been shown to be useful in patients with COVID-19.8 In this regard, ultrasound provides information on the diagnosis and extent of lung involvement in the early or scantly symptomatic phase, with greater diagnostic capacity than conventional radiography.9
In general, the main ultrasound findings are no different from those seen in patients with ARDS of other origins and in other types of lung disease. Accordingly, the main findings consist of B lines, reflecting interstitial or alveolo-interstitial involvement in SARS-CoV-2 pneumonia. Nevertheless, there are some particularities,10,11 such as a characteristic artifact that appears in the early phases (“light beam” sign). This is a hyperechogenic band-shaped image that spreads from a regular pleural line and a background of A lines, and which appears and disappears with pleural slipping. The rest of the findings are summarized in Fig. 3.
 Separated B lines. B) Coalescent B lines. C) “White lung”. D) Irregular and fragmented pleural line. E) and F) Subpleural consolidations.")
The most frequent findings in patients with acute respiratory failure associated with COVID-19.
This includes the presence of B lines in all their possible forms, even to the point of forming a “white lung” image. They may arise from the pleural line or from small peripheral consolidations. A) Separated B lines. B) Coalescent B lines. C) “White lung”. D) Irregular and fragmented pleural line. E) and F) Subpleural consolidations.
Although none of these signs are specific of COVID-19 pneumonia, the distribution of such alterations in a concrete epidemiological scenario implies great specificity. Bilateral involvement in the form of patchy groups of B lines coexisting with other “free” lung zones is characteristic.10,12 The lesions exhibit a peripheral distribution and predominate in the posteroinferior fields, extending to lateral and anterior regions as the disease progresses. In contrast, the appearance of significant pleural effusion or large lobar consolidations makes it necessary to take other alternative diagnoses or complications into account.12
Ultrasound as a tool guiding the management of patients with respiratory failureIntubationThe usefulness of ultrasound in intubation includes both evaluation of the upper airway to predict a difficult airway,13,14 and confirmation of correct positioning of the endotracheal tube (ETT) after intubation.15,16 We will focus on this latter aspect, since emergent intubation is one of the most common scenarios in the critical patient, where in most cases the airway cannot be evaluated before intubation.
Confirmation of intubationConfirmation of correct positioning of the ETT is crucial, since it has been estimated that 3.3% of all emergent intubations place the tube in the esophagus.17
Tracheal ultrasound has been shown to be as useful as capnography in excluding esophageal intubation, with a sensitivity of 98.7% and a specificity of 97.1%, and it performs even better in patients with low cardiac output in the context of cardiac arrest.18 Furthermore, tracheal ultrasound offers the advantage of not needing the start of ventilations for confirmation (in contrast to capnography), thus reducing the risk of gastric distension and bronchoaspiration.
In order to discard esophageal intubation we need to use a high-frequency linear transducer located at the suprasternal notch, obtaining an anterior transverse image of the neck and airway. In this plane, the trachea is identifies as a hyperechogenic inverted U-shaped line generated by the mucosa-airway interface, with a typical posterior acoustic shadow artifact (Fig. 4). The esophagus is collapsed and in a left lateral paratracheal position. Esophageal intubation would be detected by the observation of an anechoic circular structure adjacent to the trachea (generally on the left side of the trachea) - a sign known as “double trachea” (Fig. 4).
 Normal view centered on the trachea at the height of the suprasternal notch. B) Normal view lateralized to the left, showing the carotid artery.")
A protocol has been proposed,16 combining tracheal and thoracic ultrasound, to assess the viability of ultrasound in confirming correct positioning of the ETT in ICU patients (Algorithm 1).

Algorithm proposed for checking the correct positioning of the endotracheal tube.16 ETT: endotracheal tube; IBI: inadvertent bronchial intubation. *Infrequent.
In some doubtful cases or in order to obtain further confirmation, diaphragmatic ultrasound can be used to observe the diaphragmatic excursions during the ventilations.
Response to recruitment maneuvering and the prone positionUltrasound is able to afford a semi-quantitative assessment of the degree and distribution of lung aeration. In addition, the possibility of repeating the exploration at the patient bedside allows us to assess the changes in response to the treatments and maneuvers used in patients with ARF.
Quantification of lung aerationThe different ultrasound patterns reflect different grades of aeration (Fig. 5). In this regard, the A pattern corresponds to a normally aerated lung parenchyma. The presence of three or more B lines in an intercostal space and separated (B1) indicates moderate loss of aeration, secondary to interstitial involvement. Coalescent B lines (B2) in turn appear in cases of severe loss of aeration, secondary to alveolar involvement. When the loss of aeration is complete, we observe a consolidation pattern (C).19
.")
Ultrasound patterns of lung aeration.
A: A lines pattern, normal aeration; B: B ≥ 3, separated B lines indicating moderate loss of aeration; C: coalescent B lines indicating severe loss of aeration; D: tissue or consolidation pattern, indicating a complete loss of aeration. Each pattern produces a score for generating the lung ultrasound score (LUS).
By dividing each hemithorax into regions and assigning a numerical value to each pattern, we can obtain a global score. The most widely used classification analyzes 12 thoracic regions (6 per hemithorax: upper and lower in the anterior, lateral and posterior quadrants).19 Each region is scored from 0 to 3 points according to the ultrasound pattern. Based on this classification, the Global Score or the Lung Ultrasound Score (LUS) ranges from 0 (aerated lungs) to 36 (lungs with total loss of aeration). In this way, variations in this score can be used to express both loss of aeration and re-aeration in different clinical situations.19,20
Modifications of this classification have been proposed with the aim of improving precision in assessing lung aeration.21 In this case, an A pattern continues to be classified as normal, with a C pattern being indicative of complete loss of aeration. The degree of impairment between these two extreme classifications varies according to the involvement of the pleural line. Loss of aeration is considered to be moderate when less than 50% of the pleural line is affected. However, if we find artifacts (B lines or subpleural consolidations) affecting over 50% of the pleural line, severe loss of aeration is diagnosed (Table 2).
Classification of lung aeration.
| Classical | Modified | |
|---|---|---|
| 0: Normal aeration | A lines (<3 B lines) | A lines (<3 B lines) |
| 1: Moderate loss | ≥B1 lines, separated | Occupation due to artifacts ≤50% of pleura |
| 2: Severe loss | B2 lines, coalescent | Occupation due to artifacts >50% of pleura |
| 3: Complete loss | Tissue pattern | Tissue pattern |
Ultrasound allows us to assess the distribution of loss of aeration.22 This information is useful for distinguishing between two ARDS phenotypes according to their morphological features. Involvement of the posteroinferior regions predominates in patients with focal ARDS, with severe or complete loss of aeration, while the anterior lung fields are relatively preserved. These patients respond better to the prone position,23 while high positive end-expiratory pressure (PEEP) values may give rise to overdistension of the areas with preserved aeration.24 In contrast, patients with diffuse ARDS, where loss of aeration is characterized by patchy involvement of all the lung regions, respond better recruitment maneuvers and higher PEEP levels.24 Identification of the different ARDS phenotypes according to their morphology is essential, since the choice of ventilation strategy based on the classification can have an impact upon the clinical prognosis.25
By using the aforementioned ultrasound patterns (A, B1, B2 and C), we can calculate the LUS. A score of ≥3 in anterior regions allows precision in discarding a focal morphology26 compared with CT. Another two methods have been described, using the same scoring system and which complement the information with the study of lateral and posterior fields.27
Prediction of response to the prone positionA number of studies have analyzed the capacity of ultrasound to predict the response to prone positioning in patients with ARDS.23,28,29 The presence of an ultrasound pattern indicating normal aeration in anterior fields in the supine position could predict a favorable response to prone positioning, defined as improvement in oxygenation.23 Similar results have recently been reported in patients with ARDS secondary to COVID-19.29 However, although ultrasound appears to predict re-aeration of dorsal zones after prone positioning, it has not been able to predict improvement of oxygenation in all studies30 - probably due to the different mechanisms involved in the response to the prone position and the limitations of ultrasound in quantifying aeration and lung overdistension.31
As a result of the SARS-CoV-2 pandemic, the use of the prone position has increased considerably in patients with hypoxemic ARF not subjected to invasive mechanical ventilation. In patients of this kind it has also been suggested that the changes in aeration pattern evaluated with ultrasound could predict response to the prone position.32 Furthermore, in patients with hypoxemic ARF receiving high-flow oxygen therapy, the success of the technique appears to be related to a greater decrease in LUS in dorsal zones in response to the prone position.33
Response to recruitment maneuvering and PEEP titrationBased on its high sensitivity and specificity in detecting lung collapse,34 and its capacity to monitor changes in lung aeration in real time, ultrasound has been postulated as possibly useful for guiding recruitment maneuvering and PEEP titration.35 In fact, a correlation has been described between lung recruitment induced by PEEP, measured from the pressure-volume curves, and the re-aeration score assessed by ultrasound.19 However, the changes in ultrasound score do not appear to be associated with recruitment as assessed by CT, which is regarded as the gold standard.36 This is probably because the changes in ultrasound score are attributable to any change in lung aeration, and not only to the aeration of consolidated zones.
Based on the study of lung aeration in the mentioned 12 quadrants, we can detect the changes induced by an increase in PEEP by observing a progressive decrease in B lines or their appearance in zones that were previously consolidated in the case of recruitment.19
Although on an experimental basis, an approach has been proposed to titrate PEEP with ultrasound in ARDS patients37 (Algorithm 2).
 guided by pulmonary ultrasound. The loss of aeration score is calculated from the sum of the changes observed in the ultrasound patterns in each of the 12 quadrants studied. Pattern A: A lines pattern; Pattern B1: separated B lines pattern; Pattern B2: coalescent B lines pattern; Pattern C: lung condensation pattern.")
Algorithm proposed for the titration of positive end-expiratory pressure (PEEP) guided by pulmonary ultrasound. The loss of aeration score is calculated from the sum of the changes observed in the ultrasound patterns in each of the 12 quadrants studied. Pattern A: A lines pattern; Pattern B1: separated B lines pattern; Pattern B2: coalescent B lines pattern; Pattern C: lung condensation pattern.
There are no specific ultrasound signs to detect lung overdistension secondary to the increase in intrathoracic pressure, though some indirect signs may lead us to suspect it. The considerable decrease or even disappearance of pleural sliding may be associated with a significant alteration in ventilation related to high PEEP values,38 particularly if it reappears when PEEP decreases again.39 In any case, there is limited available evidence on the use of lung ultrasound for PEEP titration, and it should not be the only method for performing titration, since it does not allow precise evaluation of lung hyperinsufflation induced by PEEP.
Usefulness of ultrasound in weaning from mechanical ventilationFailed weaning or early reintubation is associated with high morbidity-mortality.40 Evaluation seeking to establish an early diagnosis of the causes that complicate weaning from ventilation will therefore improve the patient prognosis. There are three main causes of weaning failure: respiratory, cardiac and neuromuscular.41 In this context, ultrasound study of the heart, lungs and respiratory muscles can help us understand the pathophysiological process whereby weaning failure occurs (Fig. 6 and Algorithm 3).
 Pulmonary ultrasound with the detection of an increase of ≥6 B lines during the spontaneous breathing trial (SBT) for the diagnosis of weaning-induced pulmonary oedema (WIPO). B) Echocardiography, four-chamber apical plane imaging for the study of systolic function of the left ventricle and its structural alterations (hypertrophy, dilatation, severe mitral valve insufficiency). C) Diaphragm excursion study in two-dimensional imaging (see video in electronic supplementary material). D) Diaphragm excursion study in M mode. Note the wave generated by diaphragm excursion with respiratory motion. An excursion of <10 mm is considered to be pathological. E), F) and G) Images used to calculate the lung ultrasound score (LUS), as described in the text. H) Study of diastolic function, pulsed Doppler view of transmitral flow, showing the early (E, white arrow) and late filling waves (A, red arrow). I) Study of diastolic function, tissue Doppler view of the lateral mitral annulus, showing the e")
Main ultrasound explorations used for diagnosing the cause of mechanical ventilation weaning failure.
Division is made into explorations requiring a basic training in ultrasound and those requiring advanced training. A) Pulmonary ultrasound with the detection of an increase of ≥6 B lines during the spontaneous breathing trial (SBT) for the diagnosis of weaning-induced pulmonary oedema (WIPO). B) Echocardiography, four-chamber apical plane imaging for the study of systolic function of the left ventricle and its structural alterations (hypertrophy, dilatation, severe mitral valve insufficiency). C) Diaphragm excursion study in two-dimensional imaging (see video in electronic supplementary material). D) Diaphragm excursion study in M mode. Note the wave generated by diaphragm excursion with respiratory motion. An excursion of <10 mm is considered to be pathological. E), F) and G) Images used to calculate the lung ultrasound score (LUS), as described in the text. H) Study of diastolic function, pulsed Doppler view of transmitral flow, showing the early (E, white arrow) and late filling waves (A, red arrow). I) Study of diastolic function, tissue Doppler view of the lateral mitral annulus, showing the e' wave (white arrow). J) Image of the diaphragm in two-dimensional mode in the appositioning zone over the ninth intercostal space. The diaphragm is the structure located between the two hyperechogenic lines identified with the arrows (upper pleura, lower diaphragm; video and details in electronic supplementary material). K) Image in M mode for studying diaphragmatic thickening, identifying maximum thickness in inspiration and minimum thickness in expiration.

During the weaning phase, the increase in cardiac preload and afterload produced by the change in intrathoracic pressure from positive to negative, the increase in catecholamine secretion, and respiratory effort42 can induce cardiogenic WIPO (weaning-induced pulmonary oedema). Although the incidence of WIPO has not been well established, it has been estimated to be involved in 30%–87% of all cases of weaning failure.43,44
Echocardiographic study of diastolic function (ventricular filling and myocardial relaxation) and left ventricle filling pressures plays a key role in assessing mechanical ventilation weaning failure.45 Pulsed Doppler study of transmitral flow and tissue Doppler evaluation of mitral annular velocity allow us to identify the E and e' waves, respectively (Fig. 6). The E/e' ratio has been proposed as a measure to estimate left ventricle filling pressure,46 though the results are contradictory.47
The increase in venous return induced by the conversion to spontaneous breathing is reflected on the echocardiogram as a significant increase in the E wave.48 In patients with diastolic dysfunction and poorly compliant ventricles (e' wave < 10 cm/s), the increase in venous return can cause a rise in filling pressure that will be reflected by an increase in E/e'. Lamia et al. found that the combination E/A > 0.95 and E/e' > 8.5 detected those patients in which the spontaneous breathing trial (SBT) induced an increase in capillary pressure.49 A recent meta-analysis has shown that patients with weaning failure present higher E wave velocities and lower e' wave velocities, with significantly higher E/e' ratios, than patients who successfully complete SBT.50 However, the studies included in the analysis show very heterogeneous values for the different velocities; no cut-off point therefore can be established.
Systolic function, assessed from the ejection fraction, has not been significantly associated with weaning failure.50 However, like all the findings referred to the ejection fraction in critical patients, this must be interpreted with caution, since the parameter is largely dependent on the loading conditions. Other parameters, such as the S' wave or strain, could play an important role in the context of weaning from mechanical ventilation.
Pulmonary ultrasoundIn patients subjected to mechanical ventilation, the start of spontaneous breathing is associated with a certain loss of lung aeration51 due to alveolar occupation secondary to lung edema in the context of WIPO or to alveolar derecruitment secondary to loss of PEEP, or associated with diaphragm dysfunction. Ultrasound allows us to assess and monitor this loss of aeration objectively through the LUS. Calculation of the LUS 60 min after the start of SBT has been shown to be a precise tool for predicting the appearance of respiratory failure after extubation.51 Patients presenting respiratory failure after extubation have higher LUS, independently of the underlying cause. The identified threshold for identifying an 85% risk of failure after extubation is LUS > 17, while a score of <13 indicates an insignificant risk of failure following extubation. It should be mentioned that the LUS, as it is defined, is limited in clinical practice by its complexity and the time needed for its precise calculation.
Lung ultrasound is also useful for detecting WIPO. In this case, the study reduced to the four anterior thoracic quadrants of the BLUE protocol, with quantification of the B lines of each quadrant before and at the end of SBT, allows the diagnosis of WIPO with a sensitivity of 88% and a specificity of 88%, if the number of B lines increases by ≥6 during SBT.52
Diaphragmatic ultrasoundThe diaphragm is the main respiratory muscle and plays a crucial role in ventilation. The existing evidence suggests that most critical patients subjected to mechanical ventilation develop some degree of diaphragm dysfunction, with an important role in mechanical ventilation weaning failure.53
Although trans-diaphragmatic pressure measurement is considered to be the gold standard for diagnosing diaphragm dysfunction, ultrasound allows noninvasive visualization of the diaphragm and its variation during the respiratory cycles. Two different ultrasound parameters have been described for evaluating diaphragmatic function (Fig. 6, videos 3 and 4 ESM).
The first parameter is the measurement of diaphragmatic excursion.54 This parameter is easily measured with a 3−5 MHz probe on the midclavicular line, below the rib margin and oriented dorsally to visualize excursion of the dome of the diaphragm, using the liver (or spleen, on the left side) as acoustic window (Fig. 6). Patients with diaphragm dysfunction, defined as an excursion of <10 mm for either hemidiaphragm, are characterized by longer weaning times and a greater frequency of reintubation.55 A recent systematic review56 has concluded that diaphragmatic excursion can predict weaning failure with a diagnostic odds ratio (OR) of 9.14 (95%CI 4.74–17.64).
Some studies have proposed the integration of diaphragmatic excursion in an index relating it to respiratory frequency.57 This index (respiratory frequency/diaphragmatic excursion in mm) has shown better results than the isolated assessment of diaphragmatic excursion.
The second parameter refers to diaphragmatic thickening during inspiration. By placing a 10 MHz probe over the ninth intercostal space, in the diaphragm appositioning zone, we can measure the maximum (at the end of inspiration) and the minimum (at the end of expiration) diaphragmatic thickness, with calculation of the thickening fraction ([thickness at the end of inspiration - thickness at the end of expiration]/thickness at the end of expiration).58 In this regard, a thickening fraction of 30%–36% is associated with weaning success, with a diagnostic odds ratio of 42.6 (95%CI 17.6–103.0).59,60
In clinical practice, on selecting one diaphragmatic assessment measure or other, we should take the SBT modality into account. It has been seen that in patients ventilated in pressure support mode, diaphragmatic thickening is correlated to invasive parameters of diaphragmatic pressure, being a reliable indicator of respiratory effort. In contrast, excursion is not correlated to respiratory effort, and only reflects passive displacement of the diaphragm due to the pressure generated by the ventilator. It therefore should only be used in those patients in which SBT is performed in T-tube.61
Limitations of ultrasound in patients with ARF and weaning from mechanical ventilationIt is important to take the limitations of ultrasound into account when interpreting the findings. Firstly, the technique is operator dependent and requires a degree of prior training that may be basic or advanced.62 While basic study based on the BLUE protocol or visual estimation of left ventricular systolic function or diaphragmatic excursion requires only basic training, the quantitative assessment of lung aeration or study of the airway, diaphragmatic thickening or the left ventricle filling pressures requires advanced operator training.63
In addition, pulmonary ultrasound allows visualization of the alterations and artifacts in direct contact with the pleura; as a result, it is not possible to visualize certain deep lesions that are not evidenced on the pleural line. The findings therefore must be interpreted with caution, and always taking the clinical context into account (64).
The exploration moreover may be complicated by the anatomical characteristics of the patient or the presence of artificial devices or subcutaneous emphysema. Likewise, visualization of the pleura is limited by the amplitude of the intercostal space.
Lastly, one of the main limitations of ultrasound, particularly when evaluating recruitment, is the absence of specific signs for detecting pulmonary overdistension caused by the increase in intrathoracic pressures.19
Ethical approval and consent to participationNot applicable.
Conflicts of interestThe authors declare that they have no conflicts of interest.
FundingNo funding has been received for this study and publication.

